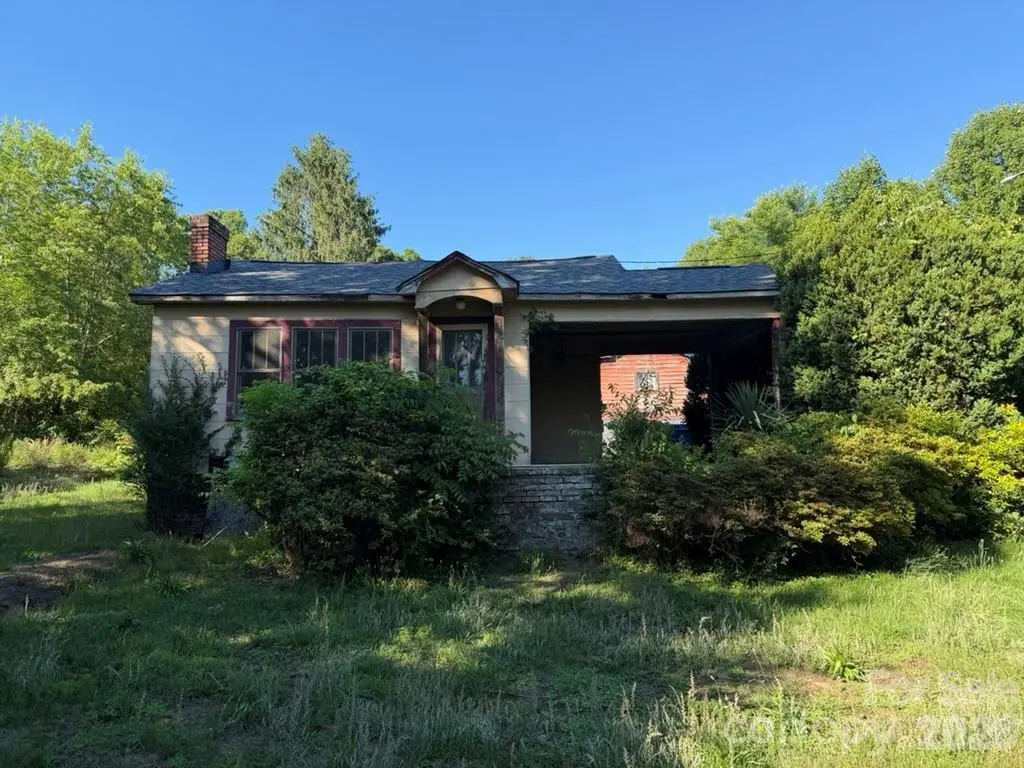
3370 Rocky Rd · Gamewell, NC
Flood risk 1/10 · Minimal
- FEMA flood zone
- X (unshaded)
- Chance of flooding over 30 yrs
- 0.0%
- Est. flood insurance / yr
- $507 – $1,088
Fire risk 5/10 · Moderate
- Est. fire insurance / yr
- $906 – $1,684
Heat risk 5/10 · Moderate
- Hot days now (above 104°F)
- 7 days/yr
- Hot days in 30 yrs
- 18 days/yr
Wind risk 2/10 · Minimal
- Chance of severe wind over 30 yrs
- 1.0%
Air-quality risk 2/10 · Minimal
- Unhealthy air days now
- 1 days/yr
- Unhealthy air days in 30 yrs
- 1 days/yr
Risk factors via First Street. Map © Google.
Why this score? — see what drove the B- grade
The composite is a weighted blend of 9 inputs, each scored 0–100. Each bar is that input's sub-score; the figure is the points it added to the 100-point composite (weight × sub-score).
- Cash flow +30.0/30.0
- DSCR +10.0/10.0
- 1% rule +8.6/10.0
- ARV discount +7.5/15.0
- Schools +3.5/10.0
- Livability +3.0/5.0
- Rent growth +2.5/5.0
- Condition / age +2.5/5.0
- Appreciation +0.0/10.0
$69,900
🖨 Deal sheet 📄 Offer letter ✓ Due diligence
Listing remarks
Attention Investors and Renovators! 3370 Rocky Road is a full rehab opportunity with tremendous potential. The home requires extensive repairs and updating and should be considered a complete renovation project. Property is being sold as-is, and seller will make no repairs (but is willing to consider anything needed for financing concerns). Exercise caution when touring the property. Bring your vision and transform this property into something special.
Key facts
- 0.51 acre lot
- Built 1951
- Listed 6 days
Property features AI
Finance
- HOA & community: No HOA
Exterior
- Parking: Driveway
- Utilities: City water (and other—see remarks); Septic system installed
- Home design: Single-family residence; Site-built construction; One story; RA20 zoning
- Construction: Site-built construction materials listed as 'Other - see remarks'; Crawl space foundation
- Exterior features: Half-acre lot (approx. 0.51 acres); Lot dimensions approximately 176 x 127; Roads are gravel and paved; Publicly maintained road
Interior
- Kitchen: No appliances listed
- Bedrooms: 2 bedrooms (main level)
- Bathrooms: 1 full bathroom
- Heating & cooling: No heating listed; No cooling listed
- Interior features: Single-level home; Crawl space foundation; Fireplace
- Laundry & utility: No laundry hook-ups or room (none listed)
Neighborhood map
What this means for you Summary
Snapshot
- This is a 2-bed/1.0-bath single-family listed at $70k.
Deal economics
- At list price, monthly cash flow is $291 ($3k/yr) — positive.
- The deal already cash-flows at list — no discount required.
- Meets the 1% rule at list price ($950 rent vs $70k).
- Cap rate 11.3% vs local median 1.3% in Gamewell — top-decile yield for the area; either an underpriced asset or a hidden risk that comps aren't pricing in. Stress-test before assuming the spread holds.
Location & tenants
- Location reads 60/100 on livability (#518 in NC) — a middle-class / working-renter tenant base. Strengths: cost of living A+, housing A+, crime B+; Watch: employment D, schools F, amenities F.
- Caldwell County Schools (suburban): math 38% / reading 46% proficiency, ranked #106 of 178 in NC (top 60%) — families likely to look elsewhere, expect single-tenant / working-renter base with shorter leases.
- Market conditions: 465 active listings in the ZIP; 2 comparable units currently listed for rent nearby; 217 units permitted in Caldwell County in 2024 (0 in 5+ unit buildings).
Forward outlook
- Local home prices are declining (-3.0%/yr); year-one equity from $483 of loan paydown is wiped out by about $2k of value loss. Plan a longer hold.
- Caldwell County population projected at -23% by 2050 — secular population decline; favor cash flow + early exit over multi-decade hold.
- At projected returns (-3.0% appreciation + 3.0% rent growth), your $20k cash investment doubles in ~7 years — after that, you're playing with house money.
Negotiation context
- Only 7 days on market — expect competitive offers; lowballing is unlikely to land.
- 2 sale attempts with the ask held roughly flat each time — persistent listings suggest the price (not the market) is what's stuck; bring a comps-based counter.
Risks & watch-outs
- Watch-outs: built in 1951 — expect roof / HVAC / electrical / plumbing capex.
- Climate carrying-cost: moderate wildfire risk; extreme-heat days projected 7→18/yr by 2055 (HVAC capex compounding) — expect insurance premiums to compound above CPI over the hold.
Questions for the listing agent
- Built in 1951 — when were the roof, HVAC, electrical panel, plumbing, and water heater last replaced?
- Is there a deadline driving the sale (1031 exchange, divorce, estate, relocation)? That informs how much negotiation room exists.
- Schools are F-rated, which usually means shorter tenancies and higher turnover. Who's the typical renter profile here, and what's been the actual vacancy rate?
- What's the average days-on-market for RENTAL listings here right now (not sales)? A rising rental-DOM trend means longer vacancies and softer asking-rent achievability than the comps imply.
- What's the recent tenant-quality profile in this submarket — average credit score on applications, eviction rate, late-payment / NSF rate, and stable-employment percentage? A property-management company in the area should have these aggregated.
- How much new for-sale + rental construction is in the pipeline within 1–3 miles? Heavy new supply typically softens prices + rents 12–24 months out; constrained supply supports both.
Investment metrics
- 1% rule
- 1.36% ✓
- Cap rate
- 11.29%
- Cash-on-cash
- 17.86%
- DSCR
- 1.79
- GRM
- 6.1
CMA / ARV
- ARV (on-the-fly)
- $201,720
- Comps found
- 3
Show comp detail 3 sales within ~0.75 mi
| Address | Dist | Beds/Ba | Sqft | Sold | Price | $/sf | Match |
|---|---|---|---|---|---|---|---|
| 3347 Sheely Rd | 0.48mi | 2/1.0 | 947 (-4%) | 14mo | $170,000 | $180 | 60 |
| 3404 Sheely Rd | 0.36mi | 3/1.5 (+1) | 1,056 (+7%) | 9mo | $217,000 | $205 | 56 |
| 3535 High West Dr | 0.55mi | 3/2.0 (+1) | 1,092 (+11%) | 23mo | $225,000 | $206 | 28 |
Match score weights: distance 35% · size 25% · config 20% · recency 20%. Top-matched comps best support the ARV.
Projected returns pro-forma
-3.0% appreciation · 3.0% rent growth · sell at horizon
- IRR
- 9.4%
- Equity multiple
- 1.37×
- Total profit
- $7,222
- Equity at exit
- $10,422
- IRR
- 18.5%
- Equity multiple
- 2.54×
- Total profit
- $30,173
- Equity at exit
- $6,044
Cash invested: $19,572 (down + closing). Projections, not guarantees.
Landlord ↔ Tenant lean methodology
- Overall (STATE)
- 85 Strongly Landlord-Friendly
- State North Carolina
- 85 Strongly Landlord-Friendly · R+3
- County
- — inherits STATE
- City
- — inherits STATE
ZIP-level market 28645
- Home prices YoY
- -17.4%
- Active inventory
- 465
- Price-to-rent
- 6.1×
Monthly cashflow live
- Estimated rent
- $950 medium interval (Pro) →
- Mortgage (P&I)
- −$367
- Tax from tax record
- −$64 /mo · $765/yr
- Insurance
- −$29
- HOA
- −$0
- Vacancy / Maint / Mgmt
- −$200
- Net cashflow
- $291
Break-even live
UW: 25.0% down · 7.5% · 30yr · 1.5% tax · 5.0% vac · 8.0% maint · 8.0% mgmt
Financing live
Cash to close
- Down payment
- $17,475
- Closing costs
- $2,097
- Reserves months
- —
- Total cash needed
- —
Loan-product check · same deal, 3 products live
Conventional
25% down · 7.5% · 30yr
- Down + closing
- —
- Monthly P&I
- —
- Monthly cashflow
- —
- DSCR
- —
- Eligible?
- —
Personal DTI + credit; lowest rate.
DSCR
20% down · 8.5% · 30yr
- Down + closing
- —
- Monthly P&I
- —
- Monthly cashflow
- —
- DSCR
- —
- Eligible?
- —
No personal income docs; deal must DSCR.
Hard money
10% down · 12.0% · 12mo
- Down + closing
- —
- Monthly P&I
- —
- Monthly cashflow
- —
- DSCR
- —
- Eligible?
- —
Short-term bridge; refi at stabilization.
Rent comps 2 comps
| Address | Beds | Baths | Sqft | Rent | $/sqft | DOM | Units | Dist |
|---|---|---|---|---|---|---|---|---|
| 3462 Smokehouse Ct Unit 9 Lenoir, NC | 2.0 | 1.0 | 800 | $1,000 | $1.25 | 13d | 1 | 0.94mi |
| 3465 Smokehouse Ct Unit 6 Lenoir, NC | 2.0 | 1.0 | 800 | $900 | $1.12 | 13d | 1 | 0.95mi |
Listing history 7 events
-
2026-06-19days on market $69,900 Active 7 DOM
-
2026-06-18days on market $69,900 Active 6 DOM
-
2026-06-17days on market $69,900 Active 5 DOM
-
2026-06-16days on market $69,900 Active 4 DOM
-
2026-06-15days on market $69,900 Active 3 DOM
-
2026-06-13remarks 456-char remark
-
2026-06-13$69,900 Active 1 DOM
ⓘ Source: listings_history table (triggers on properties + properties_extension) + one-shot
backfill from property_details.listing_events for pre-trigger history.
Tax reassessment forecast NC · Resets to sale price
- Current annual tax
- $765 · $64/mo
- Projected year-2 tax
- $765 · $64/mo
- Expected delta
- $0/yr ($0/mo · 0.0%)
ⓘ Screening estimate from a state-policy table — verify with the county assessor before closing.
Climate risk First Street
- Flood 1/10 Low FEMA zone X (unshaded) · 0% chance over 30 yrs
- Wildfire 5/10 Major
- Heat 5/10 Major 7 d/yr ≥104°F today · 18 d/yr by 30 yrs out
- Wind 2/10 Low 100% chance of damaging wind over 30 yrs
- Air quality 2/10 Low 1 unhealthy d/yr today · 1 by 30 yrs out
Nearby sold comps map
Loading sold comps map…
Walkable amenities ~0.75 mi
Loading nearby amenities…
Taxation est. · year 1
- Rental income
- $11,402
- − Mortgage interest
- −$3,915
- − Property taxes
- −$765
- − Insurance
- −$350
- − Repairs & maintenance
- −$912
- − Management
- −$912
- − Depreciation
- −$2,033
- Taxable income
- $2,515
- Est. tax owed @ 24.0%
- −$604
- After-tax cash flow
- $2,891/yr
For passive investors: Depreciation is non-cash, so a rental often shows a tax loss while cash-flowing — sheltering income. Rental losses are passive: they offset passive income freely, and up to $25,000/yr can offset ordinary (W-2) income if you actively participate and your MAGI is under $100k (phasing out to $0 by $150k); unused losses carry forward. On sale, claimed depreciation is recaptured at up to 25%, and gains may owe capital-gains tax (a 1031 exchange can defer both). Figures are a year-1 estimate at your 24.0% rate — not tax advice; consult a CPA.
Schools (NCES district)
- District
- Caldwell County Schools
- NCES district ID
- 3700580
- Math proficiency
- 38% ▲ 1.00%
- Reading proficiency
- 46% ▼ -1.00%
- Median HH income
- $37,165
- Composite
- 34.9/100
- National rank
- #5079
- State rank
- #106 of 178 in NC
Livability — Gamewell
- Score
- 60/100
- State rank
- #518
- US rank
- #19047
Category grades
Schools grade is shown separately in the Schools card above.
Census & demographics
- Census place
- Gamewell, NC
- Population (ZIP)
- 46,237
Population outlook (Caldwell County) Hauer SSP2
- Today (2025)
- 77,603 people
- By 2030
- 74,714 · -3.7%
- By 2040
- 67,732 · -12.7%
- By 2050
- 59,938 · -22.8%
- By 2075
- 43,232 · -44.3%
- By 2100
- 28,894 · -62.8%
Race, ethnicity, and origin ACS 2023
- Neighborhood character
- Predominantly White (83%)
- Race & ethnicity
- White 83% Hispanic / Latino 8% Black 6% Two or more races 5%
- Hispanic origin (detail)
- Mexican 3%
- Common ancestry
- Slovak 3% Serbian 2% Italian 2%
- Foreign-born
- 4% · Canada, Vietnam
- Languages at home
- 93% English-only · Spanish 5% Other Asian/Pacific 1%
Political lean MEDSL · Caldwell
- 2024 margin
- Solid R (+52.6) · D 23.4% · R 76.0%
- 2008→2024 swing
- -22.9pp toward R · 2008: -29.7pp · 2024: -52.6pp
- All cycles
- 2024: R+52.6 2020: R+51.1 2016: R+50.6 2012: R+35.7 2008: R+29.7
Not yet ingested
- Civics
- —
Market trends
- HPI YoY
- ▼ -56.03%
- Current HPI
- 265.0987
- Rent YoY
- —
- Metro
- —
- State GDP YoY
- ▲ 3.28%
- F500 in state
- 26
Industry mix (Fortune 500 HQ in NC)
| Industry | F500 HQs | Revenue |
|---|---|---|
| Financial Services | 2 | $213B |
|
||
| Retail | 2 | $95B |
|
||
| Industrial Conglomerate | 1 | $38B |
|
||
| Metals / Steel | 1 | $35B |
|
||
| Utilities | 1 | $30B |
|
||
| Industrial Machinery | 1 | $19B |
|
||
Price history
-26.4% since first listed3 events — show timeline
- 2026-06-12 Listed $69,900 CANOPYMLS as Distributed by MLS Grid
- 2026-03-26 Price Changed $78,999 CANOPYMLS as Distributed by MLS Grid
- 2026-02-06 Listed $94,990 CANOPYMLS as Distributed by MLS Grid
Property tax history
+10.8%/yrLatest (2025): $765 · +116.7% YoY. Source: county tax records.
Cash-flow waterfall
monthlySold comps — $/sqft
last 12 mo · ≤1 miLoading sold comps…