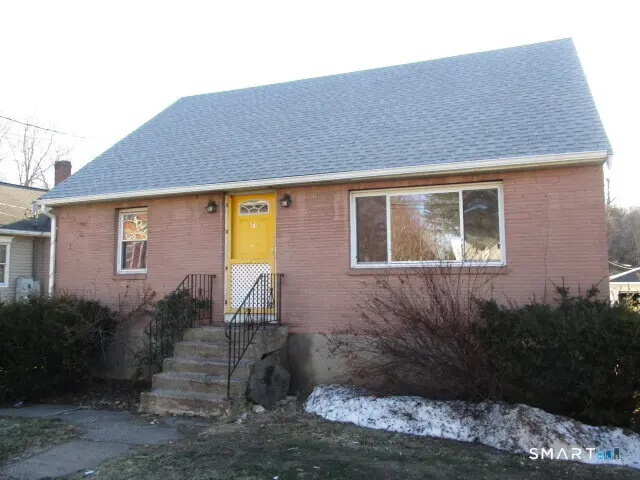
71 Broad St · Meriden, CT
Flood risk 1/10 · Minimal
- FEMA flood zone
- X (unshaded)
- Chance of flooding over 30 yrs
- 0.0%
- Est. flood insurance / yr
- $473 – $860
Fire risk 1/10 · Minimal
- Est. fire insurance / yr
- $829 – $1,539
Heat risk 5/10 · Moderate
- Hot days now (above 97°F)
- 7 days/yr
- Hot days in 30 yrs
- 16 days/yr
Wind risk 6/10 · Moderate
- Chance of severe wind over 30 yrs
- 27.0%
Air-quality risk 4/10 · Minor
- Unhealthy air days now
- 3 days/yr
- Unhealthy air days in 30 yrs
- 5 days/yr
Risk factors via First Street. Map © Google.
Why this score? — see what drove the C- grade
The composite is a weighted blend of 9 inputs, each scored 0–100. Each bar is that input's sub-score; the figure is the points it added to the 100-point composite (weight × sub-score).
- Cash flow +16.6/30.0
- ARV discount +15.0/15.0
- 1% rule +5.3/10.0
- DSCR +5.1/10.0
- Livability +4.2/5.0
- Schools +3.0/10.0
- Rent growth +2.9/5.0
- Condition / age +2.5/5.0
- Appreciation +0.0/10.0
$194,900
🖨 Deal sheet 📄 Offer letter ✓ Due diligence
Listing remarks MLS
RT 5 location - Brick dormered 6 room cape with 4 bedrooms 2 baths open to many possibilities,
Key facts
- 0.32 acre lot
- Built 1953
- Listed 36 days
Neighborhood map
What this means for you Summary
Snapshot
- This is a 3-bed/2.0-bath single-family listed at $195k.
Deal economics
- At list price, monthly cash flow is $116 ($1k/yr) — positive.
- The deal already cash-flows at list — no discount required.
- Meets the 1% rule at list price ($2k rent vs $195k).
- Recommended offer: $189k (3.0% below list) — sets the bar for market timing.
- Cap rate 7.0% vs local median 4.2% in Meriden — top-decile yield for the area; either an underpriced asset or a hidden risk that comps aren't pricing in. Stress-test before assuming the spread holds.
Location & tenants
- Location reads 85/100 on livability (#4 in CT, #505 nationally) — a professional / high-income tenant draw. Strengths: amenities A+, housing A+, health & safety A+.
- Meriden School District (suburban): math 27% / reading 41% proficiency, ranked #116 of 153 in CT (top 76%) — families likely to look elsewhere, expect single-tenant / working-renter base with shorter leases; 61% free/reduced lunch — lower-income household profile, screen leases tightly.
- Market conditions: Rents rising (+1.6%/yr); 98 active listings in the ZIP; 17 comparable units currently listed for rent nearby; rentals at typical pace (median 24d on market — plan ~3-4 weeks tenant-placement turnaround); 1,059 units permitted in South Central Connecticut Planning Region in 2024 (779 in 5+ unit buildings).
- This rent runs 34% of the median local income ($71k/yr) — at the standard rent-burdened threshold; future hikes will face affordability resistance.
Forward outlook
- Local home prices are declining (-3.0%/yr); year-one equity from $1k of loan paydown is wiped out by about $6k of value loss. Plan a longer hold.
Negotiation context
- It's been on market 36 days — a 3% lower offer ($189k) is reasonable based on typical stale-listing flexibility.
- 2 sale attempts with the ask held roughly flat each time — persistent listings suggest the price (not the market) is what's stuck; bring a comps-based counter.
Risks & watch-outs
- Watch-outs: built in 1953 — expect roof / HVAC / electrical / plumbing capex.
- Climate carrying-cost: major wind risk, 27% chance of damaging wind over 30y; extreme-heat days projected 7→16/yr by 2055 (HVAC capex compounding) — expect insurance premiums to compound above CPI over the hold.
Questions for the listing agent
- It's been on market 36 days. Have you received any prior offers? Is the seller open to a 3% concession, seller financing, or rate buy-down credit?
- Built in 1953 — when were the roof, HVAC, electrical panel, plumbing, and water heater last replaced?
- Is there a deadline driving the sale (1031 exchange, divorce, estate, relocation)? That informs how much negotiation room exists.
- What's the average days-on-market for RENTAL listings here right now (not sales)? A rising rental-DOM trend means longer vacancies and softer asking-rent achievability than the comps imply.
- What's the recent tenant-quality profile in this submarket — average credit score on applications, eviction rate, late-payment / NSF rate, and stable-employment percentage? A property-management company in the area should have these aggregated.
- How much new for-sale + rental construction is in the pipeline within 1–3 miles? Heavy new supply typically softens prices + rents 12–24 months out; constrained supply supports both.
Investment metrics
- 1% rule
- 1.03% ✓
- Cap rate
- 7.01%
- Cash-on-cash
- 2.55%
- DSCR
- 1.11
- GRM
- 8.1
CMA / ARV
- ARV (median comp)
- $288,252
- List price
- $194,900
- Delta
- -32.39%
- Verdict
- UNDERPRICED
- Comps
- 20 within 1.0 mi
Show comp detail 12 sales within ~0.75 mi
| Address | Dist | Beds/Ba | Sqft | Sold | Price | $/sf | Match |
|---|---|---|---|---|---|---|---|
| 71 Broad St | 0.00mi | 3/2.0 | 1,568 (0%) | 1mo | $194,000 | $124 | 100 |
| 328 Curtis St | 0.17mi | 3/1.5 | 1,629 (+4%) | 3mo | $365,000 | $224 | 82 |
| 30 Ann Pl | 0.13mi | 3/1.0 | 1,480 (-6%) | 8mo | $226,000 | $153 | 74 |
| 264 Curtis St | 0.16mi | 3/1.5 | 1,691 (+8%) | 5mo | $325,000 | $192 | 73 |
| 248 Curtis St | 0.18mi | 4/2.0 (+1) | 1,744 (+11%) | 6mo | $309,900 | $178 | 63 |
| 23 Davis St | 0.30mi | 3/1.0 | 1,431 (-9%) | 7mo | $350,000 | $245 | 61 |
| 34 Meetinghouse Rdg | 0.63mi | 2/1.5 (-1) | 1,564 (-0%) | 4mo | $304,000 | $194 | 60 |
| 64 Victoria Dr | 0.50mi | 3/2.0 | 1,712 (+9%) | 3mo | $308,000 | $180 | 58 |
| 178 Elm St | 0.49mi | 3/1.5 | 1,428 (-9%) | 3mo | $225,000 | $158 | 58 |
| 61 Ridgefield St | 0.49mi | 4/1.5 (+1) | 1,700 (+8%) | 0mo | $385,000 | $226 | 56 |
| 80 Dryden Dr | 0.65mi | 3/2.0 | 1,425 (-9%) | 3mo | $340,000 | $239 | 52 |
| 32 Silver St | 0.46mi | 2/1.0 (-1) | 1,404 (-10%) | 4mo | $300,000 | $214 | 49 |
Match score weights: distance 35% · size 25% · config 20% · recency 20%. Top-matched comps best support the ARV.
Projected returns pro-forma
-3.0% appreciation · 1.65% rent growth · sell at horizon
- IRR
- -13.9%
- Equity multiple
- 0.51×
- Total profit
- $-26,774
- Equity at exit
- $29,060
- IRR
- -7.5%
- Equity multiple
- 0.56×
- Total profit
- $-24,121
- Equity at exit
- $16,851
Cash invested: $54,572 (down + closing). Projections, not guarantees.
Landlord ↔ Tenant lean methodology
- Overall (STATE)
- 27 Tenant-Leaning
- State Connecticut
- 27 Tenant-Leaning · D+7
- County
- — inherits STATE
- City
- — inherits STATE
ZIP-level market 06450
- Rents YoY
- 1.6%
- Active inventory
- 98
- Price-to-rent
- 8.1×
Monthly cashflow live
- Estimated rent
- $2,013 high interval (Pro) →
- Mortgage (P&I)
- −$1,022
- Tax from tax record
- −$370 /mo · $4,446/yr
- Insurance
- −$81
- HOA
- −$0
- Vacancy / Maint / Mgmt
- −$423
- Net cashflow
- $116
Break-even live
UW: 25.0% down · 7.5% · 30yr · 1.5% tax · 5.0% vac · 8.0% maint · 8.0% mgmt
Financing live
Cash to close
- Down payment
- $48,725
- Closing costs
- $5,847
- Reserves months
- —
- Total cash needed
- —
Loan-product check · same deal, 3 products live
Conventional
25% down · 7.5% · 30yr
- Down + closing
- —
- Monthly P&I
- —
- Monthly cashflow
- —
- DSCR
- —
- Eligible?
- —
Personal DTI + credit; lowest rate.
DSCR
20% down · 8.5% · 30yr
- Down + closing
- —
- Monthly P&I
- —
- Monthly cashflow
- —
- DSCR
- —
- Eligible?
- —
No personal income docs; deal must DSCR.
Hard money
10% down · 12.0% · 12mo
- Down + closing
- —
- Monthly P&I
- —
- Monthly cashflow
- —
- DSCR
- —
- Eligible?
- —
Short-term bridge; refi at stabilization.
Rent comps 17 comps
| Address | Beds | Baths | Sqft | Rent | $/sqft | DOM | Units | Dist |
|---|---|---|---|---|---|---|---|---|
| 40 Broad St Meriden, CT | 2.0 | 2.0 | 1150 | $2,110 | $1.83 | 43d | 1 | 0.10mi |
| 14 S Broad St Meriden, CT | 1.0–2.0 | 1.0–1.5 | 947 | $2,132 | $2.25 | 2d | 1 | 0.22mi |
| 88 Olive St Meriden, CT | 3.0 | 1.0 | 1100 | $1,600 | $1.45 | 43d | 1 | 0.63mi |
| 33 Olive St Meriden, CT | 2.0 | 1.0 | 1763 | $1,550 | $0.88 | 43d | 1 | 0.65mi |
| 31 Winthrop St Meriden, CT | 4.0 | 2.0 | 1550 | $2,400 | $1.55 | 3d | 1 | 0.65mi |
| 84 Alcove St #3 Meriden, CT | 2.0 | 1.0 | 1873 | $1,700 | $0.91 | 3d | 1 | 0.71mi |
| 19 Hobart St #1 Meriden, CT | 3.0 | 2.0 | 1105 | $2,200 | $1.99 | 43d | 1 | 0.95mi |
| 65 Twiss St Meriden, CT | 2.0 | 1.0 | 1566 | $1,300 | $0.83 | 14d | 1 | 1.01mi |
| 1 Barristers Ct Unit 2nd Flr Meriden, CT | 3.0 | 1.0 | 1512 | $2,200 | $1.46 | 23d | 1 | 1.03mi |
| 48 Prospect St Unit 2ND Meriden, CT | 2.0 | 1.0 | 2015 | $1,800 | $0.89 | 23d | 1 | 1.16mi |
| 14 Hillside St Meriden, CT | 4.0 | 1.0 | 1175 | $2,000 | $1.70 | 19d | 1 | 1.20mi |
| 130 Bradley Ave Apt 306 Meriden, CT | 2.0 | 1.0 | 1100 | $1,580 | $1.44 | 19d | 1 | 1.27mi |
| 130 Bradley Ave Apt 405 Meriden, CT | 2.0 | 1.0 | 1100 | $1,480 | $1.35 | 23d | 1 | 1.27mi |
| 130 Bradley Ave Meriden, CT | 2.0 | 1.0 | 1100 | $1,500 | $1.36 | 14d | 1 | 1.27mi |
| 116 Springdale Ave Unit 1st Flr Meriden, CT | 2.0 | 1.0 | 1646 | $1,600 | $0.97 | 43d | 1 | 1.34mi |
| 39 N Spring St Unit 2 Meriden, CT | 3.0 | 1.0 | 1650 | $2,400 | $1.45 | 43d | 1 | 1.42mi |
| 184 Gravel St #26 Meriden, CT | 2.0 | 1.5 | 1080 | $2,200 | $2.04 | 23d | 1 | 1.49mi |
Listing history 4 events
-
2026-05-07status Under Contract 94-char remark
Show marketing remark (94 chars)
RT 5 location - Brick dormered 6 room cape with 4 bedrooms 2 baths open to many possibilities,
-
2026-04-01$194,900 Active 94-char remark
Show marketing remark (94 chars)
RT 5 location - Brick dormered 6 room cape with 4 bedrooms 2 baths open to many possibilities,
-
2025-11-02historical
-
2025-08-22$239,000 Active
ⓘ Source: listings_history table (triggers on properties + properties_extension) + one-shot
backfill from property_details.listing_events for pre-trigger history.
Tax reassessment forecast CT · Partial reset (capped growth)
- Current annual tax
- $4,446 · $370/mo
- Projected year-2 tax
- $4,446 · $370/mo
- Expected delta
- $0/yr ($0/mo · 0.0%)
ⓘ Screening estimate from a state-policy table — verify with the county assessor before closing.
Climate risk First Street
- Flood 1/10 Low FEMA zone X (unshaded) · 0% chance over 30 yrs
- Wildfire 1/10 Low
- Heat 5/10 Major 7 d/yr ≥97°F today · 16 d/yr by 30 yrs out
- Wind 6/10 Major 27% chance of damaging wind over 30 yrs
- Air quality 4/10 Moderate 3 unhealthy d/yr today · 5 by 30 yrs out
Nearby sold comps map
Loading sold comps map…
Walkable amenities ~0.75 mi
Loading nearby amenities…
Taxation est. · year 1
- Rental income
- $24,151
- − Mortgage interest
- −$10,917
- − Property taxes
- −$4,446
- − Insurance
- −$974
- − Repairs & maintenance
- −$1,932
- − Management
- −$1,932
- − Depreciation
- −$5,670
- Taxable loss
- −$1,721
- Est. tax savings @ 24.0%
- +$413
- After-tax cash flow
- $1,807/yr
For passive investors: Depreciation is non-cash, so a rental often shows a tax loss while cash-flowing — sheltering income. Rental losses are passive: they offset passive income freely, and up to $25,000/yr can offset ordinary (W-2) income if you actively participate and your MAGI is under $100k (phasing out to $0 by $150k); unused losses carry forward. On sale, claimed depreciation is recaptured at up to 25%, and gains may owe capital-gains tax (a 1031 exchange can defer both). Figures are a year-1 estimate at your 24.0% rate — not tax advice; consult a CPA.
Schools (NCES district)
- District
- Meriden School District
- NCES district ID
- 0902400
- Math proficiency
- 27% ▼ -8.00%
- Reading proficiency
- 41% ▼ -6.00%
- Median HH income
- $53,883
- Composite
- 29.84/100
- National rank
- #6413
- State rank
- #116 of 153 in CT
Livability — Meriden
- Score
- 85/100
- State rank
- #4
- US rank
- #505
Category grades
Schools grade is shown separately in the Schools card above.
Census & demographics
- Census place
- Meriden, CT
- County
- New Haven County · 688,236 people
- City population
- 60,545
- Metro
- New Haven-Milford, CT
- Population (ZIP)
- 35,694
- Household income
- $71,250
- Rent vs Own
- Severe rent burden
- 1516.0
Population outlook (South Central Connecticut County) Hauer SSP2
- By 2040
- 608,362
Race, ethnicity, and origin ACS 2023
- Neighborhood character
- Diverse neighborhood (Simpson 0.60)
- Race & ethnicity
- White 51% Hispanic / Latino 36% Two or more races 16% Black 7% Asian 3%
- Hispanic origin (detail)
- Mexican 6% Puerto Rican 23% Dominican 3%
- Common ancestry
- Romanian 8% Lithuanian 4% Scotch-Irish 2%
- Foreign-born
- 10% · Canada, China, South Korea
- Languages at home
- 70% English-only · Spanish 25% Russian/Polish/Slavic 1% Other Indo-European 1%
Political lean MEDSL · South Central Connecticut
- 2024 margin
- Strong D (+20.1) · D 59.0% · R 38.9% · Other 2.1%
- All cycles
- 2024: D+20.1
Not yet ingested
- Civics
- —
Market trends
- HPI YoY
- ▼ -154.37%
- Current HPI
- 263.7288
- Rent YoY
- ▲ 1.65%
- Metro
- New Haven-Milford, CT
- State GDP YoY
- ▲ 1.06%
- F500 in state
- 38
Industry mix (Fortune 500 HQ in CT)
| Industry | F500 HQs | Revenue |
|---|---|---|
| Industrial Machinery | 4 | $38B |
|
||
| Insurance | 3 | $71B |
|
||
| Financial Services | 2 | $25B |
|
||
| Transportation / Logistics | 2 | $18B |
|
||
| Healthcare | 1 | $247B |
|
||
| Telecommunications | 1 | $55B |
|
||
Price history
-18.5% since first listed4 events — show timeline
- 2026-05-07 Pending — Smart MLS
- 2026-04-01 Listed $194,900 Smart MLS
- 2025-11-02 Listing Removed — Smart MLS
- 2025-08-22 Listed $239,000 Smart MLS
Property tax history
-1.5%/yrLatest (2023): $4,446 · +6.0% YoY. Source: county tax records.
Cash-flow waterfall
monthlySold comps — $/sqft
last 12 mo · ≤1 miLoading sold comps…