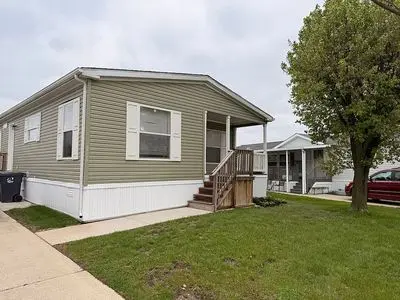
24832 Chinook Ct · Flat Rock, MI
Flood risk No data
- FEMA flood zone
- —
- Chance of flooding over 30 yrs
- —
- Est. flood insurance / yr
- —
Fire risk No data
- Est. fire insurance / yr
- —
Heat risk No data
- Hot days now (above threshold)
- —
- Hot days in 30 yrs
- —
Wind risk No data
- Chance of severe wind over 30 yrs
- —
Air-quality risk No data
- Unhealthy air days now
- —
- Unhealthy air days in 30 yrs
- —
Risk factors via First Street. Map © Google.
Why this score? — see what drove the B- grade
The composite is a weighted blend of 9 inputs, each scored 0–100. Each bar is that input's sub-score; the figure is the points it added to the 100-point composite (weight × sub-score).
- Cash flow +29.7/30.0
- DSCR +10.0/10.0
- 1% rule +8.4/10.0
- ARV discount +7.5/15.0
- Condition / age +3.8/5.0
- Livability +3.7/5.0
- Schools +2.8/10.0
- Rent growth +2.5/5.0
- Appreciation +0.0/10.0
$130,000
🖨 Deal sheet 📄 Offer letter ✓ Due diligence
Listing remarks MLS
Welcome home to this beautifully maintained 2021-built 3-bedroom, 2-bath home offering approximately 1,600 square feet of bright, open-concept living in the heart of Deerfield Estates. From the moment you arrive, the charming covered front porch and lush, tree-shaded lot invite you to stay awhile. Step inside to a spacious, light-filled great room where the living, dining, and kitchen areas flow together effortlessly — perfect for both everyday living and entertaining. The stunning kitchen is the true centerpiece, featuring crisp white shaker cabinetry, stainless steel appliances, a large center island with breakfast-bar seating, and stylish pendant lighting. Elegant crown molding and durable wood-look flooring carry throughout the main living spaces, adding a polished, upscale feel. The generous primary suite offers a private full bath, while two additional bedrooms — each with its own personality and ample closet space, including a walk-in — provide flexible room for family, guests, or a home office. A dedicated indoor laundry room with full-size washer and dryer and convenient side-door access adds everyday ease. Both bathrooms are tastefully finished, one with a relaxing tub/shower combo and the other with a sleek glass-enclosed walk-in shower. Outside, you'll appreciate the matching detached storage shed, well-kept landscaping, and a peaceful, quiet setting. As a resident of Deerfield Estates, you'll enjoy fantastic community amenities including a clubhouse, swimming pool, and scenic walking areas throughout the neighborhood. Newer construction, modern finishes, and an unbeatable community — this one truly has it all. Schedule your private showing today!
Key facts
- Covered front porch
- Stunning kitchen
- Tree shaded lot
Tags
Property features AI
Finance
- Other: Located in the city of Flat Rock
- HOA & community: HOA covers grounds maintenance, snow removal, trash removal and water; Community amenities include a clubhouse and sidewalks
Exterior
- Parking: Driveway access (street access described in directions)
- Utilities: Public water at street; Public sewer at street; Natural gas
- Home design: Manufactured home located in a MH park (Deerfield Estates, Lot 541); One-story; Built in 2021; Frontage: 24
- Construction: Vinyl siding; Crawl foundation
- Exterior features: Porch; Paved street frontage
Interior
- Kitchen: 12 x 14 kitchen with vinyl flooring; Microwave; Dishwasher
- Bedrooms: Bedroom 1 (Entry): 12 x 13, carpet; Bedroom 2 (Entry): 11 x 11, carpet; Bedroom 3 (Entry): 12 x 12, carpet
- Flooring: Carpet in living room and bedrooms; Vinyl in kitchen, dining room, bathrooms and laundry
- Bathrooms: 2 full bathrooms; Bathrooms have vinyl flooring
- Heating & cooling: Forced air heating; Natural gas fuel; Gas water heater
- Interior features: Cable/Internet available; 9 total rooms
- Laundry & utility: Laundry room (Entry): 14 x 6 with vinyl flooring; Washer; Dryer
Neighborhood map
What this means for you Summary
Snapshot
- This is a 3-bed/2.0-bath manufactured listed at $130k. Condition is rated good.
Deal economics
- At list price, monthly cash flow is $475 ($6k/yr) — positive.
- The deal already cash-flows at list — no discount required.
- Meets the 1% rule at list price ($2k rent vs $130k).
- Cap rate 10.7% vs local median 2.7% in Flat Rock — top-decile yield for the area; either an underpriced asset or a hidden risk that comps aren't pricing in. Stress-test before assuming the spread holds.
Location & tenants
- Location reads 74/100 on livability (#177 in MI, #4,594 nationally) — a middle-class / working-renter tenant base. Strengths: cost of living A+, housing A+, health & safety A+; Watch: amenities F, commute F.
- Flat Rock Community Schools (suburban): math 26% / reading 37% proficiency, ranked #326 of 540 in MI (top 60%) — families likely to look elsewhere, expect single-tenant / working-renter base with shorter leases.
- Market conditions: 82 active listings in the ZIP; 1 comparable units currently listed for rent nearby; solid renter incomes; 2,639 units permitted in Wayne County in 2024 (1,216 in 5+ unit buildings).
Forward outlook
- Local home prices are declining (-3.0%/yr); year-one equity from $899 of loan paydown is wiped out by about $4k of value loss. Plan a longer hold.
- Wayne County population projected at -17% by 2050 — secular population decline; favor cash flow + early exit over multi-decade hold.
- At projected returns (-3.0% appreciation + 3.0% rent growth), your $36k cash investment doubles in ~8 years — after that, you're playing with house money.
Negotiation context
- Only 6 days on market — expect competitive offers; lowballing is unlikely to land.
- 2 sale attempts with the ask held roughly flat each time — persistent listings suggest the price (not the market) is what's stuck; bring a comps-based counter.
Questions for the listing agent
- Is there a deadline driving the sale (1031 exchange, divorce, estate, relocation)? That informs how much negotiation room exists.
- What's the average days-on-market for RENTAL listings here right now (not sales)? A rising rental-DOM trend means longer vacancies and softer asking-rent achievability than the comps imply.
- What's the recent tenant-quality profile in this submarket — average credit score on applications, eviction rate, late-payment / NSF rate, and stable-employment percentage? A property-management company in the area should have these aggregated.
- How much new for-sale + rental construction is in the pipeline within 1–3 miles? Heavy new supply typically softens prices + rents 12–24 months out; constrained supply supports both.
Investment metrics
- 1% rule
- 1.34% ✓
- Cap rate
- 10.68%
- Cash-on-cash
- 15.66%
- DSCR
- 1.70
- GRM
- 6.2
CMA / ARV
- ARV (median comp)
- $392,475
- List price
- $130,000
- Delta
- -66.88%
- Verdict
- UNDERPRICED
- Comps
- 3 within 1.0 mi
Projected returns pro-forma
-3.0% appreciation · 3.0% rent growth · sell at horizon
- IRR
- 6.5%
- Equity multiple
- 1.25×
- Total profit
- $9,215
- Equity at exit
- $19,383
- IRR
- 15.9%
- Equity multiple
- 2.29×
- Total profit
- $47,088
- Equity at exit
- $11,240
Cash invested: $36,400 (down + closing). Projections, not guarantees.
Landlord ↔ Tenant lean methodology
- Overall (STATE)
- 62 Landlord-Friendly
- State Michigan
- 62 Landlord-Friendly · EVEN
- County
- — inherits STATE
- City
- — inherits STATE
ZIP-level market 48134
- Active inventory
- 82
- Price-to-rent
- 6.2×
Monthly cashflow live
- Estimated rent
- $1,739 medium interval (Pro) →
- Mortgage (P&I)
- −$682
- Tax est. 1.5%
- −$162 /mo · $1,950/yr
- Insurance
- −$54
- HOA
- −$0
- Vacancy / Maint / Mgmt
- −$365
- Net cashflow
- $475
Break-even live
UW: 25.0% down · 7.5% · 30yr · 1.5% tax · 5.0% vac · 8.0% maint · 8.0% mgmt
Financing live
Cash to close
- Down payment
- $32,500
- Closing costs
- $3,900
- Reserves months
- —
- Total cash needed
- —
Loan-product check · same deal, 3 products live
Conventional
25% down · 7.5% · 30yr
- Down + closing
- —
- Monthly P&I
- —
- Monthly cashflow
- —
- DSCR
- —
- Eligible?
- —
Personal DTI + credit; lowest rate.
DSCR
20% down · 8.5% · 30yr
- Down + closing
- —
- Monthly P&I
- —
- Monthly cashflow
- —
- DSCR
- —
- Eligible?
- —
No personal income docs; deal must DSCR.
Hard money
10% down · 12.0% · 12mo
- Down + closing
- —
- Monthly P&I
- —
- Monthly cashflow
- —
- DSCR
- —
- Eligible?
- —
Short-term bridge; refi at stabilization.
Rent comps 1 comps
| Address | Beds | Baths | Sqft | Rent | $/sqft | DOM | Units | Dist |
|---|---|---|---|---|---|---|---|---|
| 23501 Van Horn Rd Woodhaven, MI | 4.0 | 2.0 | 1568 | $1,599 | $1.02 | 1d | 1 | 0.96mi |
Listing history 15 events
-
2026-06-18days on market $130,000 Active 6 DOM
-
2026-06-17days on market $130,000 Active 5 DOM
-
2026-06-16days on market $130,000 Active 4 DOM
-
2026-06-15days on market $130,000 Active 3 DOM
-
2026-06-13remarks 699-char remark
-
2026-06-13days on market $130,000 Active 1 DOM
-
2026-06-09days on market $130,000 Active 28 DOM
-
2026-06-08days on market $130,000 Active 27 DOM
-
2026-06-07days on market $130,000 Active 26 DOM
-
2026-06-04days on market $130,000 Active 23 DOM
-
2026-06-03days on market $130,000 Active 22 DOM
-
2026-06-02days on market $130,000 Active 21 DOM
-
2026-06-01days on market $130,000 Active 20 DOM
-
2026-05-31days on market $130,000 Active 19 DOM
-
2026-05-12$130,000 Active 687-char remark
ⓘ Source: listings_history table (triggers on properties + properties_extension) + one-shot
backfill from property_details.listing_events for pre-trigger history.
Nearby sold comps map
Loading sold comps map…
Walkable amenities ~0.75 mi
Loading nearby amenities…
Taxation est. · year 1
- Rental income
- $20,862
- − Mortgage interest
- −$7,282
- − Property taxes
- −$1,950
- − Insurance
- −$650
- − Repairs & maintenance
- −$1,669
- − Management
- −$1,669
- − Depreciation
- −$3,782
- Taxable income
- $3,860
- Est. tax owed @ 24.0%
- −$926
- After-tax cash flow
- $4,774/yr
For passive investors: Depreciation is non-cash, so a rental often shows a tax loss while cash-flowing — sheltering income. Rental losses are passive: they offset passive income freely, and up to $25,000/yr can offset ordinary (W-2) income if you actively participate and your MAGI is under $100k (phasing out to $0 by $150k); unused losses carry forward. On sale, claimed depreciation is recaptured at up to 25%, and gains may owe capital-gains tax (a 1031 exchange can defer both). Figures are a year-1 estimate at your 24.0% rate — not tax advice; consult a CPA.
Condition & rehab AI · 2 photos
This 2021-built 3-bedroom, 2-bath home in Deerfield Estates is in good condition with a good roof, siding, and landscaping. A fresh coat of paint on the exterior siding and some landscaping improvements would significantly enhance its curb appeal and value.
Value-add opportunities
- Both Paint exterior siding — Enhances curb appeal and value
- Both Landscaping improvements — Enhances curb appeal and value
Renovation cost estimate screening
Value-add ROI direction
- Both Paint exterior siding — Enhances curb appeal and value ↑
- Both Landscaping improvements — Enhances curb appeal and value ↑
ⓘ Cost ranges are severity-bucket heuristics (US national rule-of-thumb). Get contractor quotes + a written scope before underwriting a rehab budget.
Schools (NCES district)
- District
- Flat Rock Community Schools
- NCES district ID
- 2607080
- Math proficiency
- 26% ▼ -7.00%
- Reading proficiency
- 37% ▼ -2.00%
- Median HH income
- $55,015
- Composite
- 27.89/100
- National rank
- #6871
- State rank
- #326 of 540 in MI
Livability — Flat Rock
- Score
- 74/100
- State rank
- #177
- US rank
- #4594
Category grades
Schools grade is shown separately in the Schools card above.
Census & demographics
- Census place
- Flat Rock, MI
- County
- Wayne County · 1,562,939 people
- City population
- 23,935
- Metro
- Detroit-Warren-Dearborn, MI
- Population (ZIP)
- 23,935
- Household income
- $92,076
- Rent vs Own
- Severe rent burden
- 228.0
Population outlook (Wayne County) Hauer SSP2
- Today (2025)
- 1,675,273 people
- By 2030
- 1,620,300 · -3.3%
- By 2040
- 1,502,341 · -10.3%
- By 2050
- 1,384,039 · -17.4%
- By 2075
- 1,124,592 · -32.9%
- By 2100
- 881,193 · -47.4%
Race, ethnicity, and origin ACS 2023
- Neighborhood character
- Predominantly White (77%)
- Race & ethnicity
- White 77% Two or more races 10% Hispanic / Latino 9% Black 8%
- Hispanic origin (detail)
- Mexican 6%
- Common ancestry
- Romanian 13% Lithuanian 5% Portuguese 3%
- Foreign-born
- 3% · Canada
- Languages at home
- 95% English-only · Spanish 3% Other Indo-European 1%
Political lean MEDSL · Wayne
- 2024 margin
- Strong D (+29.0) · D 62.7% · R 33.7% · Other 3.6%
- 2008→2024 swing
- -20.5pp toward R · 2008: 49.5pp · 2024: 29.0pp
- All cycles
- 2024: D+29.0 2020: D+38.1 2016: D+37.3 2012: D+46.9 2008: D+49.5
Not yet ingested
- Civics
- —
Market trends
- HPI YoY
- ▼ -223.42%
- Current HPI
- 232.7533
- Rent YoY
- —
- Metro
- Detroit-Warren-Dearborn, MI
- State GDP YoY
- ▲ 1.37%
- F500 in state
- 28
Industry mix (Fortune 500 HQ in MI)
| Industry | F500 HQs | Revenue |
|---|---|---|
| Automotive Parts | 3 | $48B |
|
||
| Automotive | 2 | $372B |
|
||
| Chemicals | 1 | $45B |
|
||
| Automotive Retail | 1 | $29B |
|
||
| Healthcare / Medical Devices | 1 | $23B |
|
||
| Automotive Technology | 1 | $20B |
|
||
Price history
+0.0% since first listed2 events — show timeline
- 2026-06-12 Listed $130,000 REALCOMP
- 2026-06-12 Listed $130,000 MiRealSource-MiMLS
Cash-flow waterfall
monthlySold comps — $/sqft
last 12 mo · ≤1 miLoading sold comps…