7272 New York 81 · East Durham, NY
Flood risk 9/10 · Severe
- FEMA flood zone
- X (unshaded)
- Chance of flooding over 30 yrs
- 0.99%
- Est. flood insurance / yr
- $507 – $1,088
Fire risk 2/10 · Minimal
- Est. fire insurance / yr
- $691 – $1,283
Heat risk 3/10 · Minor
- Hot days now (above 94°F)
- 7 days/yr
- Hot days in 30 yrs
- 17 days/yr
Wind risk 3/10 · Minor
- Chance of severe wind over 30 yrs
- 5.0%
Air-quality risk 2/10 · Minimal
- Unhealthy air days now
- 0 days/yr
- Unhealthy air days in 30 yrs
- 1 days/yr
Risk factors via First Street. Map © Google.
Why this score? — see what drove the C- grade
The composite is a weighted blend of 9 inputs, each scored 0–100. Each bar is that input's sub-score; the figure is the points it added to the 100-point composite (weight × sub-score).
- Cash flow +23.3/30.0
- DSCR +7.5/10.0
- Appreciation +6.5/10.0
- 1% rule +5.7/10.0
- Schools +3.8/10.0
- Rent growth +2.5/5.0
- Livability +2.5/5.0
- Condition / age +2.5/5.0
- ARV discount +0.0/15.0
$159,000
🖨 Deal sheet 📄 Offer letter ✓ Due diligence
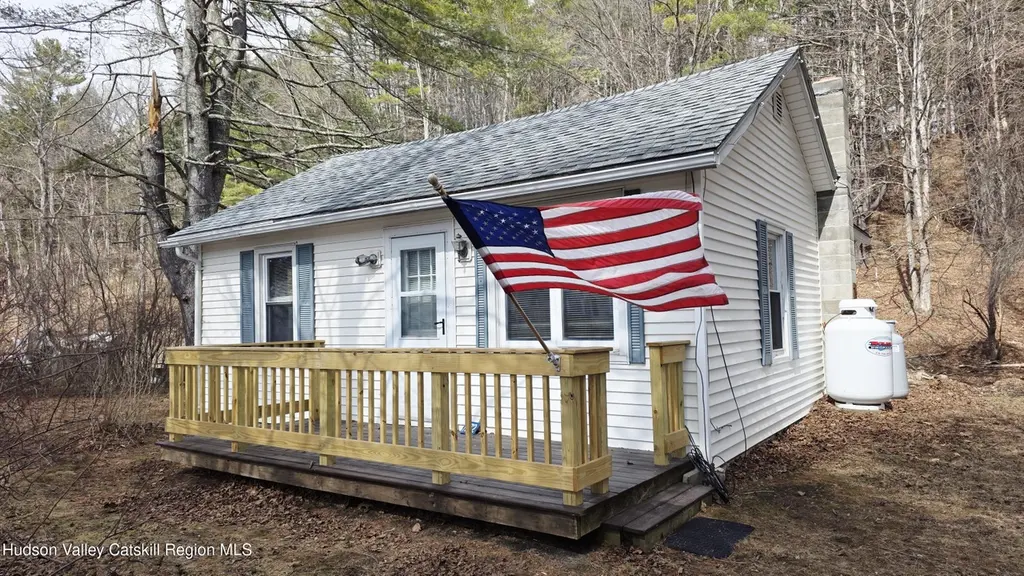
Listing remarks MLS
Cozy cottage featuring a spacious living room with wood flooring, a kitchen, dining room, and one large bedroom and bathroom, all set on a generous 0.41‑acre lot. This property offers many updates including; deck, electric hookup, septic system, windows, roof, and a new hot water tank. Previously used as a summer residence, it's ideally located close to shopping, restaurants, festivals, Zoom Flume, Ski Windham and Hunter Mountain, hiking, and more.
Key facts
- Newer roof
- New deck
- Spacious living room
Tags
Neighborhood map
What this means for you Summary
Snapshot
- This is a 1-bed/1.0-bath single-family listed at $159k.
Deal economics
- At list price, monthly cash flow is $223 ($3k/yr) — positive.
- The deal already cash-flows at list — no discount required.
- Meets the 1% rule at list price ($2k rent vs $159k).
- Recommended offer: $140k (12.0% below list) — sets the bar for market timing.
- Cap rate 8.5% vs local median 2.9% in East Durham — top-decile yield for the area; either an underpriced asset or a hidden risk that comps aren't pricing in. Stress-test before assuming the spread holds.
Location & tenants
- Location reads: area grade C — affects rentability + tenant quality, not the cash-flow math above.
- Cairo-Durham Central School District (rural): math 41% / reading 48% proficiency, ranked #470 of 590 in NY (top 80%) — families likely to look elsewhere, expect single-tenant / working-renter base with shorter leases.
- Market conditions: 21 active listings in the ZIP; 97 units permitted in Greene County in 2024 (0 in 5+ unit buildings).
Forward outlook
- In year one you build about $6k of equity ($1k loan paydown + $5k appreciation (3.1% local appreciation)).
- Greene County population projected at -22% by 2050 — secular population decline; favor cash flow + early exit over multi-decade hold.
- At projected returns (3.1% appreciation + 3.0% rent growth), your $45k cash investment doubles in ~5 years — after that, you're playing with house money.
- By year 6, paydown + projected appreciation supports a ~$32k cash-out refi (75% LTV) — recoverable capital for the next deal without selling this one.
Negotiation context
- It's been on market 131 days — a 12% lower offer ($140k) is reasonable based on typical stale-listing flexibility.
- 5 sale attempts with the ask held roughly flat each time — persistent listings suggest the price (not the market) is what's stuck; bring a comps-based counter.
- Current owner paid $37k; list at $159k implies a 330% gain — meaningful room to come down on a strong offer.
Risks & watch-outs
- Watch-outs: flood insurance adds $66/mo; built in 1955 — expect roof / HVAC / electrical / plumbing capex.
- Climate carrying-cost: severe flood risk — expect insurance premiums to compound above CPI over the hold.
Questions for the listing agent
- It's been on market 131 days. Have you received any prior offers? Is the seller open to a 12% concession, seller financing, or rate buy-down credit?
- Built in 1955 — when were the roof, HVAC, electrical panel, plumbing, and water heater last replaced?
- What's the actual annual flood-insurance premium (NFIP or private), and is the property in a SFHA with mandatory coverage?
- Why hasn't it sold? Are there any deal-killer items the seller is aware of (foundation, flood, title, zoning, code violations)?
- Is there a deadline driving the sale (1031 exchange, divorce, estate, relocation)? That informs how much negotiation room exists.
- What's the average days-on-market for RENTAL listings here right now (not sales)? A rising rental-DOM trend means longer vacancies and softer asking-rent achievability than the comps imply.
- What's the recent tenant-quality profile in this submarket — average credit score on applications, eviction rate, late-payment / NSF rate, and stable-employment percentage? A property-management company in the area should have these aggregated.
- How much new for-sale + rental construction is in the pipeline within 1–3 miles? Heavy new supply typically softens prices + rents 12–24 months out; constrained supply supports both.
Investment metrics
- 1% rule
- 1.07% ✓
- Cap rate
- 8.48%
- Cash-on-cash
- 7.81%
- DSCR
- 1.35
- GRM
- 7.8
CMA / ARV
- ARV (median comp)
- $117,453
- List price
- $159,000
- Delta
- 35.37%
- Verdict
- OVERPRICED
- Comps
- 3 within 2.0 mi
Projected returns pro-forma
3.07% appreciation · 3.0% rent growth · sell at horizon
- IRR
- 13.3%
- Equity multiple
- 1.76×
- Total profit
- $34,015
- Equity at exit
- $72,137
- IRR
- 15.2%
- Equity multiple
- 3.26×
- Total profit
- $100,489
- Equity at exit
- $111,674
Cash invested: $44,520 (down + closing). Projections, not guarantees.
Landlord ↔ Tenant lean methodology
- Overall (STATE)
- 15 Strongly Tenant-Friendly
- State New York
- 15 Strongly Tenant-Friendly · D+10
- County
- — inherits STATE
- City
- — inherits STATE
ZIP-level market 12423
- Home prices YoY
- 0.8%
- Active inventory
- 21
- Price-to-rent
- 7.8×
Monthly cashflow live
- Estimated rent
- $1,696 medium interval (Pro) →
- Mortgage (P&I)
- −$834
- Tax from tax record
- −$150 /mo · $1,801/yr
- Insurance
- −$66
- Flood insurance flood zone
- −$66 /mo · $798/yr
- HOA
- −$0
- Vacancy / Maint / Mgmt
- −$356
- Net cashflow
- $223
Break-even live
UW: 25.0% down · 7.5% · 30yr · 1.5% tax · 5.0% vac · 8.0% maint · 8.0% mgmt
Financing live
Cash to close
- Down payment
- $39,750
- Closing costs
- $4,770
- Reserves months
- —
- Total cash needed
- —
Loan-product check · same deal, 3 products live
Conventional
25% down · 7.5% · 30yr
- Down + closing
- —
- Monthly P&I
- —
- Monthly cashflow
- —
- DSCR
- —
- Eligible?
- —
Personal DTI + credit; lowest rate.
DSCR
20% down · 8.5% · 30yr
- Down + closing
- —
- Monthly P&I
- —
- Monthly cashflow
- —
- DSCR
- —
- Eligible?
- —
No personal income docs; deal must DSCR.
Hard money
10% down · 12.0% · 12mo
- Down + closing
- —
- Monthly P&I
- —
- Monthly cashflow
- —
- DSCR
- —
- Eligible?
- —
Short-term bridge; refi at stabilization.
Listing history 28 events
-
2026-06-18days on market $159,000 Active 131 DOM
-
2026-06-17days on market $159,000 Active 130 DOM
-
2026-06-16days on market $159,000 Active 129 DOM
-
2026-06-15days on market $159,000 Active 128 DOM
-
2026-06-14days on market $159,000 Active 126 DOM
-
2026-06-10days on market $159,000 Active 123 DOM
-
2026-06-09days on market $159,000 Active 122 DOM
-
2026-06-08days on market $159,000 Active 121 DOM
-
2026-06-07days on market $159,000 Active 120 DOM
-
2026-06-05days on market $159,000 Active 117 DOM
-
2026-06-03days on market $159,000 Active 116 DOM
-
2026-06-02days on market $159,000 Active 115 DOM
-
2026-06-01days on market $159,000 Active 114 DOM
-
2026-05-31days on market $159,000 Active 113 DOM
-
2026-05-31days on market $159,000 Active 112 DOM
-
2026-02-07$159,000 Active 452-char remark
Show marketing remark (452 chars)
Cozy cottage featuring a spacious living room with wood flooring, a kitchen, dining room, and one large bedroom and bathroom, all set on a generous 0.41‑acre lot. This property offers many updates including; deck, electric hookup, septic system, windows, roof, and a new hot water tank. Previously used as a summer residence, it's ideally located close to shopping, restaurants, festivals, Zoom Flume, Ski Windham and Hunter Mountain, hiking, and more.
-
2025-11-17status Active
-
2025-11-17status Active
-
2025-09-17status Pending
-
2025-09-17status Pending
-
2025-09-17historical
-
2025-08-20price $160,000
-
2025-08-20price $160,000
-
2025-08-05price $170,000
-
2025-08-05price $170,000
-
2025-06-23$180,000 Active
-
2025-06-22$180,000 Active
-
1998-12-30soldstatus $37,000
ⓘ Source: listings_history table (triggers on properties + properties_extension) + one-shot
backfill from property_details.listing_events for pre-trigger history.
Tax reassessment forecast NY · Partial reset (capped growth)
- Current annual tax
- $1,801 · $150/mo
- Projected year-2 tax
- $2,244 · $187/mo
- Expected delta
- +$443/yr (+$37/mo · 24.6%)
ⓘ Screening estimate from a state-policy table — verify with the county assessor before closing.
Climate risk First Street
- Flood 9/10 Extreme FEMA zone X (unshaded) · 99% chance over 30 yrs
- Wildfire 2/10 Low
- Heat 3/10 Moderate 7 d/yr ≥94°F today · 17 d/yr by 30 yrs out
- Wind 3/10 Moderate 5% chance of damaging wind over 30 yrs
- Air quality 2/10 Low 0 unhealthy d/yr today · 1 by 30 yrs out
Nearby sold comps map
Loading sold comps map…
Walkable amenities ~0.75 mi
Loading nearby amenities…
Taxation est. · year 1
- Rental income
- $20,353
- − Mortgage interest
- −$8,906
- − Property taxes
- −$1,801
- − Insurance
- −$1,592
- − Repairs & maintenance
- −$1,628
- − Management
- −$1,628
- − Depreciation
- −$4,625
- Taxable income
- $171
- Est. tax owed @ 24.0%
- −$41
- After-tax cash flow
- $2,638/yr
For passive investors: Depreciation is non-cash, so a rental often shows a tax loss while cash-flowing — sheltering income. Rental losses are passive: they offset passive income freely, and up to $25,000/yr can offset ordinary (W-2) income if you actively participate and your MAGI is under $100k (phasing out to $0 by $150k); unused losses carry forward. On sale, claimed depreciation is recaptured at up to 25%, and gains may owe capital-gains tax (a 1031 exchange can defer both). Figures are a year-1 estimate at your 24.0% rate — not tax advice; consult a CPA.
Schools (NCES district)
- District
- Cairo-Durham Central School District
- NCES district ID
- 3606160
- Math proficiency
- 41% ▼ -3.00%
- Reading proficiency
- 48% ▲ 8.00%
- Median HH income
- $46,192
- Composite
- 37.84/100
- National rank
- #4330
- State rank
- #470 of 590 in NY
Livability — East Durham
No livability data for this city. (Only ~50 U.S. cities are tracked.)
Census & demographics
- City population
- 1,033
- Population (ZIP)
- 1,033
Population outlook (Greene County) Hauer SSP2
- Today (2025)
- 44,963 people
- By 2030
- 43,126 · -4.1%
- By 2040
- 38,756 · -13.8%
- By 2050
- 34,913 · -22.4%
- By 2075
- 28,156 · -37.4%
- By 2100
- 22,296 · -50.4%
Race, ethnicity, and origin ACS 2023
- Neighborhood character
- Predominantly White (68%)
- Race & ethnicity
- White 68% Two or more races 32% Hispanic / Latino 13%
- Hispanic origin (detail)
- Puerto Rican 5% Cuban 1%
- Common ancestry
- Iranian 12% Italian 3% Slovak 3%
- Foreign-born
- 9% · Canada
- Languages at home
- 93% English-only · Spanish 5% Other Indo-European 2% French/Haitian/Cajun 1%
Political lean MEDSL · Greene
- 2024 margin
- R (+17.0) · D 41.5% · R 58.5%
- 2008→2024 swing
- -7.1pp toward R · 2008: -9.9pp · 2024: -17.0pp
- All cycles
- 2024: R+17.0 2020: R+15.6 2016: R+27.4 2012: R+11.1 2008: R+9.9
Not yet ingested
- Civics
- —
Market trends
- HPI YoY
- ▲ 3.07%
- Current HPI
- 412.075
- Rent YoY
- —
- Metro
- —
- State GDP YoY
- ▲ 2.60%
- F500 in state
- 92
Industry mix (Fortune 500 HQ in NY)
| Industry | F500 HQs | Revenue |
|---|---|---|
| Financial Services | 10 | $950B |
|
||
| Consumer Goods | 9 | $162B |
|
||
| Insurance | 4 | $225B |
|
||
| Telecommunications | 2 | $144B |
|
||
| Pharmaceuticals | 2 | $112B |
|
||
| Media / Entertainment | 2 | $69B |
|
||
Price history
+329.7% since first listed13 events — show timeline
- 2026-02-07 Listed $159,000 HVCRMLS
- 2025-11-17 Relisted — HVCRMLS
- 2025-11-17 Relisted — Global MLS
- 2025-09-17 Pending — HVCRMLS
- 2025-09-17 Pending — Global MLS
- 2025-09-17 Listing Removed — Global MLS
- 2025-08-20 Price Changed $160,000 HVCRMLS
- 2025-08-20 Price Changed $160,000 Global MLS
- 2025-08-05 Price Changed $170,000 Global MLS
- 2025-08-05 Price Changed $170,000 HVCRMLS
- 2025-06-23 Listed $180,000 Global MLS
- 2025-06-22 Listed $180,000 HVCRMLS
- 1998-12-30 Sold (Public Records) $37,000 Public Records
Property tax history
+0.8%/yrLatest (2025): $1,801 · -5.7% YoY. Source: county tax records.
Cash-flow waterfall
monthlySold comps — $/sqft
last 12 mo · ≤1 miLoading sold comps…