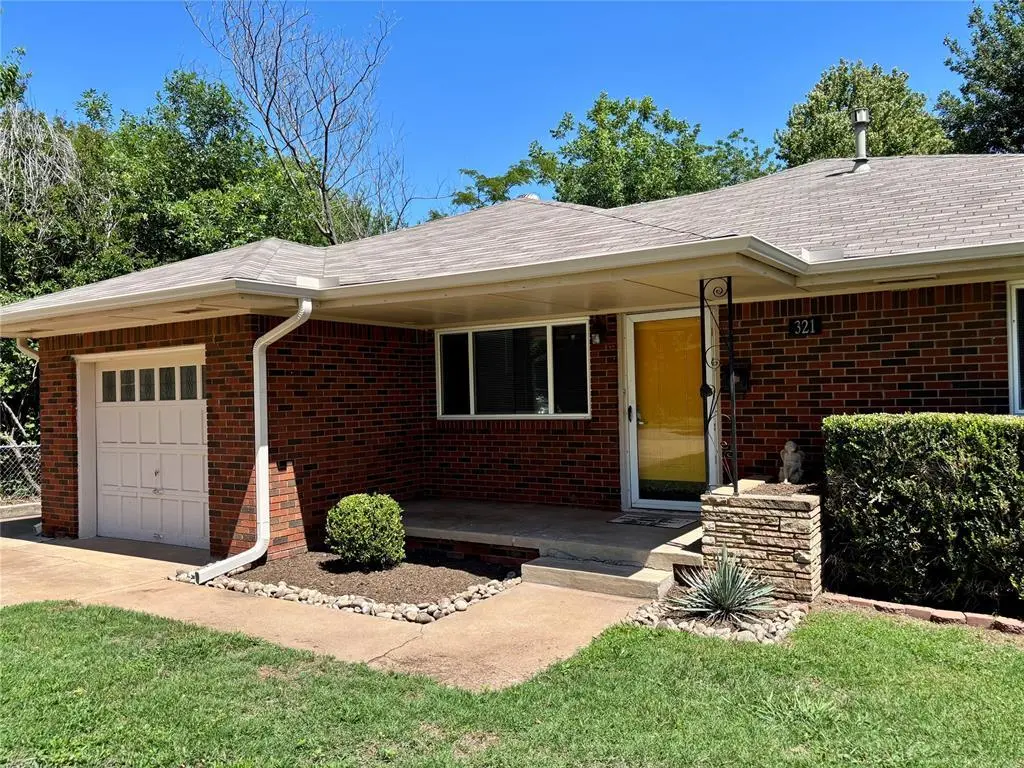
321 E Clegern Ave · Edmond, OK
Flood risk 1/10 · Minimal
- FEMA flood zone
- X (unshaded)
- Chance of flooding over 30 yrs
- 0.0%
- Est. flood insurance / yr
- $507 – $1,088
Fire risk 1/10 · Minimal
- Est. fire insurance / yr
- $2,463 – $4,575
Heat risk 6/10 · Moderate
- Hot days now (above 108°F)
- 7 days/yr
- Hot days in 30 yrs
- 19 days/yr
Wind risk 2/10 · Minimal
- Chance of severe wind over 30 yrs
- 3.0%
Air-quality risk 2/10 · Minimal
- Unhealthy air days now
- 2 days/yr
- Unhealthy air days in 30 yrs
- 2 days/yr
Risk factors via First Street. Map © Google.
Why this score? — see what drove the D+ grade
The composite is a weighted blend of 9 inputs, each scored 0–100. Each bar is that input's sub-score; the figure is the points it added to the 100-point composite (weight × sub-score).
- ARV discount +13.8/15.0
- Cash flow +12.5/30.0
- Livability +3.9/5.0
- DSCR +3.7/10.0
- 1% rule +3.6/10.0
- Schools +3.6/10.0
- Rent growth +3.1/5.0
- Condition / age +2.8/5.0
- Appreciation +0.0/10.0
$225,000
🖨 Deal sheet 📄 Offer letter ✓ Due diligence
Listing remarks
What an incredible opportunity! Tucked next to Gossett Park and University Drive just west of the University of Central Oklahoma. Original hardwood floors. Large Family Rooms. One in front and an even larger one in back. Your new Kitchen has loads of storage. Pantry Cabinets. Gas Cooktop and Oven. Dishwasher, Refrigerator and Microwave. Spacious Kitchen Dining. 3 Nice Sized Bedrooms and 2 Full Baths. New west side exterior door and jam to garage. New Rain Gutters and Downspouts. Roof examined and fully insurable. Garage Utility washer and dryer stay. Large Garage Storage Closet with Shelves. Covered front Porch. A Firepit and Grotto frame a really nice sized and fenced backyard. The home h
Key facts
- Gas cooktop
- Pantry cabinets
- Large family rooms
Tags
Property features AI
Finance
- Other: Homestead exempt; Legal addition: Normal Heights of Edmond
- Financial info: Cash, conventional, or FHA/VA financing accepted; Assumable loans: No; Loan qualification: Yes
- HOA & community: No mandatory association dues
Exterior
- Parking: Concrete parking; 1-car garage
- Utilities: Cable available; Electricity available; Natural gas available; Public utilities
- Home design: Single family residence; One level; South-facing; Residential property
- Construction: Brick and frame construction; Composition roof; Double-pane vinyl frame windows; Conventional foundation; Existing property
- Exterior features: Covered porch; Open patio; Fire pit; Outbuildings; Rain gutters; Chain link fencing; Corner lot; Campus area
Interior
- Kitchen: Free-standing range (gas); Free-standing electric oven; Eating space; Pantry
- Bedrooms: 3 bedrooms
- Flooring: Tile; Vinyl; Wood
- Bathrooms: 2 full bathrooms (one with tub and shower, one with shower)
- Interior features: Two living areas; Garage utility; No fireplace; Ceiling fan in living room; L-shaped eating space and pantry in kitchen
- Laundry & utility: Garage utility area
Neighborhood map
What this means for you Summary
Snapshot
- This is a 3-bed/2.0-bath single-family listed at $225k. Condition is rated average.
Deal economics
- At list price, monthly cash flow is $-34 ($-403/yr) — negative.
- To cash-flow at today's rent, offer at most $220k (2.2% below list).
- To meet the 1% rule (rent ≥ 1% of price), the offer needs to be $193k (14.4% below list).
- Recommended offer: $193k (14.4% below list) — sets the bar for 1% rule.
- Cap rate 6.1% vs local median 3.4% in Edmond — top-decile yield for the area; either an underpriced asset or a hidden risk that comps aren't pricing in. Stress-test before assuming the spread holds.
Location & tenants
- Location reads 78/100 on livability (#6 in OK, #2,383 nationally) — a middle-class / working-renter tenant base. Strengths: employment A+, housing A+, crime A-; Watch: health & safety C-, commute F.
- Edmond (suburban): math 38% / reading 40% proficiency, ranked #11 of 270 in OK (top 4%) — families likely to look elsewhere, expect single-tenant / working-renter base with shorter leases.
- Zoned schools: Northern Hills Es (math 39% / reading 36%, grade F, #127 of 845 statewide, top 15%, 775 students, 0% FRL); North Hs (math 47% / reading 57%, grade D+, #1 of 447 statewide, top 0%, 2,555 students, 0% FRL) — zoned schools average 0% FRL vs 22% district-wide (22 pts lower); this property's tenant base skews higher-income than the district average.
- Market conditions: Rents rising (+2.5%/yr); 763 active listings in the ZIP; 40 comparable units currently listed for rent nearby; rentals at typical pace (median 15d on market — plan ~3-4 weeks tenant-placement turnaround); solid renter incomes; 5,365 units permitted in Oklahoma County in 2024 (569 in 5+ unit buildings).
Forward outlook
- Local home prices are declining (-3.0%/yr); year-one equity from $2k of loan paydown is wiped out by about $7k of value loss. Plan a longer hold.
- Oklahoma County population projected at +41% by 2050 — long-run rental-demand tailwind backs the buy-and-hold thesis.
Negotiation context
- Only 3 days on market — expect competitive offers; lowballing is unlikely to land.
Risks & watch-outs
- Watch-outs: built in 1956 — expect roof / HVAC / electrical / plumbing capex.
- Climate carrying-cost: extreme-heat days projected 7→19/yr by 2055 (HVAC capex compounding) — expect insurance premiums to compound above CPI over the hold.
Questions for the listing agent
- What do current leases actually rent for vs. the listed asking? Can we see a recent rent roll and the last 12 months of T-12 income?
- Built in 1956 — when were the roof, HVAC, electrical panel, plumbing, and water heater last replaced?
- Is there a deadline driving the sale (1031 exchange, divorce, estate, relocation)? That informs how much negotiation room exists.
- Schools are A-rated — typically a magnet for longer-tenancy family renters. What's the average tenant stay here, and is there a school-zone premium baked into asking?
- The area grade is low — what's the realistic commute time and amenity access for the typical tenant pool here? Any planned neighborhood developments (good or bad) we should know about?
- What's the average days-on-market for RENTAL listings here right now (not sales)? A rising rental-DOM trend means longer vacancies and softer asking-rent achievability than the comps imply.
- What's the recent tenant-quality profile in this submarket — average credit score on applications, eviction rate, late-payment / NSF rate, and stable-employment percentage? A property-management company in the area should have these aggregated.
- How much new for-sale + rental construction is in the pipeline within 1–3 miles? Heavy new supply typically softens prices + rents 12–24 months out; constrained supply supports both.
Investment metrics
- 1% rule
- 0.86% ✗
- Cap rate
- 6.11%
- Cash-on-cash
- -0.64%
- DSCR
- 0.97
- GRM
- 9.7
CMA / ARV
- ARV (on-the-fly)
- $261,422
- Comps found
- 8
Show comp detail 8 sales within ~0.75 mi
| Address | Dist | Beds/Ba | Sqft | Sold | Price | $/sf | Match |
|---|---|---|---|---|---|---|---|
| 1117 Washington St | 0.28mi | 3/3.0 | 1,700 (-8%) | 10mo | $238,000 | $140 | 62 |
| 31 Shirley Ln | 0.39mi | 4/4.0 (+1) | 1,797 (-2%) | 10mo | $230,000 | $128 | 56 |
| 1312 Every Dr | 0.40mi | 2/2.0 (-1) | 1,661 (-10%) | 10mo | $230,000 | $138 | 51 |
| 1117 Richmond Rd | 0.65mi | 3/2.0 | 1,857 (+1%) | 21mo | $261,000 | $141 | 51 |
| 1316 Every Ct | 0.42mi | 3/2.0 | 1,612 (-12%) | 23mo | $242,000 | $150 | 41 |
| 1016 E Edwards St | 0.61mi | 3/2.5 | 1,598 (-13%) | 8mo | $258,500 | $162 | 41 |
| 409 Canyon Rd | 0.71mi | 3/2.5 | 1,925 (+5%) | 23mo | $290,000 | $151 | 38 |
| 816 New Bond Cir | 0.69mi | 4/2.5 (+1) | 2,086 (+13%) | 24mo | $296,827 | $142 | 18 |
Match score weights: distance 35% · size 25% · config 20% · recency 20%. Top-matched comps best support the ARV.
Projected returns pro-forma
-3.0% appreciation · 2.49% rent growth · sell at horizon
- IRR
- -17.9%
- Equity multiple
- 0.37×
- Total profit
- $-39,551
- Equity at exit
- $33,548
- IRR
- -11.1%
- Equity multiple
- 0.35×
- Total profit
- $-41,067
- Equity at exit
- $19,454
Cash invested: $63,000 (down + closing). Projections, not guarantees.
Landlord ↔ Tenant lean methodology
- Overall (STATE)
- 83 Strongly Landlord-Friendly
- State Oklahoma
- 83 Strongly Landlord-Friendly · R+20
- County
- — inherits STATE
- City
- — inherits STATE
ZIP-level market 73034
- Rents YoY
- 2.5%
- Active inventory
- 763
- Price-to-rent
- 9.7×
Monthly cashflow live
- Estimated rent
- $1,926 high interval (Pro) →
- Mortgage (P&I)
- −$1,180
- Tax est. 1.5%
- −$281 /mo · $3,375/yr
- Insurance
- −$94
- HOA
- −$0
- Vacancy / Maint / Mgmt
- −$404
- Net cashflow
- $-34
Break-even live
UW: 25.0% down · 7.5% · 30yr · 1.5% tax · 5.0% vac · 8.0% maint · 8.0% mgmt
Financing live
Cash to close
- Down payment
- $56,250
- Closing costs
- $6,750
- Reserves months
- —
- Total cash needed
- —
Loan-product check · same deal, 3 products live
Conventional
25% down · 7.5% · 30yr
- Down + closing
- —
- Monthly P&I
- —
- Monthly cashflow
- —
- DSCR
- —
- Eligible?
- —
Personal DTI + credit; lowest rate.
DSCR
20% down · 8.5% · 30yr
- Down + closing
- —
- Monthly P&I
- —
- Monthly cashflow
- —
- DSCR
- —
- Eligible?
- —
No personal income docs; deal must DSCR.
Hard money
10% down · 12.0% · 12mo
- Down + closing
- —
- Monthly P&I
- —
- Monthly cashflow
- —
- DSCR
- —
- Eligible?
- —
Short-term bridge; refi at stabilization.
Rent comps 40 comps
| Address | Beds | Baths | Sqft | Rent | $/sqft | DOM | Units | Dist |
|---|---|---|---|---|---|---|---|---|
| 504 N Boulevard Edmond, OK | 3.0 | 2.0 | 1250 | $2,595 | $2.08 | 14d | 1 | 0.20mi |
| 225 E Edwards St Edmond, OK | 4.0 | 2.0 | 1816 | $1,950 | $1.07 | 14d | 1 | 0.27mi |
| 436 Chalk Hill Ct Edmond, OK | 3.0 | 2.0 | 1274 | $2,850 | $2.24 | 23d | 1 | 0.56mi |
| 436 Chalk Hill Ct Edmond, OK | 3.0 | 2.0 | 1274 | $2,850 | $2.24 | 21d | 1 | 0.56mi |
| 128 Ashley Dr Edmond, OK | 3.0 | 2.0 | 1250 | $1,455 | $1.16 | 23d | 1 | 0.57mi |
| 201 Barrett Pl Edmond, OK | 2.0 | 1.0 | 2034 | $1,095 | $0.54 | 2d | 1 | 0.57mi |
| 200 Ashley Dr Edmond, OK | 3.0 | 2.0 | 1225 | $1,375 | $1.12 | 23d | 1 | 0.58mi |
| 1016 E Edwards St Edmond, OK | 4.0 | 2.5 | 1598 | $1,900 | $1.19 | 23d | 1 | 0.59mi |
| 425 Chalk Hill Ct Edmond, OK | 3.0 | 2.0 | 1243 | $1,550 | $1.25 | 14d | 1 | 0.60mi |
| 211 Ashley Dr Edmond, OK | 3.0 | 2.0 | 1250 | $1,440 | $1.15 | 23d | 1 | 0.62mi |
| 812 Richmond Rd Edmond, OK | 3.0 | 2.0 | 2211 | $1,800 | $0.81 | 23d | 1 | 0.63mi |
| 1117 Sequoyah Pl Unit C Edmond, OK | 3.0 | 2.5 | 1554 | $1,675 | $1.08 | 23d | 1 | 0.63mi |
| 1117 Sequoyah Pl Unit C Edmond, OK | 3.0 | 2.5 | 1554 | $1,675 | $1.08 | 14d | 1 | 0.63mi |
| 101 W Main St Edmond, OK | 3.0 | 1.0–2.0 | 991 | $2,320 | $2.34 | 1d | 111 | 0.64mi |
| 1225 E Main St Edmond, OK | 2.0 | 2.5 | 1235 | $1,650 | $1.34 | 23d | 1 | 0.78mi |
| 413 Meadow Lake Dr Edmond, OK | 4.0 | 2.0 | 1369 | $1,500 | $1.10 | 2d | 1 | 0.84mi |
| 16 N Walnut St Edmond, OK | 3.0 | 2.5 | 1650 | $2,395 | $1.45 | 14d | 1 | 0.86mi |
| 401 E 7th St Edmond, OK | 3.0 | 2.0 | 1255 | $1,450 | $1.16 | 23d | 1 | 0.95mi |
| 1718 Windhill Ave Edmond, OK | 2.0 | 2.0 | 1724 | $1,650 | $0.96 | 23d | 1 | 1.01mi |
| 1718 Windhill Ave Unit 1 Edmond, OK | 2.0 | 2.0 | 1724 | $1,600 | $0.93 | 23d | 1 | 1.01mi |
| 463 S Fretz Ave Edmond, OK | 2.0 | 2.0 | 1550 | $1,695 | $1.09 | 14d | 1 | 1.06mi |
| 1820 Three Stars Rd Edmond, OK | 3.0 | 3.0 | 1914 | $1,625 | $0.85 | 4d | 1 | 1.10mi |
| 1820 Three Stars Rd Edmond, OK | 3.0 | 3.0 | 1914 | $1,625 | $0.85 | 23d | 1 | 1.10mi |
| 541 S Fretz Ave Edmond, OK | 2.0 | 2.5 | 1682 | $1,795 | $1.07 | 23d | 1 | 1.12mi |
| 1902 Three Stars Rd Edmond, OK | 3.0 | 2.5 | 1705 | $1,575 | $0.92 | 23d | 1 | 1.12mi |
| 612 W 2nd St Unit 100 Edmond, OK | 3.0 | 2.5 | 1414 | $1,895 | $1.34 | 21d | 1 | 1.13mi |
| 575 S Fretz Ave Edmond, OK | 3.0 | 2.5 | 1530 | $2,000 | $1.31 | 2d | 1 | 1.13mi |
| 1719 Craig Blvd Edmond, OK | 4.0 | 2.0 | 1747 | $1,750 | $1.00 | 2d | 1 | 1.13mi |
| 645 W 2nd St Edmond, OK | 3.0 | 2.0 | 1660 | $1,975 | $1.19 | 14d | 1 | 1.15mi |
| 405 Sundance Ln Unit 1 Edmond, OK | 2.0 | 2.0 | 1627 | $1,750 | $1.08 | 4d | 1 | 1.23mi |
| 1919 E 2nd St Edmond, OK | 1.0–3.0 | 1.0–2.0 | 964 | $1,455 | $1.51 | 1d | 42 | 1.24mi |
| 2030 Three Stars Rd Edmond, OK | 3.0 | 3.0 | 2054 | $1,650 | $0.80 | 4d | 1 | 1.27mi |
| 609 Abadan Dr Edmond, OK | 3.0 | 3.5 | 2292 | $2,500 | $1.09 | 2d | 1 | 1.27mi |
| 428 Sundance Ln Edmond, OK | 3.0 | 3.0 | 2082 | $1,795 | $0.86 | 23d | 1 | 1.28mi |
| 616 Abadan Dr Edmond, OK | 3.0 | 3.5 | 2412 | $2,400 | $1.00 | 14d | 1 | 1.30mi |
| 1925 Bunting Ct Edmond, OK | 4.0 | 3.0 | 1420 | $2,900 | $2.04 | 23d | 1 | 1.34mi |
| 2133 E 2nd St Edmond, OK | 1.0–3.0 | 1.0–2.0 | 1077 | $2,004 | $1.86 | 1d | 30 | 1.36mi |
| 1024 Carpe Diem Ct Edmond, OK | 3.0 | 2.0 | 1700 | $1,895 | $1.11 | 2d | 1 | 1.38mi |
| 1308 Lemon Ranch Rd Edmond, OK | 3.0 | 2.0 | 2169 | $2,995 | $1.38 | 23d | 1 | 1.42mi |
| 1129 Carpe Diem Ct Edmond, OK | 3.0 | 2.0 | 1250 | $1,595 | $1.28 | 4d | 1 | 1.43mi |
Listing history 3 events
-
2026-06-07statusdays on market $225,000 Pending 3 DOM
-
2026-06-02remarks 699-char remark
-
2026-06-02$225,000 Active 1 DOM
ⓘ Source: listings_history table (triggers on properties + properties_extension) + one-shot
backfill from property_details.listing_events for pre-trigger history.
Climate risk First Street
- Flood 1/10 Low FEMA zone X (unshaded) · 0% chance over 30 yrs
- Wildfire 1/10 Low
- Heat 6/10 Major 7 d/yr ≥108°F today · 19 d/yr by 30 yrs out
- Wind 2/10 Low 3% chance of damaging wind over 30 yrs
- Air quality 2/10 Low 2 unhealthy d/yr today · 2 by 30 yrs out
Nearby sold comps map
Loading sold comps map…
Walkable amenities ~0.75 mi
Loading nearby amenities…
Taxation est. · year 1
- Rental income
- $23,109
- − Mortgage interest
- −$12,603
- − Property taxes
- −$3,375
- − Insurance
- −$1,125
- − Repairs & maintenance
- −$1,849
- − Management
- −$1,849
- − Depreciation
- −$6,545
- Taxable loss
- −$4,237
- Est. tax savings @ 24.0%
- +$1,017
- After-tax cash flow
- $614/yr
For passive investors: Depreciation is non-cash, so a rental often shows a tax loss while cash-flowing — sheltering income. Rental losses are passive: they offset passive income freely, and up to $25,000/yr can offset ordinary (W-2) income if you actively participate and your MAGI is under $100k (phasing out to $0 by $150k); unused losses carry forward. On sale, claimed depreciation is recaptured at up to 25%, and gains may owe capital-gains tax (a 1031 exchange can defer both). Figures are a year-1 estimate at your 24.0% rate — not tax advice; consult a CPA.
Condition & rehab AI · 12 photos
The home is in average condition with moderate rehabilitation needed. It has original hardwood floors and a good roof, but requires painting and updating the kitchen and exterior to increase its value.
Repairs flagged
- Minor rain gutters and downspouts — New rain gutters and downspouts are installed
- Minor exterior door and jam — New west side exterior door and jam to garage
Value-add opportunities
- Both Paint exterior — Enhances curb appeal and resale value
- Both Replace rain gutters and downspouts — Improves water drainage and aesthetics
- Both Replace kitchen appliances — Modernizes kitchen and increases resale value
- Both Paint interior walls — Enhances interior appearance and resale value
Renovation cost estimate screening
| Repair item | Severity | Est. cost |
|---|---|---|
| rain gutters and downspouts · New rain gutters and downspouts are installed | Minor | $500–3,000 |
| exterior door and jam · New west side exterior door and jam to garage | Minor | $500–3,000 |
| Total estimated repair cost · 2 items | $1,000–6,000 |
Value-add ROI direction
- Both Paint exterior — Enhances curb appeal and resale value ↑
- Both Replace rain gutters and downspouts — Improves water drainage and aesthetics ↑
- Both Replace kitchen appliances — Modernizes kitchen and increases resale value ↑
- Both Paint interior walls — Enhances interior appearance and resale value ↑
ⓘ Cost ranges are severity-bucket heuristics (US national rule-of-thumb). Get contractor quotes + a written scope before underwriting a rehab budget.
Schools (NCES district)
- District
- Edmond
- NCES district ID
- 4010590
- Math proficiency
- 38% ▼ -12.00%
- Reading proficiency
- 40% ▼ -12.00%
- Median HH income
- $73,212
- Composite
- 35.88/100
- National rank
- #4814
- State rank
- #11 of 270 in OK
Livability — Edmond
- Score
- 78/100
- State rank
- #6
- US rank
- #2383
Category grades
Schools grade is shown separately in the Schools card above.
Census & demographics
- Census place
- Edmond, OK
- County
- Oklahoma County · 771,644 people
- City population
- 177,083
- Metro
- Oklahoma City, OK
- Population (ZIP)
- 48,831
- Household income
- $109,700
- Rent vs Own
- Severe rent burden
- 1198.0
Population outlook (Oklahoma County) Hauer SSP2
- Today (2025)
- 911,875 people
- By 2030
- 982,413 · +7.7%
- By 2040
- 1,130,468 · +24.0%
- By 2050
- 1,288,422 · +41.3%
- By 2075
- 1,711,482 · +87.7%
- By 2100
- 2,088,448 · +129.0%
Race, ethnicity, and origin ACS 2023
- Neighborhood character
- Predominantly White (76%)
- Race & ethnicity
- White 76% Two or more races 10% Hispanic / Latino 8% Asian 4% Black 3% Native American 3%
- Hispanic origin (detail)
- Mexican 4%
- Common ancestry
- Italian 4% Slovak 3% Lithuanian 3%
- Foreign-born
- 6% · Canada, China, Vietnam
- Languages at home
- 92% English-only · Spanish 4% Other Indo-European 1% Chinese 1%
Political lean MEDSL · Oklahoma
- 2024 margin
- Toss-up / Even · D 48.0% · R 49.7% · Other 2.3%
- 2008→2024 swing
- +15.1pp toward D · 2008: -16.8pp · 2024: -1.7pp
- All cycles
- 2024: R+1.7 2020: R+1.1 2016: R+10.5 2012: R+16.7 2008: R+16.8
Not yet ingested
- Civics
- —
Market trends
- HPI YoY
- ▼ -164.67%
- Current HPI
- 223.1391
- Rent YoY
- ▲ 2.49%
- Metro
- Oklahoma City, OK
- State GDP YoY
- ▲ 1.55%
- F500 in state
- 6
Industry mix (Fortune 500 HQ in OK)
| Industry | F500 HQs | Revenue |
|---|---|---|
| Energy | 3 | $48B |
|
||
Price history
1 event — show timeline
- 2026-06-02 Listed $225,000 MLSOK
Cash-flow waterfall
monthlySold comps — $/sqft
last 12 mo · ≤1 miLoading sold comps…