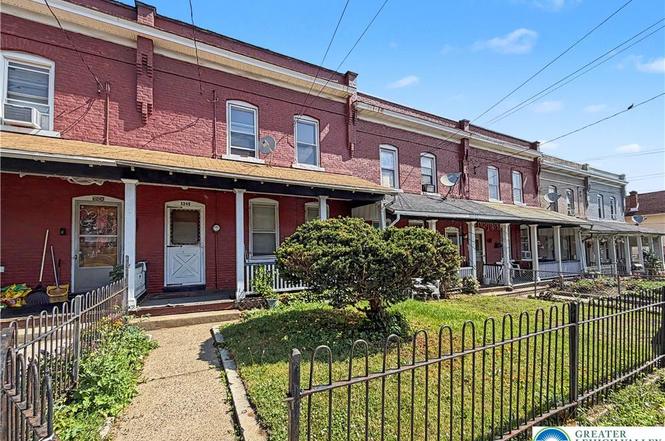
1245 E 3rd St · Bethlehem, PA
Flood risk 1/10 · Minimal
- FEMA flood zone
- X (unshaded)
- Chance of flooding over 30 yrs
- 0.0%
- Est. flood insurance / yr
- $473 – $860
Fire risk 2/10 · Minimal
- Est. fire insurance / yr
- $511 – $949
Heat risk 5/10 · Moderate
- Hot days now (above 99°F)
- 7 days/yr
- Hot days in 30 yrs
- 15 days/yr
Wind risk 4/10 · Minor
- Chance of severe wind over 30 yrs
- 20.0%
Air-quality risk 4/10 · Minor
- Unhealthy air days now
- 3 days/yr
- Unhealthy air days in 30 yrs
- 6 days/yr
Risk factors via First Street. Map © Google.
Why this score? — see what drove the C+ grade
The composite is a weighted blend of 9 inputs, each scored 0–100. Each bar is that input's sub-score; the figure is the points it added to the 100-point composite (weight × sub-score).
- Cash flow +22.3/30.0
- ARV discount +11.8/15.0
- DSCR +7.1/10.0
- 1% rule +5.4/10.0
- Rent growth +4.3/5.0
- Livability +4.1/5.0
- Schools +3.5/10.0
- Condition / age +2.5/5.0
- Appreciation +0.0/10.0
$199,000
🖨 Deal sheet 📄 Offer letter ✓ Due diligence
Listing remarks MLS
Nice Starter Home For First Time Home Buyer or Great Investment Property. This Home Offers 3 Bedrooms, 1 Bath, 1 Half Bath, Hardwood Floors, Eat-In Kitchen, Diningroom and Covered Front and Back Porch. Walking Distance To Lehigh, Casino, and Downtown South Bethlehem.
Key facts
- Covered front porch
- Formal dining room
- Eat-in kitchen
Tags
Property features AI
Exterior
- Parking: Attached garage (1 car); Off-street parking
- Utilities: Public water; Public sewer
- Home design: Two-story house; Brick construction; Asphalt/fiberglass roof
- Construction: Brick construction; Asphalt/fiberglass roof
- Exterior features: Front porch; Patio
Interior
- Kitchen: Gas oven
- Flooring: Carpet; Hardwood; Linoleum; Vinyl
- Bathrooms: Three full bathrooms; Full bathroom on the first floor; Full bathroom in the basement
- Heating & cooling: Oil heating with radiators; Ceiling fans
- Interior features: Attic; Dining area; Separate/formal dining room; Eat-in kitchen; Storage
- Laundry & utility: Laundry on lower level; Gas water heater
Neighborhood map
What this means for you Summary
Snapshot
- This is a 3-bed/1.5-bath townhouse listed at $199k.
Deal economics
- At list price, monthly cash flow is $328 ($4k/yr) — positive.
- The deal already cash-flows at list — no discount required.
- Meets the 1% rule at list price ($2k rent vs $199k).
- Cap rate 8.3% vs local median 4.3% in Bethlehem — top-decile yield for the area; either an underpriced asset or a hidden risk that comps aren't pricing in. Stress-test before assuming the spread holds.
Location & tenants
- Location reads 82/100 on livability (#138 in PA, #1,122 nationally) — a professional / high-income tenant draw. Strengths: amenities A+, cost of living A+, housing A+; Watch: commute F.
- Bethlehem Area SD (urban): math 31% / reading 49% proficiency, ranked #342 of 539 in PA (top 64%) — families likely to look elsewhere, expect single-tenant / working-renter base with shorter leases.
- Market conditions: Rents rising fast (+7.2%/yr); 156 active listings in the ZIP; 40 comparable units currently listed for rent nearby; rentals at typical pace (median 23d on market — plan ~3-4 weeks tenant-placement turnaround); 567 units permitted in Northampton County in 2024 (151 in 5+ unit buildings).
- This rent runs 41% of the median local income ($61k/yr) — at the standard rent-burdened threshold; future hikes will face affordability resistance.
Forward outlook
- Local home prices are declining (-3.0%/yr); year-one equity from $1k of loan paydown is wiped out by about $6k of value loss. Plan a longer hold.
- At projected returns (-3.0% appreciation + 7.2% rent growth), your $56k cash investment doubles in ~9 years — after that, you're playing with house money.
Negotiation context
- Only 5 days on market — expect competitive offers; lowballing is unlikely to land.
- 2 sale attempts since 17y ago with the ask held roughly flat each time — persistent listings suggest the price (not the market) is what's stuck; bring a comps-based counter.
- Current owner paid $78k; list at $199k implies a 155% gain — meaningful room to come down on a strong offer.
Risks & watch-outs
- Watch-outs: built in 1915 — expect roof / HVAC / electrical / plumbing capex.
- Climate carrying-cost: extreme-heat days projected 7→15/yr by 2055 (HVAC capex compounding) — expect insurance premiums to compound above CPI over the hold.
Questions for the listing agent
- Built in 1915 — when were the roof, HVAC, electrical panel, plumbing, and water heater last replaced?
- Is there a deadline driving the sale (1031 exchange, divorce, estate, relocation)? That informs how much negotiation room exists.
- Schools are B-rated — typically a magnet for longer-tenancy family renters. What's the average tenant stay here, and is there a school-zone premium baked into asking?
- What's the average days-on-market for RENTAL listings here right now (not sales)? A rising rental-DOM trend means longer vacancies and softer asking-rent achievability than the comps imply.
- What's the recent tenant-quality profile in this submarket — average credit score on applications, eviction rate, late-payment / NSF rate, and stable-employment percentage? A property-management company in the area should have these aggregated.
- How much new for-sale + rental construction is in the pipeline within 1–3 miles? Heavy new supply typically softens prices + rents 12–24 months out; constrained supply supports both.
Investment metrics
- 1% rule
- 1.04% ✓
- Cap rate
- 8.27%
- Cash-on-cash
- 7.06%
- DSCR
- 1.31
- GRM
- 8.0
CMA / ARV
- ARV (on-the-fly)
- $220,220
- Comps found
- 12
Show comp detail 12 sales within ~0.75 mi
| Address | Dist | Beds/Ba | Sqft | Sold | Price | $/sf | Match |
|---|---|---|---|---|---|---|---|
| 1229 E 3rd St | 0.03mi | 3/1.5 | 1,430 (0%) | 7mo | $200,000 | $140 | 93 |
| 208 Hobart St | 0.10mi | 3/1.5 | 1,313 (-8%) | 1mo | $140,000 | $107 | 81 |
| 1252 E 4th St | 0.12mi | 3/1.0 | 1,280 (-10%) | 0mo | $245,000 | $191 | 75 |
| 1008 E 3rd St | 0.34mi | 4/1.0 (+1) | 1,458 (+2%) | 8mo | $260,000 | $178 | 68 |
| 412 Atlantic St | 0.52mi | 3/1.5 | 1,337 (-6%) | 0mo | $245,000 | $183 | 64 |
| 616 E 5th St | 0.66mi | 3/1.0 | 1,401 (-2%) | 0mo | $249,900 | $178 | 63 |
| 1137 Mechanic St | 0.19mi | 3/1.0 | 1,236 (-14%) | 8mo | $169,000 | $137 | 59 |
| 1543 E 8th St | 0.51mi | 3/1.0 | 1,504 (+5%) | 9mo | $201,000 | $134 | 58 |
| 314 State St | 0.34mi | 4/2.0 (+1) | 1,314 (-8%) | 8mo | $166,000 | $126 | 57 |
| 815 Laufer St | 0.52mi | 2/1.0 (-1) | 1,264 (-12%) | 6mo | $159,550 | $126 | 44 |
| 649 Shields St | 0.55mi | 4/1.0 (+1) | 1,258 (-12%) | 4mo | $204,900 | $163 | 44 |
| 630 Pierce St | 0.70mi | 3/2.0 | 1,247 (-13%) | 5mo | $192,500 | $154 | 40 |
Match score weights: distance 35% · size 25% · config 20% · recency 20%. Top-matched comps best support the ARV.
Projected returns pro-forma
-3.0% appreciation · 7.18% rent growth · sell at horizon
- IRR
- -1.1%
- Equity multiple
- 0.96×
- Total profit
- $-2,358
- Equity at exit
- $29,672
- IRR
- 12.5%
- Equity multiple
- 2.17×
- Total profit
- $65,180
- Equity at exit
- $17,206
Cash invested: $55,720 (down + closing). Projections, not guarantees.
Landlord ↔ Tenant lean methodology
- Overall (STATE)
- 62 Landlord-Friendly
- State Pennsylvania
- 62 Landlord-Friendly · EVEN
- County
- — inherits STATE
- City
- — inherits STATE
ZIP-level market 18015
- Home prices YoY
- -30.7%
- Rents YoY
- 7.2%
- Active inventory
- 156
- Price-to-rent
- 8.0×
Monthly cashflow live
- Estimated rent
- $2,062 high interval (Pro) →
- Mortgage (P&I)
- −$1,044
- Tax from tax record
- −$175 /mo · $2,097/yr
- Insurance
- −$83
- HOA
- −$0
- Vacancy / Maint / Mgmt
- −$433
- Net cashflow
- $328
Break-even live
UW: 25.0% down · 7.5% · 30yr · 1.5% tax · 5.0% vac · 8.0% maint · 8.0% mgmt
Financing live
Cash to close
- Down payment
- $49,750
- Closing costs
- $5,970
- Reserves months
- —
- Total cash needed
- —
Loan-product check · same deal, 3 products live
Conventional
25% down · 7.5% · 30yr
- Down + closing
- —
- Monthly P&I
- —
- Monthly cashflow
- —
- DSCR
- —
- Eligible?
- —
Personal DTI + credit; lowest rate.
DSCR
20% down · 8.5% · 30yr
- Down + closing
- —
- Monthly P&I
- —
- Monthly cashflow
- —
- DSCR
- —
- Eligible?
- —
No personal income docs; deal must DSCR.
Hard money
10% down · 12.0% · 12mo
- Down + closing
- —
- Monthly P&I
- —
- Monthly cashflow
- —
- DSCR
- —
- Eligible?
- —
Short-term bridge; refi at stabilization.
Rent comps 40 comps
| Address | Beds | Baths | Sqft | Rent | $/sqft | DOM | Units | Dist |
|---|---|---|---|---|---|---|---|---|
| 1209 Mechanic St Bethlehem, PA | 3.0 | 1.0 | 1003 | $2,000 | $1.99 | 21d | 1 | 0.11mi |
| 1275 E 4th St Unit 202 Bethlehem, PA | 2.0 | 2.0 | 1225 | $1,950 | $1.59 | 23d | 1 | 0.13mi |
| 1201 E 4th St Unit 4 Bethlehem, PA | 3.0 | 1.5 | 1100 | $1,800 | $1.64 | 43d | 1 | 0.14mi |
| 1306 E 4th St #3 Bethlehem, PA | 2.0 | 1.0 | 1000 | $1,550 | $1.55 | 43d | 1 | 0.16mi |
| 1122 E 4th St Bethlehem, PA | 4.0 | 1.0 | 1706 | $1,800 | $1.06 | 14d | 1 | 0.26mi |
| 1113 E 4th St Unit 1 Bethlehem, PA | 2.0 | 1.0 | 1000 | $1,350 | $1.35 | 23d | 1 | 0.26mi |
| 1236 E 7th St Bethlehem, PA | 3.0 | 2.5 | 1424 | $2,350 | $1.65 | 2d | 1 | 0.30mi |
| 314 State St Bethlehem, PA | 4.0 | 2.0 | 1654 | $2,650 | $1.60 | 14d | 1 | 0.35mi |
| 938 E 4th St #401 Bethlehem, PA | 2.0 | 1.0 | 928 | $2,150 | $2.32 | 43d | 1 | 0.38mi |
| 938 E 4th St Unit 201 Bethlehem, PA | 2.0 | 1.0 | 982 | $2,350 | $2.39 | 43d | 1 | 0.38mi |
| 740 Laufer St Bethlehem, PA | 3.0 | 1.5 | 910 | $1,650 | $1.81 | 14d | 1 | 0.59mi |
| 610 E 3rd St Bethlehem, PA | 1.0–2.0 | 1.0–2.0 | 974 | $3,008 | $3.09 | 2d | 8 | 0.63mi |
| 612 E 5th St Bethlehem, PA | 4.0 | 2.0 | 1814 | $2,500 | $1.38 | 43d | 1 | 0.68mi |
| 824 E 8th St Bethlehem, PA | 2.0 | 1.5 | 952 | $1,400 | $1.47 | 43d | 1 | 0.70mi |
| 436 Pierce St Bethlehem, PA | 4.0 | 2.0 | 1452 | $2,250 | $1.55 | 2d | 1 | 0.71mi |
| 650 E North St Bethlehem, PA | 2.0 | 1.0–2.0 | 935 | $2,350 | $2.51 | 14d | 7 | 0.72mi |
| 417 Linden St Bethlehem, PA | 3.0 | 1.5 | 1699 | $2,450 | $1.44 | 2d | 1 | 0.80mi |
| 239 E Church St Bethlehem, PA | 3.0 | 2.5 | 1724 | $2,950 | $1.71 | 23d | 1 | 0.83mi |
| 311 E 3rd St Bethlehem, PA | 2.0 | 2.0 | 1189 | $2,330 | $1.96 | 2d | 3 | 0.87mi |
| 802 Elm St Bethlehem, PA | 4.0 | 1.5 | 1520 | $2,800 | $1.84 | 21d | 1 | 0.94mi |
| 822 Elm St Bethlehem, PA | 3.0 | 1.5 | 1406 | $2,195 | $1.56 | 14d | 1 | 0.97mi |
| 537 Goepp Cir Unit B Bethlehem, PA | 3.0 | 1.5 | 1225 | $1,895 | $1.55 | 43d | 1 | 1.01mi |
| 316 E Union Blvd Bethlehem, PA | 4.0 | 2.0 | 1460 | $2,145 | $1.47 | 43d | 1 | 1.03mi |
| 746 Linden St Unit 2 Bethlehem, PA | 3.0 | 1.0 | 1008 | $1,975 | $1.96 | 43d | 1 | 1.03mi |
| 42 E Wall St Bethlehem, PA | 4.0 | 1.0 | 1474 | $2,550 | $1.73 | 23d | 1 | 1.09mi |
| 214 Clearfield St Freemansburg, PA | 3.0 | 1.0 | 966 | $1,700 | $1.76 | 2d | 1 | 1.11mi |
| 229 E Union Blvd Unit 2nd Floor Bethlehem, PA | 2.0 | 1.0 | 982 | $1,595 | $1.62 | 2d | 1 | 1.11mi |
| 229 E Union Blvd Unit 1st Floor Bethlehem, PA | 2.0 | 1.0 | 1000 | $1,675 | $1.68 | 2d | 1 | 1.11mi |
| 11 W 2nd St Bethlehem, PA | 2.0 | 2.0 | 1620 | $2,550 | $1.57 | 23d | 4 | 1.13mi |
| 30 E Market St Apt 1 Bethlehem, PA | 2.0 | 1.0 | 1200 | $1,950 | $1.62 | 43d | 1 | 1.14mi |
| 1138 Arcadia St Bethlehem, PA | 3.0 | 1.0 | 1802 | $2,095 | $1.16 | 43d | 1 | 1.15mi |
| 1240 Pembroke Rd #2 Bethlehem, PA | 2.0 | 1.0 | 1300 | $1,495 | $1.15 | 43d | 1 | 1.17mi |
| 1240 Pembroke Rd #1 Bethlehem, PA | 3.0 | 1.0 | 1249 | $1,795 | $1.44 | 43d | 1 | 1.17mi |
| 315 Clearfield St Freemansburg, PA | 2.0 | 1.0 | 1040 | $2,000 | $1.92 | 2d | 1 | 1.20mi |
| 315 Clearfield St Unit A Freemansburg, PA | 2.0 | 1.0 | 1040 | $2,000 | $1.92 | 2d | 1 | 1.20mi |
| 326 E Frankford St Bethlehem, PA | 2.0 | 2.0 | 1250 | $2,300 | $1.84 | 43d | 1 | 1.20mi |
| 326 E Frankford St Bethlehem, PA | 2.0 | 2.0 | 1250 | $2,300 | $1.84 | 23d | 1 | 1.20mi |
| 122 E Goepp St Unit 1 Bethlehem, PA | 3.0 | 1.0 | 1137 | $1,895 | $1.67 | 2d | 1 | 1.24mi |
| 830 Media St Bethlehem, PA | 3.0 | 1.0 | 1128 | $2,100 | $1.86 | 23d | 1 | 1.25mi |
| 830 Media St Bethlehem, PA | 3.0 | 1.0 | 1128 | $2,100 | $1.86 | 43d | 1 | 1.25mi |
Listing history 4 events
-
2026-06-16statusdays on market $199,000 Pending 5 DOM
-
2026-06-15days on market $199,000 Active 4 DOM
-
2026-06-14remarks 693-char remark
-
2026-06-14$199,000 Active 2 DOM
ⓘ Source: listings_history table (triggers on properties + properties_extension) + one-shot
backfill from property_details.listing_events for pre-trigger history.
Tax reassessment forecast PA · Partial reset (capped growth)
- Current annual tax
- $2,097 · $175/mo
- Projected year-2 tax
- $2,621 · $218/mo
- Expected delta
- +$524/yr (+$44/mo · 25.0%)
ⓘ Screening estimate from a state-policy table — verify with the county assessor before closing.
Climate risk First Street
- Flood 1/10 Low FEMA zone X (unshaded) · 0% chance over 30 yrs
- Wildfire 2/10 Low
- Heat 5/10 Major 7 d/yr ≥99°F today · 15 d/yr by 30 yrs out
- Wind 4/10 Moderate 20% chance of damaging wind over 30 yrs
- Air quality 4/10 Moderate 3 unhealthy d/yr today · 6 by 30 yrs out
Nearby sold comps map
Loading sold comps map…
Walkable amenities ~0.75 mi
Loading nearby amenities…
Taxation est. · year 1
- Rental income
- $24,742
- − Mortgage interest
- −$11,147
- − Property taxes
- −$2,097
- − Insurance
- −$995
- − Repairs & maintenance
- −$1,979
- − Management
- −$1,979
- − Depreciation
- −$5,789
- Taxable income
- $755
- Est. tax owed @ 24.0%
- −$181
- After-tax cash flow
- $3,750/yr
For passive investors: Depreciation is non-cash, so a rental often shows a tax loss while cash-flowing — sheltering income. Rental losses are passive: they offset passive income freely, and up to $25,000/yr can offset ordinary (W-2) income if you actively participate and your MAGI is under $100k (phasing out to $0 by $150k); unused losses carry forward. On sale, claimed depreciation is recaptured at up to 25%, and gains may owe capital-gains tax (a 1031 exchange can defer both). Figures are a year-1 estimate at your 24.0% rate — not tax advice; consult a CPA.
Schools (NCES district)
- District
- Bethlehem Area SD
- NCES district ID
- 4203570
- Math proficiency
- 31% ▼ -2.00%
- Reading proficiency
- 49% ▼ -6.00%
- Median HH income
- $55,124
- Composite
- 34.92/100
- National rank
- #5068
- State rank
- #342 of 539 in PA
Livability — Bethlehem
- Score
- 82/100
- State rank
- #138
- US rank
- #1122
Category grades
Schools grade is shown separately in the Schools card above.
Census & demographics
- Census place
- Bethlehem, PA
- County
- Northampton County · 236,814 people
- City population
- 129,661
- Metro
- Allentown-Bethlehem-Easton, PA-NJ
- Population (ZIP)
- 34,852
- Household income
- $60,800
- Rent vs Own
- Severe rent burden
- 1525.0
Population outlook (Northampton County) Hauer SSP2
- Today (2025)
- 312,227 people
- By 2030
- 314,769 · +0.8%
- By 2040
- 316,914 · +1.5%
- By 2050
- 318,037 · +1.9%
- By 2075
- 334,003 · +7.0%
- By 2100
- 344,696 · +10.4%
Race, ethnicity, and origin ACS 2023
- Neighborhood character
- Diverse neighborhood (Simpson 0.62)
- Race & ethnicity
- White 53% Hispanic / Latino 29% Two or more races 14% Black 10% Asian 5%
- Hispanic origin (detail)
- Mexican 2% Puerto Rican 19% Dominican 3%
- Common ancestry
- Romanian 4% Danish 1% Iranian 1%
- Foreign-born
- 12% · Canada, China, Jamaica
- Languages at home
- 73% English-only · Spanish 21% Chinese 2% Other Indo-European 2%
Political lean MEDSL · Northampton
- 2024 margin
- Toss-up / Even · D 48.6% · R 50.4%
- 2008→2024 swing
- -14.1pp toward R · 2008: 12.3pp · 2024: -1.8pp
- All cycles
- 2024: R+1.8 2020: D+0.7 2016: R+3.8 2012: D+4.6 2008: D+12.3
Not yet ingested
- Civics
- —
Market trends
- HPI YoY
- ▼ -122.95%
- Current HPI
- 277.4721
- Rent YoY
- ▲ 7.18%
- Metro
- Allentown-Bethlehem-Easton, PA-NJ
- State GDP YoY
- ▲ 1.68%
- F500 in state
- 34
Industry mix (Fortune 500 HQ in PA)
| Industry | F500 HQs | Revenue |
|---|---|---|
| Healthcare | 2 | $309B |
|
||
| Insurance | 2 | $27B |
|
||
| Telecommunications / Media | 1 | $124B |
|
||
| Industrial Distribution | 1 | $22B |
|
||
| Financial Services | 1 | $20B |
|
||
| Chemicals / Materials | 1 | $18B |
|
||
Price history
+123.8% since first listed4 events — show timeline
- 2026-06-03 Listed $199,000 GLVRMLS
- 2010-08-11 Sold (Public Records) $78,000 Public Records
- 2010-07-30 Sold (MLS) $78,000 GLVRMLS
- 2009-11-12 Listed $88,900 GLVRMLS
Property tax history
+1.5%/yrLatest (2026): $2,097 · +3.5% YoY. Source: county tax records.
Cash-flow waterfall
monthlySold comps — $/sqft
last 12 mo · ≤1 miLoading sold comps…