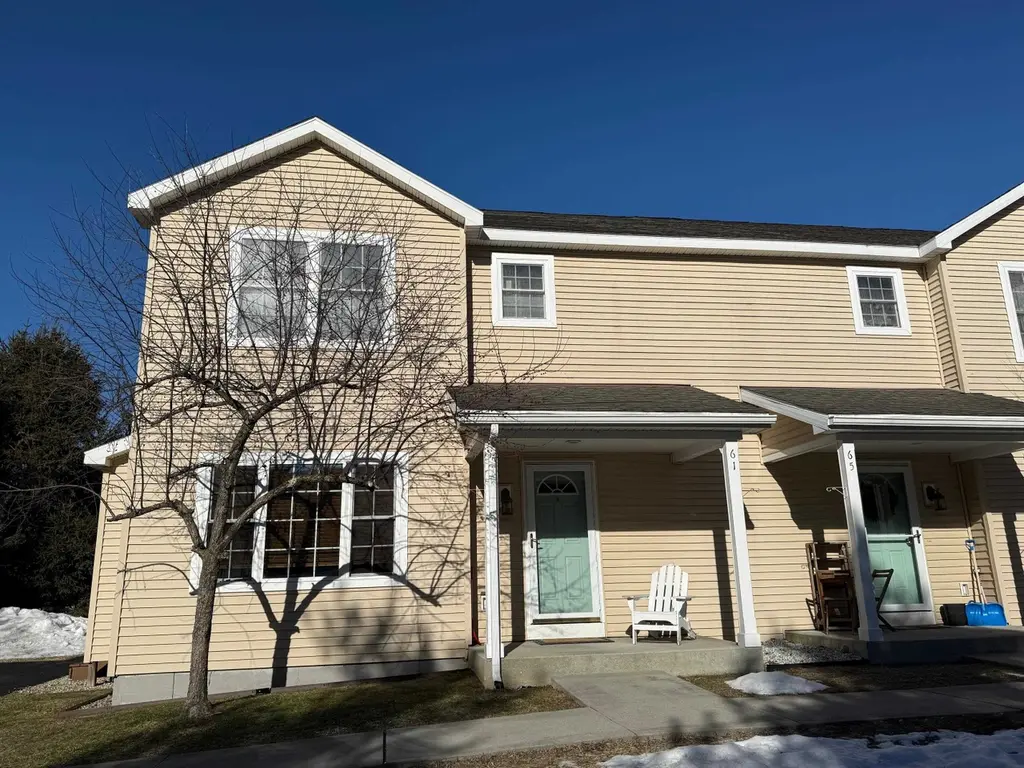
61 E Branch Farms #1 · Manchester, VT
Flood risk 1/10 · Minimal
- FEMA flood zone
- X (unshaded)
- Chance of flooding over 30 yrs
- 0.0%
- Est. flood insurance / yr
- $507 – $1,088
Fire risk 1/10 · Minimal
- Est. fire insurance / yr
- $480 – $892
Heat risk 2/10 · Minimal
- Hot days now (above 86°F)
- 7 days/yr
- Hot days in 30 yrs
- 17 days/yr
Wind risk 3/10 · Minor
- Chance of severe wind over 30 yrs
- 5.0%
Air-quality risk 2/10 · Minimal
- Unhealthy air days now
- 0 days/yr
- Unhealthy air days in 30 yrs
- 1 days/yr
Risk factors via First Street. Map © Google.
Why this score? — see what drove the B grade
The composite is a weighted blend of 9 inputs, each scored 0–100. Each bar is that input's sub-score; the figure is the points it added to the 100-point composite (weight × sub-score).
- Cash flow +24.8/30.0
- Appreciation +10.0/10.0
- ARV discount +8.5/15.0
- DSCR +8.1/10.0
- 1% rule +7.2/10.0
- Schools +5.0/10.0
- Livability +3.1/5.0
- Rent growth +2.5/5.0
- Condition / age +2.5/5.0
$305,000
🖨 Deal sheet 📄 Offer letter ✓ Due diligence
Listing remarks MLS
East Branch Farms is in the most convenient location! This 3 bedroom and 2 and a half bath condo is ready for its next owners. Wood floors on the main level and new granite countertops in the kitchen. Full basement with both interior and exterior access for workshop space or extra storage. Located at the edge of lovely Manchester VT it is privately screened from the road with views of soaring Mount Equinox from the back yard. Enjoy the back yard area from your deck. 73 common acres include gardening spots and river access. Cornerstone Housing Partners provide a shared equity grant for a $78,075 price reduction. Purchaser must qualify. See attached documents. Close to town and to the mountains, this is a great spot to call home!
Key facts
- Back yard
- Wood floors
- Full basement
Tags
Neighborhood map
What this means for you Summary
Snapshot
- This is a 3-bed/2.5-bath condo listed at $305k.
Deal economics
- At list price, monthly cash flow is $649 ($8k/yr) — positive.
- The deal already cash-flows at list — no discount required.
- Meets the 1% rule at list price ($4k rent vs $305k).
- Recommended offer: $268k (12.0% below list) — sets the bar for market timing.
- Cap rate 8.8% vs local median 5.3% in Manchester — top-decile yield for the area; either an underpriced asset or a hidden risk that comps aren't pricing in. Stress-test before assuming the spread holds.
Location & tenants
- Location reads 61/100 on livability (#80 in VT) — a middle-class / working-renter tenant base. Strengths: crime B; Watch: health & safety D, amenities F, commute F.
- Market conditions: 31 active listings in the ZIP; 4 comparable units currently listed for rent nearby; rentals lingering (median 44d on market — plan ~5-8 weeks vacancy on turnover, expect pricing pressure); 100% of comp listings sitting > 30 days — soft ceiling on asking rent; 59 units permitted in Bennington County in 2024 (0 in 5+ unit buildings).
Forward outlook
- In year one you build about $33k of equity ($2k loan paydown + $30k appreciation (10.0% local appreciation)).
- Bennington County population projected at -23% by 2050 — secular population decline; favor cash flow + early exit over multi-decade hold.
- At projected returns (10.0% appreciation + 3.0% rent growth), your $85k cash investment doubles in ~3 years — after that, you're playing with house money.
- By year 2, paydown + projected appreciation supports a ~$52k cash-out refi (75% LTV) — recoverable capital for the next deal without selling this one.
Negotiation context
- It's been on market 151 days — a 12% lower offer ($268k) is reasonable based on typical stale-listing flexibility.
Questions for the listing agent
- It's been on market 151 days. Have you received any prior offers? Is the seller open to a 12% concession, seller financing, or rate buy-down credit?
- What does the HOA fee cover, when was the last increase, and are there any pending special assessments or reserve-fund shortfalls?
- Any open or pending special assessments — roof, HVAC, plumbing, elevator, façade? What's the per-unit balance and payoff schedule, and is the seller paying it off at close or rolling it to the buyer?
- Why hasn't it sold? Are there any deal-killer items the seller is aware of (foundation, flood, title, zoning, code violations)?
- Is there a deadline driving the sale (1031 exchange, divorce, estate, relocation)? That informs how much negotiation room exists.
- What's the average days-on-market for RENTAL listings here right now (not sales)? A rising rental-DOM trend means longer vacancies and softer asking-rent achievability than the comps imply.
- What's the recent tenant-quality profile in this submarket — average credit score on applications, eviction rate, late-payment / NSF rate, and stable-employment percentage? A property-management company in the area should have these aggregated.
- How much new apartment / multifamily construction is in the pipeline within 1–3 miles? Heavy new supply (>2% of stock underway) typically softens rents 12–24 months out; light construction supports rent growth.
Investment metrics
- 1% rule
- 1.22% ✓
- Cap rate
- 8.85%
- Cash-on-cash
- 9.12%
- DSCR
- 1.41
- GRM
- 6.8
CMA / ARV
- ARV (median comp)
- $311,580
- List price
- $305,000
- Delta
- -2.11%
- Verdict
- FAIR
- Comps
- 20 within 1.0 mi
Projected returns pro-forma
10.0% appreciation · 3.0% rent growth · sell at horizon
- IRR
- 31.0%
- Equity multiple
- 3.43×
- Total profit
- $207,599
- Equity at exit
- $274,768
- IRR
- 26.8%
- Equity multiple
- 7.78×
- Total profit
- $579,173
- Equity at exit
- $592,548
Cash invested: $85,400 (down + closing). Projections, not guarantees.
Landlord ↔ Tenant lean methodology
- Overall (STATE)
- 41 Moderately Tenant-Leaning
- State Vermont
- 41 Moderately Tenant-Leaning · D+15
- County
- — inherits STATE
- City
- — inherits STATE
ZIP-level market 05255
- Home prices YoY
- 8.9%
- Active inventory
- 31
- Price-to-rent
- 6.8×
Monthly cashflow live
- Estimated rent
- $3,711 medium interval (Pro) →
- Mortgage (P&I)
- −$1,599
- Tax from tax record
- −$211 /mo · $2,536/yr
- Insurance
- −$127
- HOA
- −$345
- Vacancy / Maint / Mgmt
- −$779
- Net cashflow
- $649
Break-even live
UW: 25.0% down · 7.5% · 30yr · 1.5% tax · 5.0% vac · 8.0% maint · 8.0% mgmt
Financing live
Cash to close
- Down payment
- $76,250
- Closing costs
- $9,150
- Reserves months
- —
- Total cash needed
- —
Loan-product check · same deal, 3 products live
Conventional
25% down · 7.5% · 30yr
- Down + closing
- —
- Monthly P&I
- —
- Monthly cashflow
- —
- DSCR
- —
- Eligible?
- —
Personal DTI + credit; lowest rate.
DSCR
20% down · 8.5% · 30yr
- Down + closing
- —
- Monthly P&I
- —
- Monthly cashflow
- —
- DSCR
- —
- Eligible?
- —
No personal income docs; deal must DSCR.
Hard money
10% down · 12.0% · 12mo
- Down + closing
- —
- Monthly P&I
- —
- Monthly cashflow
- —
- DSCR
- —
- Eligible?
- —
Short-term bridge; refi at stabilization.
Rent comps 4 comps
| Address | Beds | Baths | Sqft | Rent | $/sqft | DOM | Units | Dist |
|---|---|---|---|---|---|---|---|---|
| 32 Eagle Nest Rd Manchester, VT | 3.0 | 2.5 | 1299 | $25,000 | $19.25 | 44d | 1 | 0.23mi |
| 48 Della St Manchester Center, VT | 2.0 | 2.0 | 1250 | $3,500 | $2.80 | 44d | 1 | 0.34mi |
| 39 Sage Hill Rd Unit 25 Manchester Center, VT | 3.0 | 3.5 | 1618 | $5,000 | $3.09 | 44d | 1 | 0.79mi |
| 158 Riverside Townhouses Rd Unit 7 Manchester Center, VT | 2.0 | 1.5 | 1075 | $2,500 | $2.33 | 44d | 1 | 1.16mi |
HOA detail condo
- Monthly dues
- $345 · $4,140/yr
- Assessments
- None detected in remarks — confirm with the listing agent.
Listing history 16 events
-
2026-06-18days on market $305,000 Active 151 DOM
-
2026-06-17days on market $305,000 Active 150 DOM
-
2026-06-16days on market $305,000 Active 149 DOM
-
2026-06-15days on market $305,000 Active 148 DOM
-
2026-06-15days on market $305,000 Active 147 DOM
-
2026-06-13days on market $305,000 Active 146 DOM
-
2026-06-12days on market $305,000 Active 145 DOM
-
2026-06-09days on market $305,000 Active 142 DOM
-
2026-06-08days on market $305,000 Active 141 DOM
-
2026-06-08days on market $305,000 Active 140 DOM
-
2026-06-07days on market $305,000 Active 139 DOM
-
2026-06-03days on market $305,000 Active 136 DOM
-
2026-06-02days on market $305,000 Active 135 DOM
-
2026-06-01days on market $305,000 Active 134 DOM
-
2026-05-31days on market $305,000 Active 133 DOM
-
2026-01-18$305,000 Active 738-char remark
Show marketing remark (738 chars)
East Branch Farms is in the most convenient location! This 3 bedroom and 2 and a half bath condo is ready for its next owners. Wood floors on the main level and new granite countertops in the kitchen. Full basement with both interior and exterior access for workshop space or extra storage. Located at the edge of lovely Manchester VT it is privately screened from the road with views of soaring Mount Equinox from the back yard. Enjoy the back yard area from your deck. 73 common acres include gardening spots and river access. Cornerstone Housing Partners provide a shared equity grant for a $78,075 price reduction. Purchaser must qualify. See attached documents. Close to town and to the mountains, this is a great spot to call home!
ⓘ Source: listings_history table (triggers on properties + properties_extension) + one-shot
backfill from property_details.listing_events for pre-trigger history.
Tax reassessment forecast VT · Partial reset (capped growth)
- Current annual tax
- $2,536 · $211/mo
- Projected year-2 tax
- $4,166 · $347/mo
- Expected delta
- +$1,629/yr (+$136/mo · 64.2%)
ⓘ Screening estimate from a state-policy table — verify with the county assessor before closing.
Climate risk First Street
- Flood 1/10 Low FEMA zone X (unshaded) · 0% chance over 30 yrs
- Wildfire 1/10 Low
- Heat 2/10 Low 7 d/yr ≥86°F today · 17 d/yr by 30 yrs out
- Wind 3/10 Moderate 5% chance of damaging wind over 30 yrs
- Air quality 2/10 Low 0 unhealthy d/yr today · 1 by 30 yrs out
Nearby sold comps map
Loading sold comps map…
Walkable amenities ~0.75 mi
Loading nearby amenities…
Taxation est. · year 1
- Rental income
- $44,533
- − Mortgage interest
- −$17,085
- − Property taxes
- −$2,536
- − Insurance
- −$1,525
- − Repairs & maintenance
- −$3,563
- − Management
- −$3,563
- − HOA
- −$4,140
- − Depreciation
- −$8,873
- Taxable income
- $3,249
- Est. tax owed @ 24.0%
- −$780
- After-tax cash flow
- $7,006/yr
For passive investors: Depreciation is non-cash, so a rental often shows a tax loss while cash-flowing — sheltering income. Rental losses are passive: they offset passive income freely, and up to $25,000/yr can offset ordinary (W-2) income if you actively participate and your MAGI is under $100k (phasing out to $0 by $150k); unused losses carry forward. On sale, claimed depreciation is recaptured at up to 25%, and gains may owe capital-gains tax (a 1031 exchange can defer both). Figures are a year-1 estimate at your 24.0% rate — not tax advice; consult a CPA.
Schools (NCES district)
No district data.
Livability — Manchester
- Score
- 61/100
- State rank
- #80
- US rank
- #17922
Category grades
Schools grade is shown separately in the Schools card above.
Census & demographics
- Census place
- Manchester Center, VT
- City population
- 4,527
- Population (ZIP)
- 4,086
Population outlook (Bennington County) Hauer SSP2
- Today (2025)
- 34,407 people
- By 2030
- 32,975 · -4.2%
- By 2040
- 29,711 · -13.6%
- By 2050
- 26,638 · -22.6%
- By 2075
- 21,318 · -38.0%
- By 2100
- 16,086 · -53.2%
Race, ethnicity, and origin ACS 2023
- Neighborhood character
- Predominantly White (95%)
- Race & ethnicity
- White 95% Two or more races 3% Hispanic / Latino 2%
- Common ancestry
- Portuguese 4% Slovak 4% Lithuanian 2%
- Foreign-born
- 1% · Canada
- Languages at home
- 98% English-only · Spanish 2%
Political lean MEDSL · Bennington
- 2024 margin
- Strong D (+22.5) · D 60.0% · R 37.5% · Other 2.6%
- 2008→2024 swing
- -10.9pp toward R · 2008: 33.4pp · 2024: 22.5pp
- All cycles
- 2024: D+22.5 2020: D+27.3 2016: D+22.1 2012: D+33.3 2008: D+33.4
Not yet ingested
- Civics
- —
Market trends
- HPI YoY
- ▲ 32.85%
- Current HPI
- 403.1398
- Rent YoY
- —
- Metro
- —
- State GDP YoY
- —
- F500 in state
- 0
Price history
1 event — show timeline
- 2026-01-18 Listed $305,000 PrimeMLS
Cash-flow waterfall
monthlySold comps — $/sqft
last 12 mo · ≤1 miLoading sold comps…