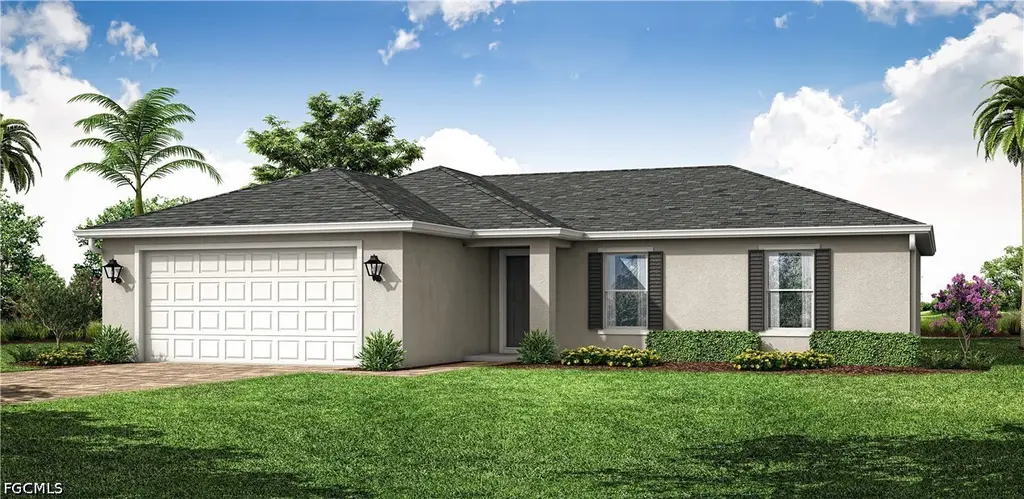
1105 NE 40th Ter · Cape Coral, FL
Flood risk 4/10 · Minor
- FEMA flood zone
- X (unshaded)
- Chance of flooding over 30 yrs
- 0.22%
- Est. flood insurance / yr
- $507 – $1,088
Fire risk 7/10 · Major
- Est. fire insurance / yr
- $947 – $1,759
Heat risk 10/10 · Severe
- Hot days now (above 107°F)
- 7 days/yr
- Hot days in 30 yrs
- 30 days/yr
Wind risk 10/10 · Severe
- Chance of severe wind over 30 yrs
- 99.0%
Air-quality risk 2/10 · Minimal
- Unhealthy air days now
- 1 days/yr
- Unhealthy air days in 30 yrs
- 1 days/yr
Risk factors via First Street. Map © Google.
Why this score? — see what drove the D- grade
The composite is a weighted blend of 9 inputs, each scored 0–100. Each bar is that input's sub-score; the figure is the points it added to the 100-point composite (weight × sub-score).
- Cash flow +11.6/30.0
- ARV discount +7.5/15.0
- Schools +4.1/10.0
- Livability +3.9/5.0
- DSCR +3.4/10.0
- Condition / age +2.5/5.0
- 1% rule +2.1/10.0
- Rent growth +1.1/5.0
- Appreciation +0.0/10.0
$317,990
🖨 Deal sheet 📄 Offer letter ✓ Due diligence
Listing remarks MLS
Great Location in cape Coral to Build Your Dream Home. Oversized Corner Lot with NW Exposure. Many New homes being built in the area. Close to schools, shopping, restaurants, entertainment, and has easy access to major roads.
Key facts
- 0.25 acre lot
- 2 garage spots
- Built 2026
Property features AI
Finance
- Financial info: Pets allowed
- HOA & community: No association fee
Exterior
- Parking: Attached garage; 2 covered garage spaces; Garage door opener
- Security: High impact doors
- Utilities: Well water; Septic tank; Cable available
- Home design: Single-story; Entry level: 1; Faces southeast; Under construction
- Construction: Block, concrete and stucco construction; Shingle roof
- Exterior features: Open porch; Security/high impact doors; Corner lot; Northwest exposure
Interior
- Kitchen: Dishwasher; Range; Microwave; Refrigerator
- Bedrooms: Unfurnished
- Flooring: Carpet; Tile
- Bathrooms: 2 full bathrooms
- Heating & cooling: Central heating (electric); Central air (electric)
- Interior features: High ceilings; Family/Dining room; Living/Dining room; Pantry; Cable TV; Walk-in closet(s); Split bedrooms
- Laundry & utility: Washer; Dryer; Inside laundry
Neighborhood map
What this means for you Summary
Snapshot
- This is a 4-bed/2.0-bath land listed at $318k.
Deal economics
- At list price, monthly cash flow is $-100 ($-1k/yr) — negative.
- To cash-flow at today's rent, offer at most $300k (5.6% below list).
- To meet the 1% rule (rent ≥ 1% of price), the offer needs to be $225k (29.4% below list).
- Recommended offer: $225k (29.4% below list) — sets the bar for 1% rule.
- Cap rate 5.9% vs local median 3.1% in Cape Coral — top-decile yield for the area; either an underpriced asset or a hidden risk that comps aren't pricing in. Stress-test before assuming the spread holds.
Location & tenants
- Location reads 77/100 on livability (#208 in FL, #3,098 nationally) — a middle-class / working-renter tenant base. Strengths: housing A+, health & safety A+, amenities B+; Watch: commute F.
- Lee (suburban): math 47% / reading 50% proficiency, ranked #42 of 73 in FL (top 58%) — families likely to look elsewhere, expect single-tenant / working-renter base with shorter leases.
- Market conditions: Rents falling (-5.6%/yr); 1597 active listings in the ZIP; 34 comparable units currently listed for rent nearby; rentals at typical pace (median 21d on market — plan ~3-4 weeks tenant-placement turnaround); 15,411 units permitted in Lee County in 2024 (4,686 in 5+ unit buildings).
- This rent runs 37% of the median local income ($73k/yr) — at the standard rent-burdened threshold; future hikes will face affordability resistance.
Forward outlook
- Local home prices are declining (-3.0%/yr); year-one equity from $2k of loan paydown is wiped out by about $10k of value loss. Plan a longer hold.
- Lee County population projected at +44% by 2050 — long-run rental-demand tailwind backs the buy-and-hold thesis.
Negotiation context
- It's been on market 37 days — a 3% lower offer ($308k) is reasonable based on typical stale-listing flexibility.
- 4 sale attempts since 16y ago with the ask held roughly flat each time — persistent listings suggest the price (not the market) is what's stuck; bring a comps-based counter.
- Current owner paid $35k; list at $318k implies a 809% gain — meaningful room to come down on a strong offer.
Risks & watch-outs
- Climate carrying-cost: severe wind risk, 99% chance of damaging wind over 30y; major wildfire risk; extreme-heat days projected 7→30/yr by 2055 (HVAC capex compounding) — expect insurance premiums to compound above CPI over the hold.
Questions for the listing agent
- What do current leases actually rent for vs. the listed asking? Can we see a recent rent roll and the last 12 months of T-12 income?
- It's been on market 37 days. Have you received any prior offers? Is the seller open to a 29% concession, seller financing, or rate buy-down credit?
- Is there a deadline driving the sale (1031 exchange, divorce, estate, relocation)? That informs how much negotiation room exists.
- Schools are B-rated — typically a magnet for longer-tenancy family renters. What's the average tenant stay here, and is there a school-zone premium baked into asking?
- The area grade is low — what's the realistic commute time and amenity access for the typical tenant pool here? Any planned neighborhood developments (good or bad) we should know about?
- What's the average days-on-market for RENTAL listings here right now (not sales)? A rising rental-DOM trend means longer vacancies and softer asking-rent achievability than the comps imply.
- What's the recent tenant-quality profile in this submarket — average credit score on applications, eviction rate, late-payment / NSF rate, and stable-employment percentage? A property-management company in the area should have these aggregated.
- How much new for-sale + rental construction is in the pipeline within 1–3 miles? Heavy new supply typically softens prices + rents 12–24 months out; constrained supply supports both.
Investment metrics
- 1% rule
- 0.71% ✗
- Cap rate
- 5.91%
- Cash-on-cash
- -1.35%
- DSCR
- 0.94
- GRM
- 11.8
CMA / ARV
No comps found within radius.
Projected returns pro-forma
-3.0% appreciation · 0.0% rent growth · sell at horizon
- IRR
- -21.5%
- Equity multiple
- 0.27×
- Total profit
- $-64,660
- Equity at exit
- $47,413
- IRR
- -22.7%
- Equity multiple
- -0.02×
- Total profit
- $-90,630
- Equity at exit
- $27,494
Cash invested: $89,037 (down + closing). Projections, not guarantees.
Landlord ↔ Tenant lean methodology
- Overall (STATE)
- 87 Strongly Landlord-Friendly
- State Florida
- 87 Strongly Landlord-Friendly · R+3
- County
- — inherits STATE
- City
- — inherits STATE
ZIP-level market 33909
- Home prices YoY
- -23.1%
- Rents YoY
- -5.6%
- Active inventory
- 1597
- Price-to-rent
- 11.8×
Monthly cashflow live
- Estimated rent
- $2,246 high interval (Pro) →
- Mortgage (P&I)
- −$1,668
- Tax from tax record
- −$74 /mo · $892/yr
- Insurance
- −$132
- HOA
- −$0
- Vacancy / Maint / Mgmt
- −$472
- Net cashflow
- $-100
Break-even live
UW: 25.0% down · 7.5% · 30yr · 1.5% tax · 5.0% vac · 8.0% maint · 8.0% mgmt
Financing live
Cash to close
- Down payment
- $79,498
- Closing costs
- $9,540
- Reserves months
- —
- Total cash needed
- —
Loan-product check · same deal, 3 products live
Conventional
25% down · 7.5% · 30yr
- Down + closing
- —
- Monthly P&I
- —
- Monthly cashflow
- —
- DSCR
- —
- Eligible?
- —
Personal DTI + credit; lowest rate.
DSCR
20% down · 8.5% · 30yr
- Down + closing
- —
- Monthly P&I
- —
- Monthly cashflow
- —
- DSCR
- —
- Eligible?
- —
No personal income docs; deal must DSCR.
Hard money
10% down · 12.0% · 12mo
- Down + closing
- —
- Monthly P&I
- —
- Monthly cashflow
- —
- DSCR
- —
- Eligible?
- —
Short-term bridge; refi at stabilization.
Rent comps 34 comps
| Address | Beds | Baths | Sqft | Rent | $/sqft | DOM | Units | Dist |
|---|---|---|---|---|---|---|---|---|
| 4028 NE 10th Pl Cape Coral, FL | 3.0 | 2.0 | 1850 | $2,146 | $1.16 | 3d | 1 | 0.21mi |
| 4109 NE 9th Pl Cape Coral, FL | 3.0 | 2.0 | 1690 | $1,835 | $1.09 | 3d | 1 | 0.31mi |
| 3732 NE 12th Pl Cape Coral, FL | 3.0 | 2.0 | 1408 | $1,950 | $1.38 | 23d | 1 | 0.34mi |
| 4000 NE 9th Ave Cape Coral, FL | 4.0 | 2.0 | 2143 | $2,500 | $1.17 | 1d | 1 | 0.41mi |
| 3717 NE 13th Ave Cape Coral, FL | 3.0 | 2.0 | 1408 | $1,795 | $1.27 | 16d | 1 | 0.43mi |
| 3804 NE 9th Pl Cape Coral, FL | 4.0 | 3.0 | 1683 | $1,995 | $1.19 | 14d | 1 | 0.44mi |
| 4125 NE 15th Pl Cape Coral, FL | 3.0 | 2.0 | 1556 | $2,000 | $1.29 | 23d | 1 | 0.52mi |
| 1518 NE 43rd Ln Cape Coral, FL | 4.0 | 2.0 | 1756 | $2,200 | $1.25 | 16d | 1 | 0.59mi |
| 3928 NE 17th Ave Cape Coral, FL | 4.0 | 3.0 | 1683 | $2,100 | $1.25 | 23d | 1 | 0.60mi |
| 3924 NE 17th Ave Cape Coral, FL | 4.0 | 2.0 | 1941 | $2,500 | $1.29 | 23d | 1 | 0.62mi |
| 3924 NE 17th Ave Cape Coral, FL | 4.0 | 2.0 | 1941 | $2,500 | $1.29 | 21d | 1 | 0.62mi |
| 3610 NE 9th Pl Cape Coral, FL | 4.0 | 2.0 | 1774 | $1,995 | $1.12 | 14d | 1 | 0.70mi |
| 3620 NE 9th Ave Cape Coral, FL | 3.0 | 2.0 | 1969 | $2,085 | $1.06 | 19d | 1 | 0.70mi |
| 4421 NE 15th Pl Cape Coral, FL | 3.0 | 2.0 | 1240 | $2,000 | $1.61 | 23d | 1 | 0.71mi |
| 1701 NE 44th Ter Cape Coral, FL | 3.0 | 2.0 | 1147 | $1,800 | $1.57 | 14d | 1 | 0.79mi |
| 1701 NE 44th Ter Cape Coral, FL | 3.0 | 2.0 | 1147 | $1,800 | $1.57 | 16d | 1 | 0.79mi |
| 3462 NE 10th Pl Cape Coral, FL | 4.0 | 3.0 | 1665 | $3,000 | $1.80 | 23d | 1 | 0.80mi |
| 4141 NE 19th Pl Cape Coral, FL | 4.0 | 2.0 | 1734 | $1,995 | $1.15 | 14d | 1 | 0.81mi |
| 4215 E Gator Cir Cape Coral, FL | 3.0 | 2.0 | 1385 | $1,725 | $1.25 | 3d | 1 | 0.85mi |
| 3445 NE 8th Pl Cape Coral, FL | 4.0 | 2.0 | 1734 | $2,200 | $1.27 | 23d | 1 | 0.93mi |
| 4309 NE 20th Ct Cape Coral, FL | 4.0 | 2.0 | 1774 | $2,000 | $1.13 | 21d | 1 | 0.95mi |
| 1532 NE 35th St Cape Coral, FL | 4.0 | 2.0 | 1809 | $1,995 | $1.10 | 23d | 1 | 0.98mi |
| 3925 E Gator Cir Cape Coral, FL | 4.0 | 2.0 | 2196 | $2,200 | $1.00 | 21d | 1 | 1.00mi |
| 3511 NE 17th Ave Cape Coral, FL | 4.0 | 2.0 | 1717 | $2,350 | $1.37 | 19d | 1 | 1.01mi |
| 3622 NE 19th Ave Cape Coral, FL | 3.0 | 2.0 | 1286 | $2,480 | $1.93 | 23d | 1 | 1.03mi |
| 3512 NE 17th Pl Cape Coral, FL | 4.0 | 3.0 | 1650 | $1,995 | $1.21 | 3d | 1 | 1.03mi |
| 1015 NE 34th St Cape Coral, FL | 4.0 | 2.0 | 1760 | $2,300 | $1.31 | 23d | 1 | 1.04mi |
| 3603 NE 19th Ave Cape Coral, FL | 3.0 | 2.0 | 1147 | $1,750 | $1.53 | 3d | 1 | 1.10mi |
| 2117 NE 40th St Cape Coral, FL | 3.0 | 3.0 | 1776 | $2,100 | $1.18 | 16d | 1 | 1.13mi |
| 3527 NE 19th Pl Cape Coral, FL | 3.0 | 2.0 | 1574 | $2,000 | $1.27 | 23d | 1 | 1.15mi |
| 3223 NE 14th Ave Cape Coral, FL | 4.0 | 3.0 | 1765 | $2,200 | $1.25 | 23d | 1 | 1.32mi |
| 4213 Garden Blvd Cape Coral, FL | 4.0 | 2.0 | 2143 | $2,375 | $1.11 | 23d | 1 | 1.46mi |
| 4020 Garden Blvd Cape Coral, FL | 4.0 | 2.0 | 1650 | $1,845 | $1.12 | 21d | 1 | 1.47mi |
| 921 Jacaranda Pkwy E Cape Coral, FL | 4.0 | 3.0 | 2081 | $2,099 | $1.01 | 23d | 1 | 1.47mi |
Listing history 13 events
-
2026-05-20status Pending
-
2026-05-13price $317,990
-
2026-05-06price $319,990
-
2026-04-13$324,990 Active
-
2025-12-03soldstatus $35,000
-
2020-12-30soldstatus $8,000
-
2018-04-25soldstatus $9,000
-
2018-04-06soldstatus $9,000 Sold 225-char remark
Show marketing remark (225 chars)
Great Location in cape Coral to Build Your Dream Home. Oversized Corner Lot with NW Exposure. Many New homes being built in the area. Close to schools, shopping, restaurants, entertainment, and has easy access to major roads.
-
2018-03-12status Pending 225-char remark
Show marketing remark (225 chars)
Great Location in cape Coral to Build Your Dream Home. Oversized Corner Lot with NW Exposure. Many New homes being built in the area. Close to schools, shopping, restaurants, entertainment, and has easy access to major roads.
-
2018-03-06$9,000 Active 225-char remark
Show marketing remark (225 chars)
Great Location in cape Coral to Build Your Dream Home. Oversized Corner Lot with NW Exposure. Many New homes being built in the area. Close to schools, shopping, restaurants, entertainment, and has easy access to major roads.
-
2016-05-21historical
-
2015-07-15$16,000
-
2010-07-02$9,500
ⓘ Source: listings_history table (triggers on properties + properties_extension) + one-shot
backfill from property_details.listing_events for pre-trigger history.
Tax reassessment forecast FL · Resets to sale price
- Current annual tax
- $892 · $74/mo
- Projected year-2 tax
- $2,639 · $220/mo
- Expected delta
- +$1,747/yr (+$146/mo · 195.8%)
ⓘ Screening estimate from a state-policy table — verify with the county assessor before closing.
Climate risk First Street
- Flood 4/10 Moderate FEMA zone X (unshaded) · 22% chance over 30 yrs
- Wildfire 7/10 Severe
- Heat 10/10 Extreme 7 d/yr ≥107°F today · 30 d/yr by 30 yrs out
- Wind 10/10 Extreme 99% chance of damaging wind over 30 yrs
- Air quality 2/10 Low 1 unhealthy d/yr today · 1 by 30 yrs out
Nearby sold comps map
Loading sold comps map…
Walkable amenities ~0.75 mi
Loading nearby amenities…
Taxation est. · year 1
- Rental income
- $26,949
- − Mortgage interest
- −$17,812
- − Property taxes
- −$892
- − Insurance
- −$1,590
- − Repairs & maintenance
- −$2,156
- − Management
- −$2,156
- − Depreciation
- −$9,251
- Taxable loss
- −$6,908
- Est. tax savings @ 24.0%
- +$1,658
- After-tax cash flow
- $455/yr
For passive investors: Depreciation is non-cash, so a rental often shows a tax loss while cash-flowing — sheltering income. Rental losses are passive: they offset passive income freely, and up to $25,000/yr can offset ordinary (W-2) income if you actively participate and your MAGI is under $100k (phasing out to $0 by $150k); unused losses carry forward. On sale, claimed depreciation is recaptured at up to 25%, and gains may owe capital-gains tax (a 1031 exchange can defer both). Figures are a year-1 estimate at your 24.0% rate — not tax advice; consult a CPA.
Schools (NCES district)
- District
- Lee
- NCES district ID
- 1201080
- Math proficiency
- 47% ▼ -11.00%
- Reading proficiency
- 50% ▼ -4.00%
- Median HH income
- $49,518
- Composite
- 41.49/100
- National rank
- #3458
- State rank
- #42 of 73 in FL
Livability — Cape Coral
- Score
- 77/100
- State rank
- #208
- US rank
- #3098
Category grades
Schools grade is shown separately in the Schools card above.
Census & demographics
- Census place
- Cape Coral, FL
- County
- Lee County · 788,662 people
- City population
- 217,388
- Metro
- Cape Coral-Fort Myers, FL
- Population (ZIP)
- 40,231
- Household income
- $73,053
- Rent vs Own
- Severe rent burden
- 1657.0
Population outlook (Lee County) Hauer SSP2
- Today (2025)
- 871,946 people
- By 2030
- 955,468 · +9.6%
- By 2040
- 1,113,587 · +27.7%
- By 2050
- 1,256,891 · +44.1%
- By 2075
- 1,560,270 · +78.9%
- By 2100
- 1,726,848 · +98.0%
Race, ethnicity, and origin ACS 2023
- Neighborhood character
- Diverse neighborhood (Simpson 0.55)
- Race & ethnicity
- White 56% Hispanic / Latino 36% Two or more races 24% Black 3% Asian 1%
- Hispanic origin (detail)
- Puerto Rican 7% Cuban 14% Dominican 4%
- Common ancestry
- Romanian 2% Lithuanian 2% Serbian 1%
- Foreign-born
- 20% · Canada, Jamaica
- Languages at home
- 69% English-only · Spanish 27% Other Indo-European 1% German/W. Germanic 1%
Political lean MEDSL · Lee
- 2024 margin
- Strong R (+28.4) · D 35.5% · R 63.9%
- 2008→2024 swing
- -18.0pp toward R · 2008: -10.4pp · 2024: -28.4pp
- All cycles
- 2024: R+28.4 2020: R+19.2 2016: R+20.4 2012: R+16.6 2008: R+10.4
Not yet ingested
- Civics
- —
Market trends
- HPI YoY
- ▼ -94.24%
- Current HPI
- 313.8761
- Rent YoY
- ▼ -5.60%
- Metro
- Cape Coral-Fort Myers, FL
- State GDP YoY
- ▲ 3.28%
- F500 in state
- 36
Industry mix (Fortune 500 HQ in FL)
| Industry | F500 HQs | Revenue |
|---|---|---|
| Industrial Technology | 2 | $29B |
|
||
| Insurance | 2 | $17B |
|
||
| Retail | 1 | $60B |
|
||
| Technology Distribution | 1 | $58B |
|
||
| Homebuilding | 1 | $35B |
|
||
| Technology Manufacturing | 1 | $35B |
|
||
Price history
+3247.3% since first listed13 events — show timeline
- 2026-05-20 Pending — FORTMLS
- 2026-05-13 Price Changed $317,990 FORTMLS
- 2026-05-06 Price Changed $319,990 FORTMLS
- 2026-04-13 Listed $324,990 FORTMLS
- 2025-12-03 Sold (Public Records) $35,000 Public Records
- 2020-12-30 Sold (Public Records) $8,000 Public Records
- 2018-04-25 Sold (Public Records) $9,000 Public Records
- 2018-04-06 Sold (MLS) $9,000 FORTMLS
- 2018-03-12 Pending — FORTMLS
- 2018-03-06 Listed $9,000 FORTMLS
- 2016-05-21 Listing Removed — Stellar MLS as Distributed by MLS Grid
- 2015-07-15 Listed $16,000 Stellar MLS as Distributed by MLS Grid
- 2010-07-02 Listed $9,500 NAPLESMLS
Property tax history
+10.9%/yrLatest (2025): $892 · +12.6% YoY. Source: county tax records.
Cash-flow waterfall
monthlySold comps — $/sqft
last 12 mo · ≤1 miLoading sold comps…