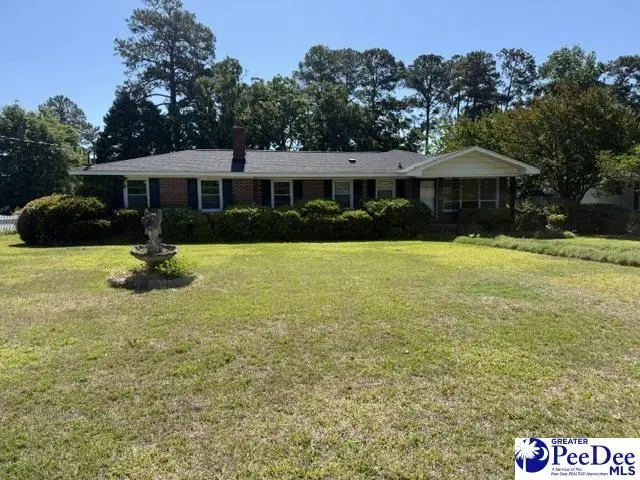
2200 Rosemary Ave · Florence, SC
Flood risk 1/10 · Minimal
- FEMA flood zone
- X (unshaded)
- Chance of flooding over 30 yrs
- 0.0%
- Est. flood insurance / yr
- $507 – $1,088
Fire risk 5/10 · Moderate
- Est. fire insurance / yr
- $783 – $1,453
Heat risk 7/10 · Major
- Hot days now (above 108°F)
- 7 days/yr
- Hot days in 30 yrs
- 16 days/yr
Wind risk 8/10 · Major
- Chance of severe wind over 30 yrs
- 80.0%
Air-quality risk 1/10 · Minimal
- Unhealthy air days now
- 0 days/yr
- Unhealthy air days in 30 yrs
- 0 days/yr
Risk factors via First Street. Map © Google.
Why this score? — see what drove the C- grade
The composite is a weighted blend of 9 inputs, each scored 0–100. Each bar is that input's sub-score; the figure is the points it added to the 100-point composite (weight × sub-score).
- Cash flow +21.1/30.0
- ARV discount +9.2/15.0
- DSCR +6.7/10.0
- 1% rule +4.2/10.0
- Rent growth +4.2/5.0
- Schools +3.2/10.0
- Livability +3.1/5.0
- Condition / age +2.5/5.0
- Appreciation +0.0/10.0
$189,000
🖨 Deal sheet 📄 Offer letter ✓ Due diligence
Listing remarks
Welcome to 2200 Rosemary Avenue, nestled in the established and family friendly Pine Forest subdivision on the south side of Florence. This charming corner lot home offers tremendous potential for the right buyer. The solid structure provides an excellent foundation for updates and personalization. A standout feature is the salon space on the back of the property, perfect for a home office, creative studio, or home based business, with the option to add interior access through the main house. The fully wired and plumbed workshop in the back is ideal for hobbyists, craftspeople, or small business operations and could even be finished out as an accessory dwelling unit or separate in law suite
Key facts
- 0.46 acre lot
- 2 garage spots
- Built 1962
Property features AI
Finance
- Other: Located in Pine Forest subdivision
Exterior
- Parking: Attached 2-car garage
- Utilities: Public water; Public sewer
- Home design: Single family residence; Residential property; Brick veneer construction; Shingle roof
- Construction: Brick veneer
- Exterior features: Corner lot; Workshop (other structure)
Interior
- Kitchen: Dishwasher; Microwave; Oven
- Flooring: Carpet; Tile; Vinyl; Wood / Hardwood
- Bathrooms: 2 full bathrooms; 1 half bathroom
- Heating & cooling: Central heating; Central air; Ceiling fans
- Interior features: Insulated windows; Fireplace (1); Storage; Porch; Crawl space basement
Neighborhood map
What this means for you Summary
Snapshot
- This is a 3-bed/2.0-bath single-family listed at $189k.
Deal economics
- At list price, monthly cash flow is $270 ($3k/yr) — positive.
- The deal already cash-flows at list — no discount required.
- To meet the 1% rule (rent ≥ 1% of price), the offer needs to be $175k (7.6% below list).
- Recommended offer: $175k (7.6% below list) — sets the bar for 1% rule.
- Cap rate 8.0% vs local median 3.5% in Florence — top-decile yield for the area; either an underpriced asset or a hidden risk that comps aren't pricing in. Stress-test before assuming the spread holds.
Location & tenants
- Location reads 62/100 on livability (#196 in SC) — a middle-class / working-renter tenant base. Strengths: cost of living A+, housing A+, health & safety B+; Watch: employment C-, crime F, amenities F.
- Florence 01 (urban): math 29% / reading 47% proficiency, ranked #34 of 80 in SC (top 42%) — families likely to look elsewhere, expect single-tenant / working-renter base with shorter leases.
- Zoned schools: Greenwood Elementary (math 25% / reading 35%, grade F, #394 of 597 statewide, top 66%, 542 students, 100% FRL); Southside Middle (math 18% / reading 38%, grade F, #146 of 229 statewide, top 64%, 1,100 students, 100% FRL); South Florence High (math 58% / reading 86%, grade B+, #48 of 196 statewide, top 26%, 1,643 students, 77% FRL) — zoned schools average 92% FRL vs 57% district-wide (35 pts higher); higher-poverty schools than district average — tighter screening recommended.
- Market conditions: Rents rising fast (+7.0%/yr); 183 active listings in the ZIP; 657 units permitted in Florence County in 2024 (40 in 5+ unit buildings).
- This rent runs 31% of the median local income ($67k/yr) — at the standard rent-burdened threshold; future hikes will face affordability resistance.
Forward outlook
- Local home prices are declining (-3.0%/yr); year-one equity from $1k of loan paydown is wiped out by about $6k of value loss. Plan a longer hold.
- At projected returns (-3.0% appreciation + 7.0% rent growth), your $53k cash investment doubles in ~10 years — after that, you're playing with house money.
Negotiation context
- It's been on market 46 days — a 3% lower offer ($183k) is reasonable based on typical stale-listing flexibility.
Risks & watch-outs
- Climate carrying-cost: severe wind risk, 80% chance of damaging wind over 30y; moderate wildfire risk; extreme-heat days projected 7→16/yr by 2055 (HVAC capex compounding) — expect insurance premiums to compound above CPI over the hold.
Questions for the listing agent
- It's been on market 46 days. Have you received any prior offers? Is the seller open to a 8% concession, seller financing, or rate buy-down credit?
- Built in 1962 — when were the roof, HVAC, electrical panel, plumbing, and water heater last replaced?
- Is there a deadline driving the sale (1031 exchange, divorce, estate, relocation)? That informs how much negotiation room exists.
- Crime grade is F in this area — have there been break-ins, vandalism, or insurance claims at this property in the last 3 years? What carrier currently insures it and at what premium?
- What's the average days-on-market for RENTAL listings here right now (not sales)? A rising rental-DOM trend means longer vacancies and softer asking-rent achievability than the comps imply.
- What's the recent tenant-quality profile in this submarket — average credit score on applications, eviction rate, late-payment / NSF rate, and stable-employment percentage? A property-management company in the area should have these aggregated.
- How much new for-sale + rental construction is in the pipeline within 1–3 miles? Heavy new supply typically softens prices + rents 12–24 months out; constrained supply supports both.
Investment metrics
- 1% rule
- 0.92% ✗
- Cap rate
- 8.00%
- Cash-on-cash
- 6.11%
- DSCR
- 1.27
- GRM
- 9.0
CMA / ARV
- ARV (on-the-fly)
- $196,224
- Comps found
- 9
Show comp detail 9 sales within ~0.75 mi
| Address | Dist | Beds/Ba | Sqft | Sold | Price | $/sf | Match |
|---|---|---|---|---|---|---|---|
| 1106 Beauvoir Dr | 0.32mi | 3/2.0 | 1,282 (-5%) | 14mo | $163,000 | $127 | 65 |
| 1006 Hannah Dr | 0.35mi | 3/2.0 | 1,332 (-1%) | 23mo | $213,000 | $160 | 63 |
| 1205 S Riverdale Ave | 0.37mi | 3/1.0 | 1,242 (-8%) | 4mo | $182,000 | $147 | 63 |
| 2208 S Robeson Ave | 0.09mi | 3/3.5 | 1,196 (-11%) | 11mo | $175,000 | $146 | 62 |
| 2229 Pine Forest Dr | 0.21mi | 3/1.5 | 1,264 (-6%) | 20mo | $157,500 | $125 | 62 |
| 1509 E Mcelveen Ter | 0.69mi | 3/2.0 | 1,320 (-2%) | 14mo | $179,210 | $136 | 54 |
| 2600 Hardin St | 0.57mi | 3/2.0 | 1,406 (+5%) | 15mo | $205,000 | $146 | 53 |
| 2500 Broad Dr | 0.56mi | 3/2.0 | 1,200 (-11%) | 18mo | $200,000 | $167 | 41 |
| 1172 Hannah Dr | 0.49mi | 3/2.0 | 1,528 (+14%) | 19mo | $233,000 | $152 | 38 |
Match score weights: distance 35% · size 25% · config 20% · recency 20%. Top-matched comps best support the ARV.
Projected returns pro-forma
-3.0% appreciation · 6.97% rent growth · sell at horizon
- IRR
- -3.1%
- Equity multiple
- 0.88×
- Total profit
- $-6,295
- Equity at exit
- $28,181
- IRR
- 10.2%
- Equity multiple
- 1.92×
- Total profit
- $48,563
- Equity at exit
- $16,341
Cash invested: $52,920 (down + closing). Projections, not guarantees.
Landlord ↔ Tenant lean methodology
- Overall (STATE)
- 90 Strongly Landlord-Friendly
- State South Carolina
- 90 Strongly Landlord-Friendly · R+6
- County
- — inherits STATE
- City
- — inherits STATE
ZIP-level market 29505
- Rents YoY
- 7.0%
- Active inventory
- 183
- Price-to-rent
- 9.0×
Monthly cashflow live
- Estimated rent
- $1,747 medium interval (Pro) →
- Mortgage (P&I)
- −$991
- Tax from tax record
- −$41 /mo · $489/yr
- Insurance
- −$79
- HOA
- −$0
- Vacancy / Maint / Mgmt
- −$367
- Net cashflow
- $270
Break-even live
UW: 25.0% down · 7.5% · 30yr · 1.5% tax · 5.0% vac · 8.0% maint · 8.0% mgmt
Financing live
Cash to close
- Down payment
- $47,250
- Closing costs
- $5,670
- Reserves months
- —
- Total cash needed
- —
Loan-product check · same deal, 3 products live
Conventional
25% down · 7.5% · 30yr
- Down + closing
- —
- Monthly P&I
- —
- Monthly cashflow
- —
- DSCR
- —
- Eligible?
- —
Personal DTI + credit; lowest rate.
DSCR
20% down · 8.5% · 30yr
- Down + closing
- —
- Monthly P&I
- —
- Monthly cashflow
- —
- DSCR
- —
- Eligible?
- —
No personal income docs; deal must DSCR.
Hard money
10% down · 12.0% · 12mo
- Down + closing
- —
- Monthly P&I
- —
- Monthly cashflow
- —
- DSCR
- —
- Eligible?
- —
Short-term bridge; refi at stabilization.
Listing history 17 events
-
2026-06-19days on market $189,000 Active 46 DOM
-
2026-06-18days on market $189,000 Active 45 DOM
-
2026-06-17days on market $189,000 Active 44 DOM
-
2026-06-16days on market $189,000 Active 43 DOM
-
2026-06-15days on market $189,000 Active 42 DOM
-
2026-06-14days on market $189,000 Active 40 DOM
-
2026-06-13days on market $189,000 Active 39 DOM
-
2026-06-10days on market $189,000 Active 37 DOM
-
2026-06-09days on market $189,000 Active 36 DOM
-
2026-06-08days on market $189,000 Active 35 DOM
-
2026-06-07days on market $189,000 Active 34 DOM
-
2026-06-05days on market $189,000 Active 31 DOM
-
2026-06-02days on market $189,000 Active 29 DOM
-
2026-06-01days on market $189,000 Active 28 DOM
-
2026-05-31days on market $189,000 Active 27 DOM
-
2026-05-30days on market $189,000 Active 26 DOM
-
2026-05-04$189,000 Active
ⓘ Source: listings_history table (triggers on properties + properties_extension) + one-shot
backfill from property_details.listing_events for pre-trigger history.
Tax reassessment forecast SC · Resets to sale price
- Current annual tax
- $489 · $41/mo
- Projected year-2 tax
- $1,077 · $90/mo
- Expected delta
- +$588/yr (+$49/mo · 120.4%)
ⓘ Screening estimate from a state-policy table — verify with the county assessor before closing.
Climate risk First Street
- Flood 1/10 Low FEMA zone X (unshaded) · 0% chance over 30 yrs
- Wildfire 5/10 Major
- Heat 7/10 Severe 7 d/yr ≥108°F today · 16 d/yr by 30 yrs out
- Wind 8/10 Severe 80% chance of damaging wind over 30 yrs
- Air quality 1/10 Low 0 unhealthy d/yr today · 0 by 30 yrs out
Nearby sold comps map
Loading sold comps map…
Walkable amenities ~0.75 mi
Loading nearby amenities…
Taxation est. · year 1
- Rental income
- $20,965
- − Mortgage interest
- −$10,587
- − Property taxes
- −$489
- − Insurance
- −$945
- − Repairs & maintenance
- −$1,677
- − Management
- −$1,677
- − Depreciation
- −$5,498
- Taxable income
- $91
- Est. tax owed @ 24.0%
- −$22
- After-tax cash flow
- $3,213/yr
For passive investors: Depreciation is non-cash, so a rental often shows a tax loss while cash-flowing — sheltering income. Rental losses are passive: they offset passive income freely, and up to $25,000/yr can offset ordinary (W-2) income if you actively participate and your MAGI is under $100k (phasing out to $0 by $150k); unused losses carry forward. On sale, claimed depreciation is recaptured at up to 25%, and gains may owe capital-gains tax (a 1031 exchange can defer both). Figures are a year-1 estimate at your 24.0% rate — not tax advice; consult a CPA.
Schools (NCES district)
- District
- Florence 01
- NCES district ID
- 4502130
- Math proficiency
- 29% ▼ -10.00%
- Reading proficiency
- 47% ▬ 0.00%
- Median HH income
- $45,782
- Composite
- 32.36/100
- National rank
- #5737
- State rank
- #34 of 80 in SC
Livability — Florence
- Score
- 62/100
- State rank
- #196
- US rank
- #17076
Category grades
Schools grade is shown separately in the Schools card above.
Census & demographics
- County
- Florence County · 93,345 people
- City population
- 93,345
- Metro
- Florence, SC
- Population (ZIP)
- 23,895
- Household income
- $67,343
- Rent vs Own
- Severe rent burden
- 559.0
Population outlook (Florence County) Hauer SSP2
- Today (2025)
- 141,714 people
- By 2030
- 142,121 · +0.3%
- By 2040
- 141,344 · -0.3%
- By 2050
- 139,478 · -1.6%
- By 2075
- 132,275 · -6.7%
- By 2100
- 118,374 · -16.5%
Race, ethnicity, and origin ACS 2023
- Neighborhood character
- Diverse neighborhood (Simpson 0.57)
- Race & ethnicity
- White 53% Black 38% Hispanic / Latino 5% Two or more races 3% Asian 1%
- Common ancestry
- Slovak 2% Lithuanian 1% Serbian 1%
- Foreign-born
- 3% · Canada, China
- Languages at home
- 96% English-only · Spanish 2% Other Indo-European 1%
Political lean MEDSL · Florence
- 2024 margin
- Lean R (+8.0) · D 45.3% · R 53.3% · Other 1.3%
- 2008→2024 swing
- -4.8pp toward R · 2008: -3.2pp · 2024: -8.0pp
- All cycles
- 2024: R+8.0 2020: R+2.3 2016: R+5.0 2012: R+0.5 2008: R+3.2
Not yet ingested
- Civics
- —
Market trends
- HPI YoY
- ▼ -138.13%
- Current HPI
- 177.9352
- Rent YoY
- ▲ 6.97%
- Metro
- Florence, SC
- State GDP YoY
- ▲ 4.51%
- F500 in state
- 2
Industry mix (Fortune 500 HQ in SC)
| Industry | F500 HQs | Revenue |
|---|---|---|
| Packaging | 1 | $7B |
|
||
Price history
1 event — show timeline
- 2026-05-04 Listed $189,000 RAGPD
Property tax history
+7.0%/yrLatest (2025): $489 · +6.9% YoY. Source: county tax records.
Cash-flow waterfall
monthlySold comps — $/sqft
last 12 mo · ≤1 miLoading sold comps…