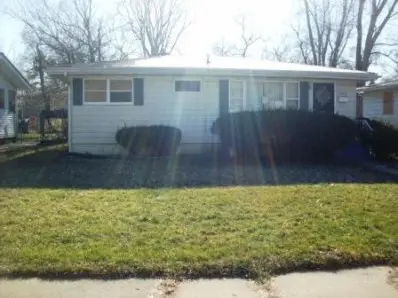
1249 E 36th Ave · Gary, IN
Flood risk 1/10 · Minimal
- FEMA flood zone
- X (unshaded)
- Chance of flooding over 30 yrs
- 0.0%
- Est. flood insurance / yr
- $473 – $860
Fire risk 3/10 · Minor
- Est. fire insurance / yr
- $717 – $1,331
Heat risk 2/10 · Minimal
- Hot days now (above 102°F)
- 7 days/yr
- Hot days in 30 yrs
- 15 days/yr
Wind risk 2/10 · Minimal
- Chance of severe wind over 30 yrs
- —
Air-quality risk 4/10 · Minor
- Unhealthy air days now
- 6 days/yr
- Unhealthy air days in 30 yrs
- 7 days/yr
Risk factors via First Street. Map © Google.
Why this score? — see what drove the B+ grade
The composite is a weighted blend of 9 inputs, each scored 0–100. Each bar is that input's sub-score; the figure is the points it added to the 100-point composite (weight × sub-score).
- Cash flow +30.0/30.0
- ARV discount +15.0/15.0
- 1% rule +10.0/10.0
- DSCR +10.0/10.0
- Rent growth +3.7/5.0
- Livability +3.7/5.0
- Appreciation +3.0/10.0
- Condition / age +2.5/5.0
- Schools +0.5/10.0
$53,000
🖨 Deal sheet 📄 Offer letter ✓ Due diligence
Listing remarks MLS
Full basement and room for expansion this ranch needs your final touches on updating but is priced aggressively for a smooth sale and fast transaction. Functional room count and it appears some newer Oak cabinetry and exterior appears solid as well. Calendar Days 0-7: No offers will be considered for the first 7 calendar days a home is listed. Calendar Days 8-12: offers considered on the property ONLY from NSP buyers, municipalities, non-profit organizations and owner-occupants. Calendar Days 13+: offers considered from all buyers. Buyers should obtain a free prequalification letter from Wells Fargo Home Mortgage or an entity which is a joint venture with Wells Fargo Home Mortgage by working directly with a mortgage consultant or going online. Buyers also have the option to provide proof of other credit regarding financing or a NACA Qualification Letter.
Key facts
- Complete renovation
- Blank canvas
- 5,750 sq ft lot
Tags
Property features AI
Finance
- Other: Property occupied by tenant
Exterior
- Utilities: Public water; Public sewer
- Home design: One-story home; Built in 1956
- Construction: Fixer condition
- Exterior features: Neighborhood view
Interior
- Kitchen: No appliances included
- Bedrooms: Primary bedroom; Bedroom 2; Bedroom 3
- Bathrooms: 1 full bathroom
- Heating & cooling: Forced air heating; No cooling
- Interior features: Other interior features; Unfinished basement
- Laundry & utility: No appliances listed
Neighborhood map
What this means for you Summary
Snapshot
- This is a 2-bed/1.0-bath single-family listed at $53k.
Deal economics
- At list price, monthly cash flow is $535 ($6k/yr) — positive.
- The deal already cash-flows at list — no discount required.
- Meets the 1% rule at list price ($1k rent vs $53k).
- Cap rate 18.4% vs local median 9.1% in Gary — top-decile yield for the area; either an underpriced asset or a hidden risk that comps aren't pricing in. Stress-test before assuming the spread holds.
Location & tenants
- Location reads 73/100 on livability (#105 in IN) — a middle-class / working-renter tenant base. Strengths: commute A+, cost of living A+, housing A+; Watch: schools F, crime F, employment F.
- Gary Community School Corporation (urban): math 3% / reading 11% proficiency, ranked #299 of 301 in IN (top 99%) — low school quality limits family demand, transient renter base, plan for 1-2y turnover; 80% free/reduced lunch — lower-income household profile, screen leases tightly.
- Market conditions: Rents rising fast (+4.8%/yr); 75 active listings in the ZIP; 10 comparable units currently listed for rent nearby; rentals leasing fast (median 1d on market — plan ~1-2 weeks tenant-placement turnaround); lower-income renter base — watch delinquency; 1,642 units permitted in Lake County in 2024 (14 in 5+ unit buildings).
- This rent runs 32% of the median local income ($45k/yr) — at the standard rent-burdened threshold; future hikes will face affordability resistance.
Forward outlook
- Local home prices are declining (-3.0%/yr); year-one equity from $366 of loan paydown is wiped out by about $2k of value loss. Plan a longer hold.
- Lake County population projected to shrink 7% by 2050 — rents likely to lag national; underwrite the cash flow, not the appreciation.
- At projected returns (-3.0% appreciation + 4.8% rent growth), your $15k cash investment doubles in ~3 years — after that, you're playing with house money.
Negotiation context
- Only 1 days on market — expect competitive offers; lowballing is unlikely to land.
- 4 sale attempts since 15y ago with the ask held roughly flat each time — persistent listings suggest the price (not the market) is what's stuck; bring a comps-based counter.
- Current owner paid $7k; list at $53k implies a 657% gain — meaningful room to come down on a strong offer.
Risks & watch-outs
- Watch-outs: built in 1956 — expect roof / HVAC / electrical / plumbing capex.
Questions for the listing agent
- Built in 1956 — when were the roof, HVAC, electrical panel, plumbing, and water heater last replaced?
- Is there a deadline driving the sale (1031 exchange, divorce, estate, relocation)? That informs how much negotiation room exists.
- Schools are F-rated, which usually means shorter tenancies and higher turnover. Who's the typical renter profile here, and what's been the actual vacancy rate?
- Crime grade is F in this area — have there been break-ins, vandalism, or insurance claims at this property in the last 3 years? What carrier currently insures it and at what premium?
- What's the average days-on-market for RENTAL listings here right now (not sales)? A rising rental-DOM trend means longer vacancies and softer asking-rent achievability than the comps imply.
- What's the recent tenant-quality profile in this submarket — average credit score on applications, eviction rate, late-payment / NSF rate, and stable-employment percentage? A property-management company in the area should have these aggregated.
- How much new for-sale + rental construction is in the pipeline within 1–3 miles? Heavy new supply typically softens prices + rents 12–24 months out; constrained supply supports both.
Investment metrics
- 1% rule
- 2.23% ✓
- Cap rate
- 18.40%
- Cash-on-cash
- 43.24%
- DSCR
- 2.92
- GRM
- 3.7
CMA / ARV
- ARV (on-the-fly)
- $77,400
- Comps found
- 12
Show comp detail 12 sales within ~0.75 mi
| Address | Dist | Beds/Ba | Sqft | Sold | Price | $/sf | Match |
|---|---|---|---|---|---|---|---|
| 1407 E 36th Ave | 0.07mi | 3/1.0 (+1) | 950 (+6%) | 3mo | $55,100 | $58 | 80 |
| 3820 Swift St | 0.35mi | 2/1.0 | 840 (-7%) | 3mo | $210,000 | $250 | 70 |
| 1015 E 36th Pl | 0.17mi | 2/1.0 | 780 (-13%) | 9mo | $82,000 | $105 | 63 |
| 3326 Delaware St | 0.70mi | 3/1.0 (+1) | 896 (-0%) | 1mo | $77,000 | $86 | 61 |
| 3624 Georgia St | 0.33mi | 3/2.0 (+1) | 954 (+6%) | 7mo | $77,000 | $81 | 60 |
| 3372 Iowa St | 0.74mi | 2/1.0 | 896 (-0%) | 9mo | $119,000 | $133 | 58 |
| 3370 Pennsylvania St | 0.72mi | 2/1.0 | 894 (-1%) | 9mo | $14,900 | $17 | 58 |
| 4055 Kentucky St | 0.57mi | 3/1.0 (+1) | 1,000 (+11%) | 1mo | $50,000 | $50 | 49 |
| 4125 Alabama St | 0.75mi | 3/1.0 (+1) | 925 (+3%) | 9mo | $96,850 | $105 | 48 |
| 3320 Delaware St | 0.70mi | 3/1.0 (+1) | 864 (-4%) | 9mo | $57,000 | $66 | 48 |
| 4069 W 39th Ave | 0.74mi | 3/1.0 (+1) | 925 (+3%) | 9mo | $195,000 | $211 | 48 |
| 3540 Pennsylvania St | 0.66mi | 3/1.5 (+1) | 1,035 (+15%) | 3mo | $68,000 | $66 | 35 |
Match score weights: distance 35% · size 25% · config 20% · recency 20%. Top-matched comps best support the ARV.
Projected returns pro-forma
-3.0% appreciation · 4.85% rent growth · sell at horizon
- IRR
- 42.3%
- Equity multiple
- 2.87×
- Total profit
- $27,746
- Equity at exit
- $7,902
- IRR
- 49.3%
- Equity multiple
- 6.24×
- Total profit
- $77,698
- Equity at exit
- $4,582
Cash invested: $14,840 (down + closing). Projections, not guarantees.
Landlord ↔ Tenant lean methodology
- Overall (STATE)
- 90 Strongly Landlord-Friendly
- State Indiana
- 90 Strongly Landlord-Friendly · R+11
- County
- — inherits STATE
- City
- — inherits STATE
ZIP-level market 46409
- Home prices YoY
- -2.0%
- Rents YoY
- 4.8%
- Active inventory
- 75
- Price-to-rent
- 3.7×
Monthly cashflow live
- Estimated rent
- $1,180 high interval (Pro) →
- Mortgage (P&I)
- −$278
- Tax from tax record
- −$97 /mo · $1,164/yr
- Insurance
- −$22
- HOA
- −$0
- Vacancy / Maint / Mgmt
- −$248
- Net cashflow
- $535
Break-even live
UW: 25.0% down · 7.5% · 30yr · 1.5% tax · 5.0% vac · 8.0% maint · 8.0% mgmt
Financing live
Cash to close
- Down payment
- $13,250
- Closing costs
- $1,590
- Reserves months
- —
- Total cash needed
- —
Loan-product check · same deal, 3 products live
Conventional
25% down · 7.5% · 30yr
- Down + closing
- —
- Monthly P&I
- —
- Monthly cashflow
- —
- DSCR
- —
- Eligible?
- —
Personal DTI + credit; lowest rate.
DSCR
20% down · 8.5% · 30yr
- Down + closing
- —
- Monthly P&I
- —
- Monthly cashflow
- —
- DSCR
- —
- Eligible?
- —
No personal income docs; deal must DSCR.
Hard money
10% down · 12.0% · 12mo
- Down + closing
- —
- Monthly P&I
- —
- Monthly cashflow
- —
- DSCR
- —
- Eligible?
- —
Short-term bridge; refi at stabilization.
Rent comps 10 comps
| Address | Beds | Baths | Sqft | Rent | $/sqft | DOM | Units | Dist |
|---|---|---|---|---|---|---|---|---|
| 816 E 35th Ct Gary, IN | 2.0 | 1.0 | 810 | $1,075 | $1.33 | 1d | 1 | 0.30mi |
| 801 E 32nd Ave Unit 2 Gary, IN | 2.0 | 1.0 | 850 | $1,300 | $1.53 | 1d | 1 | 0.52mi |
| 4456 Connecticut St Gary, IN | 3.0 | 1.0 | 1044 | $1,300 | $1.25 | 2d | 1 | 1.27mi |
| 3708 Harrison St Gary, IN | 3.0 | 1.5 | 904 | $1,400 | $1.55 | 2d | 1 | 1.33mi |
| 4327 Monroe St Unit 1st front Gary, IN | 1.0 | 1.0 | 600 | $1,095 | $1.82 | 1d | 1 | 1.42mi |
| 1005 W 35th Ave Apt 105 Gary, IN | 2.0 | 1.0 | 601 | $795 | $1.32 | 18d | 1 | 1.45mi |
| 1005 W 35th Ave Apt 202 Gary, IN | 2.0 | 1.0 | 617 | $795 | $1.29 | 1d | 1 | 1.45mi |
| 1015 W 35th Ave Apt 206 Gary, IN | 2.0 | 1.0 | 601 | $795 | $1.32 | 43d | 1 | 1.46mi |
| 4018 Tyler St Gary, IN | 3.0 | 1.0 | 880 | $1,350 | $1.53 | 1d | 1 | 1.47mi |
| 2453 Prospect St Gary, IN | 2.0 | 1.0 | 704 | $1,095 | $1.56 | 1d | 1 | 1.48mi |
Listing history 2 events
-
2026-06-18remarks 699-char remark
-
2026-06-18$53,000 Active 1 DOM
ⓘ Source: listings_history table (triggers on properties + properties_extension) + one-shot
backfill from property_details.listing_events for pre-trigger history.
Tax reassessment forecast IN · Partial reset (capped growth)
- Current annual tax
- $1,164 · $97/mo
- Projected year-2 tax
- $1,164 · $97/mo
- Expected delta
- $0/yr ($0/mo · 0.0%)
ⓘ Screening estimate from a state-policy table — verify with the county assessor before closing.
Climate risk First Street
- Flood 1/10 Low FEMA zone X (unshaded) · 0% chance over 30 yrs
- Wildfire 3/10 Moderate
- Heat 2/10 Low 7 d/yr ≥102°F today · 15 d/yr by 30 yrs out
- Wind 2/10 Low
- Air quality 4/10 Moderate 6 unhealthy d/yr today · 7 by 30 yrs out
Nearby sold comps map
Loading sold comps map…
Walkable amenities ~0.75 mi
Loading nearby amenities…
Taxation est. · year 1
- Rental income
- $14,154
- − Mortgage interest
- −$2,969
- − Property taxes
- −$1,164
- − Insurance
- −$265
- − Repairs & maintenance
- −$1,132
- − Management
- −$1,132
- − Depreciation
- −$1,542
- Taxable income
- $5,950
- Est. tax owed @ 24.0%
- −$1,428
- After-tax cash flow
- $4,990/yr
For passive investors: Depreciation is non-cash, so a rental often shows a tax loss while cash-flowing — sheltering income. Rental losses are passive: they offset passive income freely, and up to $25,000/yr can offset ordinary (W-2) income if you actively participate and your MAGI is under $100k (phasing out to $0 by $150k); unused losses carry forward. On sale, claimed depreciation is recaptured at up to 25%, and gains may owe capital-gains tax (a 1031 exchange can defer both). Figures are a year-1 estimate at your 24.0% rate — not tax advice; consult a CPA.
Schools (NCES district)
- District
- Gary Community School Corporation
- NCES district ID
- 1803870
- Math proficiency
- 3% ▼ -10.00%
- Reading proficiency
- 11% ▼ -6.00%
- Median HH income
- $27,739
- Composite
- 4.98/100
- National rank
- #10039
- State rank
- #299 of 301 in IN
Livability — Gary
- Score
- 73/100
- State rank
- #105
- US rank
- #5592
Category grades
Schools grade is shown separately in the Schools card above.
Census & demographics
- Census place
- Gary, IN
- County
- Lake County · 422,878 people
- City population
- 63,701
- Metro
- Chicago-Naperville-Elgin, IL-IN-WI
- Population (ZIP)
- 7,184
- Household income
- $44,667
- Rent vs Own
- Severe rent burden
- 516.0
Population outlook (Lake County) Hauer SSP2
- Today (2025)
- 484,026 people
- By 2030
- 478,091 · -1.2%
- By 2040
- 462,974 · -4.3%
- By 2050
- 449,894 · -7.1%
- By 2075
- 436,169 · -9.9%
- By 2100
- 426,607 · -11.9%
Race, ethnicity, and origin ACS 2023
- Neighborhood character
- Predominantly Black (68%)
- Race & ethnicity
- Black 68% Two or more races 17% Hispanic / Latino 14% White 11%
- Hispanic origin (detail)
- Mexican 8% Puerto Rican 5%
- Common ancestry
- Iranian 1% Romanian 1%
- Foreign-born
- 2% · Canada
- Languages at home
- 94% English-only · Spanish 6%
Political lean MEDSL · Lake
- 2024 margin
- Lean D (+5.6) · D 52.1% · R 46.5% · Other 1.5%
- 2008→2024 swing
- -28.6pp toward R · 2008: 34.3pp · 2024: 5.6pp
- All cycles
- 2024: D+5.6 2020: D+15.1 2016: D+20.6 2012: D+31.0 2008: D+34.3
Not yet ingested
- Civics
- —
Market trends
- HPI YoY
- ▼ -3.91%
- Current HPI
- 190.6724
- Rent YoY
- ▲ 4.85%
- Metro
- Chicago-Naperville-Elgin, IL-IN-WI
- State GDP YoY
- ▲ 2.90%
- F500 in state
- 18
Industry mix (Fortune 500 HQ in IN)
| Industry | F500 HQs | Revenue |
|---|---|---|
| Industrial Machinery | 2 | $37B |
|
||
| Healthcare | 1 | $177B |
|
||
| Pharmaceuticals | 1 | $45B |
|
||
| Metals / Steel | 1 | $18B |
|
||
| Agriculture | 1 | $17B |
|
||
| Packaging | 1 | $12B |
|
||
Price history
+32.5% since first listed7 events — show timeline
- 2026-06-17 Listed $53,000 NIRA MLS as Distributed by MLS Grid
- 2013-03-21 Listing Removed — NIRA MLS as Distributed by MLS Grid
- 2013-03-21 Sold (MLS) $7,000 NIRA MLS as Distributed by MLS Grid
- 2013-02-21 Listed $9,000 NIRA MLS as Distributed by MLS Grid
- 2013-01-29 Listed $9,000 NIRA MLS as Distributed by MLS Grid
- 2012-03-31 Listing Removed — NIRA MLS as Distributed by MLS Grid
- 2011-09-06 Listed $40,000 NIRA MLS as Distributed by MLS Grid
Property tax history
-8.9%/yrLatest (2024): $1,164 · +8.1% YoY. Source: county tax records.
Cash-flow waterfall
monthlySold comps — $/sqft
last 12 mo · ≤1 miLoading sold comps…