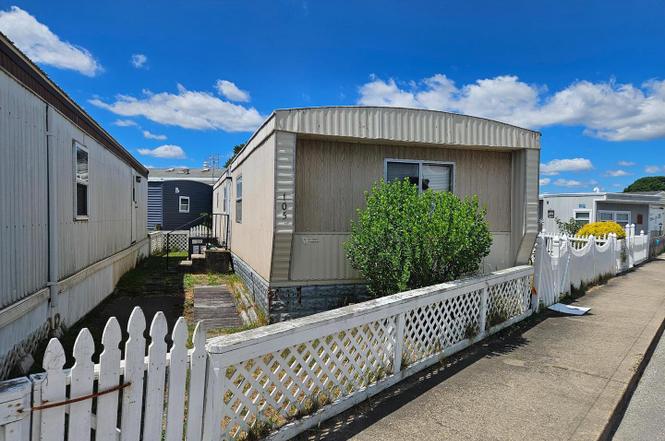
105 135th St · Ocean City, MD
Flood risk No data
- FEMA flood zone
- —
- Chance of flooding over 30 yrs
- —
- Est. flood insurance / yr
- —
Fire risk No data
- Est. fire insurance / yr
- —
Heat risk No data
- Hot days now (above threshold)
- —
- Hot days in 30 yrs
- —
Wind risk No data
- Chance of severe wind over 30 yrs
- —
Air-quality risk No data
- Unhealthy air days now
- —
- Unhealthy air days in 30 yrs
- —
Risk factors via First Street. Map © Google.
Why this score? — see what drove the C grade
The composite is a weighted blend of 9 inputs, each scored 0–100. Each bar is that input's sub-score; the figure is the points it added to the 100-point composite (weight × sub-score).
- Cash flow +18.9/30.0
- ARV discount +15.0/15.0
- DSCR +6.0/10.0
- 1% rule +5.3/10.0
- Livability +3.7/5.0
- Schools +3.3/10.0
- Rent growth +2.5/5.0
- Condition / age +2.5/5.0
- Appreciation +0.0/10.0
$175,000
🖨 Deal sheet 📄 Offer letter ✓ Due diligence
Listing remarks MLS
Fully furnished, two year old appliances, window treatments, carpeting, laminate floor in kitchen, master bath, large , open -kit livng room. Central air, 2 sheds, near pool and 1 block to beach. A must see wont last. One year home warranty.
Key facts
- Outdoor pool
- New a/c
- New rubber roof
Tags
Property features AI
Finance
- HOA & community: Cooperative ownership; Monthly coop fee of $168; Community amenities include outdoor pool; Coop fee may cover pool(s), trash, taxes, water, sewer, and lawn maintenance
Exterior
- Parking: On-street parking
- Utilities: Public water; Public sewer; Cable TV available
- Home design: Manufactured home; Frame construction with metal siding; Above-grade additional structure(s)
- Construction: Frame and metal siding construction; Other foundation type; Estimated year built
- Exterior features: Patio(s); Personal pool; Storage barn/shed; Not in a federal flood zone; In city limits; Public road access; Bus stop within 1 mile
Interior
- Kitchen: Dishwasher; Gas range; Microwave; Refrigerator; Oven
- Bedrooms: 2 bedrooms on main level
- Bathrooms: 1 full bathroom on main level; 1 full bathroom total
- Heating & cooling: Forced air heating (natural gas); Central air conditioning (electric)
- Interior features: Two or more access exits; No basement
- Laundry & utility: Washer; Dryer; Electric hot water
Neighborhood map
What this means for you Summary
Snapshot
- This is a 2-bed/1.0-bath manufactured listed at $175k.
Deal economics
- At list price, monthly cash flow is $180 ($2k/yr) — positive.
- The deal already cash-flows at list — no discount required.
- Meets the 1% rule at list price ($2k rent vs $175k).
- Cap rate 7.5% vs local median 1.4% in Ocean City — top-decile yield for the area; either an underpriced asset or a hidden risk that comps aren't pricing in. Stress-test before assuming the spread holds.
Location & tenants
- Location reads 73/100 on livability (#125 in MD) — a middle-class / working-renter tenant base. Strengths: commute A+, health & safety A+, amenities B; Watch: cost of living C-, crime F.
- Worcester County Public Schools (town): math 30% / reading 44% proficiency, ranked #6 of 24 in MD (top 25%) — families likely to look elsewhere, expect single-tenant / working-renter base with shorter leases.
- Zoned schools: Ocean City Elementary (math 37% / reading 47%, grade F, #84 of 860 statewide, top 10%, 521 students, 44% FRL); Berlin Intermediate (math 35% / reading 57%, grade D+, #13 of 225 statewide, top 5%, 640 students, 50% FRL); Stephen Decatur High (math 64% / reading 78%, grade B+, #37 of 222 statewide, top 17%, 1,431 students, 42% FRL).
- Zoned-school proficiency averages 53% at this address vs 37% district-wide (+16 pts) — the actual schools serving this property are materially stronger than the Worcester County Public Schools average implies; a family-tenant draw the district grade alone would hide.
- Market conditions: 673 active listings in the ZIP; solid renter incomes; 354 units permitted in Worcester County in 2024 (6 in 5+ unit buildings).
Forward outlook
- Local home prices are declining (-3.0%/yr); year-one equity from $1k of loan paydown is wiped out by about $5k of value loss. Plan a longer hold.
- Worcester County population projected to shrink 4% by 2050 — rents likely to lag national; underwrite the cash flow, not the appreciation.
Negotiation context
- Only 1 days on market — expect competitive offers; lowballing is unlikely to land.
- 2 sale attempts since 21y ago with the ask held roughly flat each time — persistent listings suggest the price (not the market) is what's stuck; bring a comps-based counter.
- Current owner paid $149k; 17% above their basis — modest negotiation headroom, anchor on the comps not their cost.
Questions for the listing agent
- Built in 1977 — when were the roof, HVAC, electrical panel, plumbing, and water heater last replaced?
- What does the HOA fee cover, when was the last increase, and are there any pending special assessments or reserve-fund shortfalls?
- Is there a deadline driving the sale (1031 exchange, divorce, estate, relocation)? That informs how much negotiation room exists.
- Schools are B-rated — typically a magnet for longer-tenancy family renters. What's the average tenant stay here, and is there a school-zone premium baked into asking?
- Crime grade is F in this area — have there been break-ins, vandalism, or insurance claims at this property in the last 3 years? What carrier currently insures it and at what premium?
- What's the average days-on-market for RENTAL listings here right now (not sales)? A rising rental-DOM trend means longer vacancies and softer asking-rent achievability than the comps imply.
- What's the recent tenant-quality profile in this submarket — average credit score on applications, eviction rate, late-payment / NSF rate, and stable-employment percentage? A property-management company in the area should have these aggregated.
- How much new for-sale + rental construction is in the pipeline within 1–3 miles? Heavy new supply typically softens prices + rents 12–24 months out; constrained supply supports both.
Investment metrics
- 1% rule
- 1.03% ✓
- Cap rate
- 7.53%
- Cash-on-cash
- 4.41%
- DSCR
- 1.20
- GRM
- 8.1
CMA / ARV
- ARV (on-the-fly)
- $239,232
- Comps found
- 5
Show comp detail 5 sales within ~0.75 mi
| Address | Dist | Beds/Ba | Sqft | Sold | Price | $/sf | Match |
|---|---|---|---|---|---|---|---|
| 13214 Ocean Dr | 0.18mi | 2/1.0 | 732 (+9%) | 11mo | $225,000 | $307 | 68 |
| 138 S Ocean Dr | 0.44mi | 2/1.0 | 720 (+7%) | 5mo | $268,000 | $372 | 64 |
| 110 Bea Ln | 0.02mi | 2/1.5 | 576 (-14%) | 14mo | $205,000 | $356 | 61 |
| 146 Pine Tree Rd | 0.35mi | 2/1.0 | 624 (-7%) | 24mo | $242,500 | $389 | 52 |
| 13323 Colonial Rd | 0.23mi | 3/2.0 (+1) | 732 (+9%) | 18mo | $245,000 | $335 | 50 |
Match score weights: distance 35% · size 25% · config 20% · recency 20%. Top-matched comps best support the ARV.
Projected returns pro-forma
-3.0% appreciation · 3.0% rent growth · sell at horizon
- IRR
- -9.4%
- Equity multiple
- 0.66×
- Total profit
- $-16,840
- Equity at exit
- $26,093
- IRR
- 0.1%
- Equity multiple
- 1.01×
- Total profit
- $311
- Equity at exit
- $15,131
Cash invested: $49,000 (down + closing). Projections, not guarantees.
Landlord ↔ Tenant lean methodology
- Overall (STATE)
- 27 Tenant-Leaning
- State Maryland
- 27 Tenant-Leaning · D+14
- County
- — inherits STATE
- City
- — inherits STATE
ZIP-level market 21842
- Home prices YoY
- -5.0%
- Active inventory
- 673
- Price-to-rent
- 8.1×
Monthly cashflow live
- Estimated rent
- $1,810 medium interval (Pro) →
- Mortgage (P&I)
- −$918
- Tax from tax record
- −$91 /mo · $1,094/yr
- Insurance
- −$73
- HOA
- −$168
- Vacancy / Maint / Mgmt
- −$380
- Net cashflow
- $180
Break-even live
UW: 25.0% down · 7.5% · 30yr · 1.5% tax · 5.0% vac · 8.0% maint · 8.0% mgmt
Financing live
Cash to close
- Down payment
- $43,750
- Closing costs
- $5,250
- Reserves months
- —
- Total cash needed
- —
Loan-product check · same deal, 3 products live
Conventional
25% down · 7.5% · 30yr
- Down + closing
- —
- Monthly P&I
- —
- Monthly cashflow
- —
- DSCR
- —
- Eligible?
- —
Personal DTI + credit; lowest rate.
DSCR
20% down · 8.5% · 30yr
- Down + closing
- —
- Monthly P&I
- —
- Monthly cashflow
- —
- DSCR
- —
- Eligible?
- —
No personal income docs; deal must DSCR.
Hard money
10% down · 12.0% · 12mo
- Down + closing
- —
- Monthly P&I
- —
- Monthly cashflow
- —
- DSCR
- —
- Eligible?
- —
Short-term bridge; refi at stabilization.
HOA detail
- Monthly dues
- $168 · $2,016/yr
- Likely covers
- pool
Listing history 2 events
-
2026-06-18remarks 334-char remark
-
2026-06-18$175,000 Active 1 DOM
ⓘ Source: listings_history table (triggers on properties + properties_extension) + one-shot
backfill from property_details.listing_events for pre-trigger history.
Tax reassessment forecast MD · Partial reset (capped growth)
- Current annual tax
- $1,094 · $91/mo
- Projected year-2 tax
- $1,501 · $125/mo
- Expected delta
- +$407/yr (+$34/mo · 37.2%)
ⓘ Screening estimate from a state-policy table — verify with the county assessor before closing.
Nearby sold comps map
Loading sold comps map…
Walkable amenities ~0.75 mi
Loading nearby amenities…
Taxation est. · year 1
- Rental income
- $21,718
- − Mortgage interest
- −$9,803
- − Property taxes
- −$1,094
- − Insurance
- −$875
- − Repairs & maintenance
- −$1,737
- − Management
- −$1,737
- − HOA
- −$2,016
- − Depreciation
- −$5,091
- Taxable loss
- −$635
- Est. tax savings @ 24.0%
- +$152
- After-tax cash flow
- $2,313/yr
For passive investors: Depreciation is non-cash, so a rental often shows a tax loss while cash-flowing — sheltering income. Rental losses are passive: they offset passive income freely, and up to $25,000/yr can offset ordinary (W-2) income if you actively participate and your MAGI is under $100k (phasing out to $0 by $150k); unused losses carry forward. On sale, claimed depreciation is recaptured at up to 25%, and gains may owe capital-gains tax (a 1031 exchange can defer both). Figures are a year-1 estimate at your 24.0% rate — not tax advice; consult a CPA.
Schools (NCES district)
- District
- Worcester County Public Schools
- NCES district ID
- 2400720
- Math proficiency
- 30% ▼ -25.00%
- Reading proficiency
- 44% ▼ -20.00%
- Median HH income
- $56,748
- Composite
- 32.6/100
- National rank
- #5672
- State rank
- #6 of 24 in MD
Livability — Ocean City
- Score
- 73/100
- State rank
- #125
- US rank
- #5407
Category grades
Schools grade is shown separately in the Schools card above.
Census & demographics
- Census place
- Ocean City, MD
- County
- Worcester County · 35,603 people
- Metro
- Salisbury, MD-DE
- Population (ZIP)
- 11,226
- Household income
- $79,876
- Rent vs Own
- Severe rent burden
- 322.0
Population outlook (Worcester County) Hauer SSP2
- Today (2025)
- 51,363 people
- By 2030
- 51,191 · -0.3%
- By 2040
- 50,459 · -1.8%
- By 2050
- 49,451 · -3.7%
- By 2075
- 48,533 · -5.5%
- By 2100
- 44,223 · -13.9%
Race, ethnicity, and origin ACS 2023
- Neighborhood character
- Predominantly White (86%)
- Race & ethnicity
- White 86% Hispanic / Latino 8% Two or more races 5% Black 3%
- Hispanic origin (detail)
- Mexican 3%
- Common ancestry
- Romanian 6% Slovak 3% Lithuanian 2%
- Foreign-born
- 10% · Canada, China
- Languages at home
- 87% English-only · Spanish 7% Russian/Polish/Slavic 3% Other Indo-European 2%
Political lean MEDSL · Worcester
- 2024 margin
- Strong R (+22.0) · D 38.0% · R 60.0% · Other 2.0%
- 2008→2024 swing
- -6.5pp toward R · 2008: -15.5pp · 2024: -22.0pp
- All cycles
- 2024: R+22.0 2020: R+19.0 2016: R+27.9 2012: R+18.3 2008: R+15.5
Not yet ingested
- Civics
- —
Market trends
- HPI YoY
- ▼ -25.65%
- Current HPI
- 482.18
- Rent YoY
- —
- Metro
- Salisbury, MD-DE
- State GDP YoY
- ▲ 2.97%
- F500 in state
- 12
Industry mix (Fortune 500 HQ in MD)
| Industry | F500 HQs | Revenue |
|---|---|---|
| Aerospace / Defense | 1 | $71B |
|
||
| Utilities | 1 | $25B |
|
||
| Hotels | 1 | $24B |
|
||
| Consumer Goods | 1 | $7B |
|
||
| Real Estate | 1 | $6B |
|
||
| Chemicals | 1 | $2B |
|
||
Price history
+16.7% since first listed3 events — show timeline
- 2026-06-17 Listed $175,000 BRIGHT MLS
- 2005-06-20 Sold (MLS) $149,000 BRIGHT MLS
- 2005-06-11 Listed $149,900 BRIGHT MLS
Property tax history
+1.8%/yrLatest (2025): $1,094 · +3.4% YoY. Source: county tax records.
Cash-flow waterfall
monthlySold comps — $/sqft
last 12 mo · ≤1 miLoading sold comps…