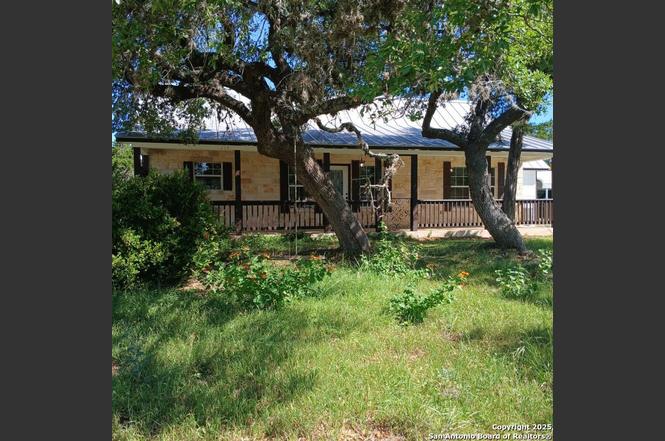
339 Granite · Canyon Lake, TX
Flood risk 1/10 · Minimal
- FEMA flood zone
- X (unshaded)
- Chance of flooding over 30 yrs
- 0.0%
- Est. flood insurance / yr
- $507 – $1,088
Fire risk 5/10 · Moderate
- Est. fire insurance / yr
- $1,222 – $2,270
Heat risk 8/10 · Major
- Hot days now (above 107°F)
- 7 days/yr
- Hot days in 30 yrs
- 23 days/yr
Wind risk 6/10 · Moderate
- Chance of severe wind over 30 yrs
- 68.0%
Air-quality risk 2/10 · Minimal
- Unhealthy air days now
- 0 days/yr
- Unhealthy air days in 30 yrs
- 1 days/yr
Risk factors via First Street. Map © Google.
Why this score? — see what drove the D grade
The composite is a weighted blend of 9 inputs, each scored 0–100. Each bar is that input's sub-score; the figure is the points it added to the 100-point composite (weight × sub-score).
- Cash flow +11.9/30.0
- ARV discount +9.7/15.0
- Schools +5.2/10.0
- DSCR +3.5/10.0
- Livability +3.4/5.0
- 1% rule +3.2/10.0
- Rent growth +2.5/5.0
- Condition / age +2.5/5.0
- Appreciation +0.0/10.0
$239,999
🖨 Deal sheet 📄 Offer letter ✓ Due diligence
Listing remarks
Welcome to this beautiful custom built 3/2 home in Cypress Cove! The home features an open floorplan with high ceilings, in the main living area. New flooring has been installed throughout the home. Right off of the Kitchen is an adjoining dining room. The living area is complete with 16' vaulted ceilings, large window, French doors lead to a rear patio which has been screened in to let in natural light. You can relax in the backyard covered patio for shade and privacy. Cypress Cove has several wonderful amenities, including a boat ramp, (Guadalupe/Deep Water), park, sports court, and a pool in the Subdivision. The HOA hosts neighborhood events, like the annual fish fry and ice cream social
Key facts
- Open floorplan
- Custom built home
- Screened in patio
Tags
Neighborhood map
What this means for you Summary
Snapshot
- This is a 3-bed/2.0-bath single-family listed at $240k.
Deal economics
- At list price, monthly cash flow is $-60 ($-716/yr) — negative.
- To cash-flow at today's rent, offer at most $229k (4.4% below list).
- To meet the 1% rule (rent ≥ 1% of price), the offer needs to be $197k (17.9% below list).
- Recommended offer: $197k (17.9% below list) — sets the bar for 1% rule.
- Cap rate 6.0% vs local median 2.3% in Canyon Lake — top-decile yield for the area; either an underpriced asset or a hidden risk that comps aren't pricing in. Stress-test before assuming the spread holds.
Location & tenants
- Location reads 67/100 on livability (#534 in TX) — a middle-class / working-renter tenant base. Strengths: employment A+, housing A+, cost of living A; Watch: amenities F, commute F, health & safety F.
- Comal ISD (rural): math 57% / reading 59% proficiency, ranked #58 of 826 in TX (top 7%) — acceptable for families but not a draw, mixed tenant base, ~2y average lease.
- Zoned schools: Rebecca Creek El (math 55% / reading 52%, grade C, #686 of 4,322 statewide, top 16%, 605 students, 51% FRL); Canyon Lake H S (math 46% / reading 56%, grade D+, #482 of 1,632 statewide, top 30%, 1,038 students, 37% FRL).
- Market conditions: 633 active listings in the ZIP; 3 comparable units currently listed for rent nearby; rentals lingering (median 44d on market — plan ~5-8 weeks vacancy on turnover, expect pricing pressure); 100% of comp listings sitting > 30 days — soft ceiling on asking rent; high-income renter base; 3,420 units permitted in Comal County in 2024 (1,164 in 5+ unit buildings).
Forward outlook
- Local home prices are declining (-3.0%/yr); year-one equity from $2k of loan paydown is wiped out by about $7k of value loss. Plan a longer hold.
- Comal County population projected at +70% by 2050 — long-run rental-demand tailwind backs the buy-and-hold thesis.
Negotiation context
- It's been on market 354 days — a 12% lower offer ($211k) is reasonable based on typical stale-listing flexibility.
- 3 sale attempts; this cycle's ask has dropped $60k (20%) from the opening price — seller is motivated, your offer sets the floor, not the list.
Risks & watch-outs
- Climate carrying-cost: major wind risk, 68% chance of damaging wind over 30y; moderate wildfire risk; extreme-heat days projected 7→23/yr by 2055 (HVAC capex compounding) — expect insurance premiums to compound above CPI over the hold.
Questions for the listing agent
- What do current leases actually rent for vs. the listed asking? Can we see a recent rent roll and the last 12 months of T-12 income?
- It's been on market 354 days. Have you received any prior offers? Is the seller open to a 18% concession, seller financing, or rate buy-down credit?
- What does the HOA fee cover, when was the last increase, and are there any pending special assessments or reserve-fund shortfalls?
- Why hasn't it sold? Are there any deal-killer items the seller is aware of (foundation, flood, title, zoning, code violations)?
- Is there a deadline driving the sale (1031 exchange, divorce, estate, relocation)? That informs how much negotiation room exists.
- The area grade is low — what's the realistic commute time and amenity access for the typical tenant pool here? Any planned neighborhood developments (good or bad) we should know about?
- What's the average days-on-market for RENTAL listings here right now (not sales)? A rising rental-DOM trend means longer vacancies and softer asking-rent achievability than the comps imply.
- What's the recent tenant-quality profile in this submarket — average credit score on applications, eviction rate, late-payment / NSF rate, and stable-employment percentage? A property-management company in the area should have these aggregated.
- How much new for-sale + rental construction is in the pipeline within 1–3 miles? Heavy new supply typically softens prices + rents 12–24 months out; constrained supply supports both.
Investment metrics
- 1% rule
- 0.82% ✗
- Cap rate
- 5.99%
- Cash-on-cash
- -1.07%
- DSCR
- 0.95
- GRM
- 10.2
CMA / ARV
- ARV (on-the-fly)
- $252,472
- Comps found
- 12
Show comp detail 12 sales within ~0.75 mi
| Address | Dist | Beds/Ba | Sqft | Sold | Price | $/sf | Match |
|---|---|---|---|---|---|---|---|
| 339 Granite | 0.00mi | 3/2.0 | 1,306 (+8%) | 0mo | $239,999 | $184 | 86 |
| 1628 Rim Rock Cv | 0.10mi | 3/2.0 | 1,288 (+7%) | 6mo | $260,000 | $202 | 79 |
| 1407 Tanglewood Trl | 0.43mi | 3/2.0 | 1,210 (+0%) | 1mo | $279,900 | $231 | 79 |
| 6121 Tanglewood Trl | 0.27mi | 3/2.0 | 1,217 (+1%) | 10mo | $289,000 | $237 | 78 |
| 119 Rockingshire | 0.17mi | 3/2.0 | 1,313 (+9%) | 2mo | $309,900 | $236 | 76 |
| 1637 Bob White Dr | 0.11mi | 3/2.0 | 1,320 (+9%) | 6mo | $260,000 | $197 | 74 |
| 743 Mockingbird Cv | 0.35mi | 3/2.0 | 1,168 (-3%) | 10mo | $259,984 | $223 | 70 |
| 1456 Green Mdw | 0.27mi | 3/2.0 | 1,078 (-11%) | 2mo | $225,000 | $209 | 68 |
| 1302 Echo Mdw | 0.43mi | 3/2.0 | 1,328 (+10%) | 3mo | $290,000 | $218 | 61 |
| 1956 Tanglewood | 0.64mi | 3/2.0 | 1,292 (+7%) | 1mo | $269,990 | $209 | 58 |
| 1230 Echo Mdw | 0.49mi | 3/2.0 | 1,082 (-10%) | 4mo | $199,000 | $184 | 56 |
| 2421 Hornsby | 0.72mi | 3/2.0 | 1,292 (+7%) | 5mo | $222,000 | $172 | 50 |
Match score weights: distance 35% · size 25% · config 20% · recency 20%. Top-matched comps best support the ARV.
Projected returns pro-forma
-3.0% appreciation · 3.0% rent growth · sell at horizon
- IRR
- -18.1%
- Equity multiple
- 0.36×
- Total profit
- $-42,687
- Equity at exit
- $35,785
- IRR
- -10.3%
- Equity multiple
- 0.37×
- Total profit
- $-42,050
- Equity at exit
- $20,751
Cash invested: $67,200 (down + closing). Projections, not guarantees.
Landlord ↔ Tenant lean methodology
- Overall (STATE)
- 87 Strongly Landlord-Friendly
- State Texas
- 87 Strongly Landlord-Friendly · R+5
- County
- — inherits STATE
- City
- — inherits STATE
ZIP-level market 78070
- Home prices YoY
- -20.8%
- Active inventory
- 633
- Price-to-rent
- 10.2×
Monthly cashflow live
- Estimated rent
- $1,970 medium interval (Pro) →
- Mortgage (P&I)
- −$1,259
- Tax from tax record
- −$249 /mo · $2,990/yr
- Insurance
- −$100
- HOA
- −$8
- Vacancy / Maint / Mgmt
- −$414
- Net cashflow
- $-60
Break-even live
UW: 25.0% down · 7.5% · 30yr · 1.5% tax · 5.0% vac · 8.0% maint · 8.0% mgmt
Financing live
Cash to close
- Down payment
- $60,000
- Closing costs
- $7,200
- Reserves months
- —
- Total cash needed
- —
Loan-product check · same deal, 3 products live
Conventional
25% down · 7.5% · 30yr
- Down + closing
- —
- Monthly P&I
- —
- Monthly cashflow
- —
- DSCR
- —
- Eligible?
- —
Personal DTI + credit; lowest rate.
DSCR
20% down · 8.5% · 30yr
- Down + closing
- —
- Monthly P&I
- —
- Monthly cashflow
- —
- DSCR
- —
- Eligible?
- —
No personal income docs; deal must DSCR.
Hard money
10% down · 12.0% · 12mo
- Down + closing
- —
- Monthly P&I
- —
- Monthly cashflow
- —
- DSCR
- —
- Eligible?
- —
Short-term bridge; refi at stabilization.
Rent comps 3 comps
| Address | Beds | Baths | Sqft | Rent | $/sqft | DOM | Units | Dist |
|---|---|---|---|---|---|---|---|---|
| 1285 Live Oak Dr Spring Branch, TX | 3.0 | 2.0 | 1314 | $1,795 | $1.37 | 44d | 1 | 0.15mi |
| 1491 Winding Creek Trl Spring Branch, TX | 3.0 | 2.0 | 1298 | $1,850 | $1.43 | 44d | 1 | 0.57mi |
| 2071 Hornsby Spring Branch, TX | 2.0 | 2.0 | 1070 | $1,595 | $1.49 | 44d | 1 | 0.60mi |
HOA detail
- Monthly dues
- $8 · $96/yr
- Likely covers
- waterpool
Listing history 11 events
-
2026-05-07soldstatus
-
2026-04-22status Pending
-
2026-03-09price $239,999
-
2025-11-06price $279,999
-
2025-11-05status Back on Market
-
2025-11-03historical
-
2025-10-31status Back on Market
-
2025-10-28historical
-
2025-07-09price $289,999
-
2025-04-28$299,999 New
-
2024-03-27soldstatus
ⓘ Source: listings_history table (triggers on properties + properties_extension) + one-shot
backfill from property_details.listing_events for pre-trigger history.
Tax reassessment forecast TX · Resets to sale price
- Current annual tax
- $2,990 · $249/mo
- Projected year-2 tax
- $4,392 · $366/mo
- Expected delta
- +$1,402/yr (+$117/mo · 46.9%)
ⓘ Screening estimate from a state-policy table — verify with the county assessor before closing.
Climate risk First Street
- Flood 1/10 Low FEMA zone X (unshaded) · 0% chance over 30 yrs
- Wildfire 5/10 Major
- Heat 8/10 Severe 7 d/yr ≥107°F today · 23 d/yr by 30 yrs out
- Wind 6/10 Major 68% chance of damaging wind over 30 yrs
- Air quality 2/10 Low 0 unhealthy d/yr today · 1 by 30 yrs out
Nearby sold comps map
Loading sold comps map…
Walkable amenities ~0.75 mi
Loading nearby amenities…
Taxation est. · year 1
- Rental income
- $23,637
- − Mortgage interest
- −$13,444
- − Property taxes
- −$2,990
- − Insurance
- −$1,200
- − Repairs & maintenance
- −$1,891
- − Management
- −$1,891
- − HOA
- −$96
- − Depreciation
- −$6,982
- Taxable loss
- −$4,857
- Est. tax savings @ 24.0%
- +$1,166
- After-tax cash flow
- $450/yr
For passive investors: Depreciation is non-cash, so a rental often shows a tax loss while cash-flowing — sheltering income. Rental losses are passive: they offset passive income freely, and up to $25,000/yr can offset ordinary (W-2) income if you actively participate and your MAGI is under $100k (phasing out to $0 by $150k); unused losses carry forward. On sale, claimed depreciation is recaptured at up to 25%, and gains may owe capital-gains tax (a 1031 exchange can defer both). Figures are a year-1 estimate at your 24.0% rate — not tax advice; consult a CPA.
Schools (NCES district)
- District
- Comal ISD
- NCES district ID
- 4814730
- Math proficiency
- 57% ▼ -9.00%
- Reading proficiency
- 59% ▼ -2.00%
- Median HH income
- $74,792
- Composite
- 51.79/100
- National rank
- #1671
- State rank
- #58 of 826 in TX
Livability — Canyon Lake
- Score
- 67/100
- State rank
- #534
- US rank
- #10441
Category grades
Schools grade is shown separately in the Schools card above.
Census & demographics
- Census place
- Canyon Lake, TX
- County
- Comal County · 206,262 people
- City population
- 42,159
- Metro
- San Antonio-New Braunfels, TX
- Population (ZIP)
- 20,200
- Household income
- $115,175
- Rent vs Own
- Severe rent burden
- 73.0
Population outlook (Comal County) Hauer SSP2
- Today (2025)
- 175,637 people
- By 2030
- 199,911 · +13.8%
- By 2040
- 249,436 · +42.0%
- By 2050
- 299,430 · +70.5%
- By 2075
- 423,857 · +141.3%
- By 2100
- 512,048 · +191.5%
Race, ethnicity, and origin ACS 2023
- Neighborhood character
- Predominantly White (70%)
- Race & ethnicity
- White 70% Hispanic / Latino 22% Two or more races 12% Black 3%
- Hispanic origin (detail)
- Mexican 19%
- Common ancestry
- Lithuanian 3% Romanian 3% Slovak 2%
- Foreign-born
- 6% · Canada
- Languages at home
- 89% English-only · Spanish 10% French/Haitian/Cajun 1%
Political lean MEDSL · Comal
- 2024 margin
- Solid R (+45.5) · D 26.8% · R 72.2%
- 2008→2024 swing
- +1.9pp toward D · 2008: -47.4pp · 2024: -45.5pp
- All cycles
- 2024: R+45.5 2020: R+42.7 2016: R+50.1 2012: R+54.1 2008: R+47.4
Not yet ingested
- Civics
- —
Market trends
- HPI YoY
- ▼ -61.35%
- Current HPI
- 233.2875
- Rent YoY
- —
- Metro
- San Antonio-New Braunfels, TX
- State GDP YoY
- ▲ 3.95%
- F500 in state
- 110
Industry mix (Fortune 500 HQ in TX)
| Industry | F500 HQs | Revenue |
|---|---|---|
| Energy | 16 | $1,198B |
|
||
| Technology | 5 | $198B |
|
||
| Engineering / Construction | 4 | $72B |
|
||
| Energy Services | 3 | $60B |
|
||
| Utilities | 3 | $41B |
|
||
| Healthcare | 2 | $330B |
|
||
Price history
-20.0% since first listed11 events — show timeline
- 2026-05-07 Sold (Public Records) — Public Records
- 2026-04-22 Pending — LERA
- 2026-03-09 Price Changed $239,999 LERA
- 2025-11-06 Price Changed $279,999 LERA
- 2025-11-05 Relisted — LERA
- 2025-11-03 Listing Removed — LERA
- 2025-10-31 Relisted — LERA
- 2025-10-28 Listing Removed — LERA
- 2025-07-09 Price Changed $289,999 LERA
- 2025-04-28 Listed $299,999 LERA
- 2024-03-27 Sold (Public Records) — Public Records
Property tax history
+2.2%/yrLatest (2026): $2,990 · -10.3% YoY. Source: county tax records.
Cash-flow waterfall
monthlySold comps — $/sqft
last 12 mo · ≤1 miLoading sold comps…