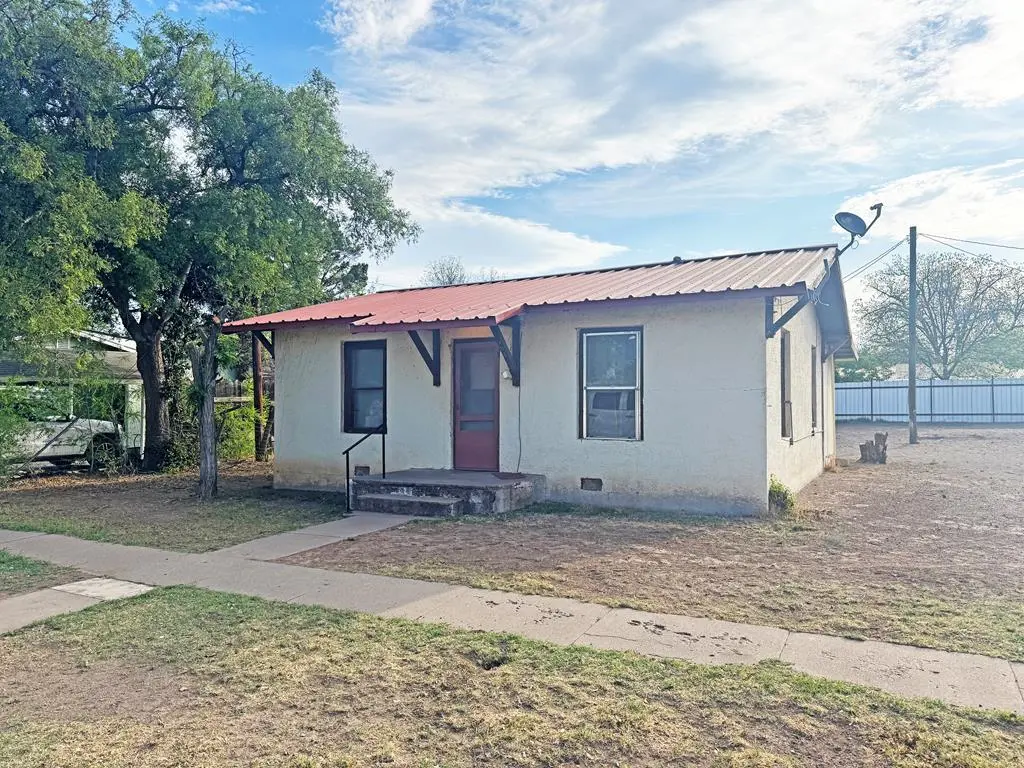
204 N Garnet Ave · Alpine, TX
Flood risk 6/10 · Moderate
- FEMA flood zone
- —
- Chance of flooding over 30 yrs
- 0.68%
- Est. flood insurance / yr
- —
Fire risk 9/10 · Severe
- Est. fire insurance / yr
- $1,222 – $2,270
Heat risk 4/10 · Minor
- Hot days now (above 95°F)
- 5 days/yr
- Hot days in 30 yrs
- 13 days/yr
Wind risk 1/10 · Minimal
- Chance of severe wind over 30 yrs
- —
Air-quality risk 1/10 · Minimal
- Unhealthy air days now
- 0 days/yr
- Unhealthy air days in 30 yrs
- 0 days/yr
Risk factors via First Street. Map © Google.
Why this score? — see what drove the D grade
The composite is a weighted blend of 9 inputs, each scored 0–100. Each bar is that input's sub-score; the figure is the points it added to the 100-point composite (weight × sub-score).
- Cash flow +13.1/30.0
- ARV discount +7.5/15.0
- Schools +4.0/10.0
- DSCR +3.9/10.0
- Livability +3.9/5.0
- 1% rule +3.7/10.0
- Rent growth +2.5/5.0
- Condition / age +2.2/5.0
- Appreciation +0.0/10.0
$135,000
🖨 Deal sheet 📄 Offer letter ✓ Due diligence
Listing remarks MLS
2 bedroom, 1 bath home located within walking distance to SRSU and local amenities. Perfect as a first home or investment property. Additional home available for purchase.
Key facts
- 6,969 sq ft lot
- Built 1940
- Listed 417 days
Neighborhood map
What this means for you Summary
Snapshot
- This is a 2-bed/1.0-bath single-family listed at $135k. Condition is rated fair.
Deal economics
- At list price, monthly cash flow is $-5 ($-55/yr) — negative.
- To cash-flow at today's rent, offer at most $134k (0.5% below list).
- To meet the 1% rule (rent ≥ 1% of price), the offer needs to be $118k (12.9% below list).
- Recommended offer: $118k (12.9% below list) — sets the bar for 1% rule.
Location & tenants
- Location reads 78/100 on livability (#73 in TX, #2,631 nationally) — a middle-class / working-renter tenant base. Strengths: crime A+, cost of living A+, housing A+; Watch: amenities D+, commute F, employment F.
- Alpine ISD (town): math 43% / reading 53% proficiency, ranked #235 of 826 in TX (top 28%) — families likely to look elsewhere, expect single-tenant / working-renter base with shorter leases.
- Market conditions: 167 active listings in the ZIP; 2 comparable units currently listed for rent nearby; 7 units permitted in Brewster County in 2024 (0 in 5+ unit buildings).
Forward outlook
- Local home prices are declining (-3.0%/yr); year-one equity from $933 of loan paydown is wiped out by about $4k of value loss. Plan a longer hold.
- Brewster County population projected at -17% by 2050 — secular population decline; favor cash flow + early exit over multi-decade hold.
Negotiation context
- It's been on market 418 days — a 12% lower offer ($119k) is reasonable based on typical stale-listing flexibility.
- 2 sale attempts with the ask held roughly flat each time — persistent listings suggest the price (not the market) is what's stuck; bring a comps-based counter.
Risks & watch-outs
- Watch-outs: built in 1940 — expect roof / HVAC / electrical / plumbing capex.
- Climate carrying-cost: major flood risk; severe wildfire risk — expect insurance premiums to compound above CPI over the hold.
Questions for the listing agent
- What do current leases actually rent for vs. the listed asking? Can we see a recent rent roll and the last 12 months of T-12 income?
- It's been on market 418 days. Have you received any prior offers? Is the seller open to a 13% concession, seller financing, or rate buy-down credit?
- Have any recent inspections been done? Can we get a copy of the seller's disclosures and any deferred-maintenance estimates?
- Built in 1940 — when were the roof, HVAC, electrical panel, plumbing, and water heater last replaced?
- Why hasn't it sold? Are there any deal-killer items the seller is aware of (foundation, flood, title, zoning, code violations)?
- Is there a deadline driving the sale (1031 exchange, divorce, estate, relocation)? That informs how much negotiation room exists.
- The area grade is low — what's the realistic commute time and amenity access for the typical tenant pool here? Any planned neighborhood developments (good or bad) we should know about?
- What's the average days-on-market for RENTAL listings here right now (not sales)? A rising rental-DOM trend means longer vacancies and softer asking-rent achievability than the comps imply.
- What's the recent tenant-quality profile in this submarket — average credit score on applications, eviction rate, late-payment / NSF rate, and stable-employment percentage? A property-management company in the area should have these aggregated.
- How much new for-sale + rental construction is in the pipeline within 1–3 miles? Heavy new supply typically softens prices + rents 12–24 months out; constrained supply supports both.
Investment metrics
- 1% rule
- 0.87% ✗
- Cap rate
- 6.25%
- Cash-on-cash
- -0.14%
- DSCR
- 0.99
- GRM
- 9.6
CMA / ARV
No comps found within radius.
Projected returns pro-forma
-3.0% appreciation · 3.0% rent growth · sell at horizon
- IRR
- -16.5%
- Equity multiple
- 0.41×
- Total profit
- $-22,148
- Equity at exit
- $20,129
- IRR
- -8.3%
- Equity multiple
- 0.48×
- Total profit
- $-19,587
- Equity at exit
- $11,672
Cash invested: $37,800 (down + closing). Projections, not guarantees.
Landlord ↔ Tenant lean methodology
- Overall (STATE)
- 87 Strongly Landlord-Friendly
- State Texas
- 87 Strongly Landlord-Friendly · R+5
- County
- — inherits STATE
- City
- — inherits STATE
ZIP-level market 79830
- Home prices YoY
- -32.6%
- Active inventory
- 167
- Price-to-rent
- 9.6×
Monthly cashflow live
- Estimated rent
- $1,175 medium interval (Pro) →
- Mortgage (P&I)
- −$708
- Tax est. 1.5%
- −$169 /mo · $2,025/yr
- Insurance
- −$56
- HOA
- −$0
- Vacancy / Maint / Mgmt
- −$247
- Net cashflow
- $-5
Break-even live
UW: 25.0% down · 7.5% · 30yr · 1.5% tax · 5.0% vac · 8.0% maint · 8.0% mgmt
Financing live
Cash to close
- Down payment
- $33,750
- Closing costs
- $4,050
- Reserves months
- —
- Total cash needed
- —
Loan-product check · same deal, 3 products live
Conventional
25% down · 7.5% · 30yr
- Down + closing
- —
- Monthly P&I
- —
- Monthly cashflow
- —
- DSCR
- —
- Eligible?
- —
Personal DTI + credit; lowest rate.
DSCR
20% down · 8.5% · 30yr
- Down + closing
- —
- Monthly P&I
- —
- Monthly cashflow
- —
- DSCR
- —
- Eligible?
- —
No personal income docs; deal must DSCR.
Hard money
10% down · 12.0% · 12mo
- Down + closing
- —
- Monthly P&I
- —
- Monthly cashflow
- —
- DSCR
- —
- Eligible?
- —
Short-term bridge; refi at stabilization.
Rent comps 2 comps
| Address | Beds | Baths | Sqft | Rent | $/sqft | DOM | Units | Dist |
|---|---|---|---|---|---|---|---|---|
| 504 East Ave E Unit 3 Alpine, TX | 1.0 | 1.0 | 700 | $750 | $1.07 | 14d | 1 | 0.04mi |
| 1104 Lechuguilla Alpine, TX | 1.0 | 1.0 | 700 | $801 | $1.14 | 43d | 1 | 0.85mi |
Listing history 12 events
-
2026-06-10days on market $135,000 Active 418 DOM
-
2026-06-09days on market $135,000 Active 417 DOM
-
2026-06-08days on market $135,000 Active 416 DOM
-
2026-06-07days on market $135,000 Active 415 DOM
-
2026-06-03days on market $135,000 Active 411 DOM
-
2026-06-02days on market $135,000 Active 410 DOM
-
2026-06-01days on market $135,000 Active 409 DOM
-
2026-05-31days on market $135,000 Active 408 DOM
-
2026-05-31days on market $135,000 Active 407 DOM
-
2026-01-02status Active 171-char remark
Show marketing remark (171 chars)
2 bedroom, 1 bath home located within walking distance to SRSU and local amenities. Perfect as a first home or investment property. Additional home available for purchase.
-
2026-01-01historical 171-char remark
Show marketing remark (171 chars)
2 bedroom, 1 bath home located within walking distance to SRSU and local amenities. Perfect as a first home or investment property. Additional home available for purchase.
-
2025-04-17$135,000 Active 171-char remark
Show marketing remark (171 chars)
2 bedroom, 1 bath home located within walking distance to SRSU and local amenities. Perfect as a first home or investment property. Additional home available for purchase.
ⓘ Source: listings_history table (triggers on properties + properties_extension) + one-shot
backfill from property_details.listing_events for pre-trigger history.
Climate risk First Street
- Flood 6/10 Major 68% chance over 30 yrs
- Wildfire 9/10 Extreme
- Heat 4/10 Moderate 5 d/yr ≥95°F today · 13 d/yr by 30 yrs out
- Wind 1/10 Low
- Air quality 1/10 Low 0 unhealthy d/yr today · 0 by 30 yrs out
Nearby sold comps map
Loading sold comps map…
Walkable amenities ~0.75 mi
Loading nearby amenities…
Taxation est. · year 1
- Rental income
- $14,102
- − Mortgage interest
- −$7,562
- − Property taxes
- −$2,025
- − Insurance
- −$675
- − Repairs & maintenance
- −$1,128
- − Management
- −$1,128
- − Depreciation
- −$3,927
- Taxable loss
- −$2,343
- Est. tax savings @ 24.0%
- +$562
- After-tax cash flow
- $508/yr
For passive investors: Depreciation is non-cash, so a rental often shows a tax loss while cash-flowing — sheltering income. Rental losses are passive: they offset passive income freely, and up to $25,000/yr can offset ordinary (W-2) income if you actively participate and your MAGI is under $100k (phasing out to $0 by $150k); unused losses carry forward. On sale, claimed depreciation is recaptured at up to 25%, and gains may owe capital-gains tax (a 1031 exchange can defer both). Figures are a year-1 estimate at your 24.0% rate — not tax advice; consult a CPA.
Condition & rehab AI · 11 photos
This 2-bedroom home requires moderate renovations to improve its condition and increase its value. Key areas for improvement include the kitchen, bathroom, roof, and exterior. Painting, flooring replacement, and window repairs are essential to enhance both the resale and rental value.
Repairs flagged
- Major kitchen countertops — severely worn and need replacement
- Major bathroom fixtures — dated and need updating
- Major roof — visible wear and potential leaks
- Major exterior siding — moderate wear and need repainting
Value-add opportunities
- Both paint interior walls — enhances curb appeal and interior aesthetics
- Both replace worn flooring — improves living space and reduces maintenance costs
- Both repair and replace windows — increases natural light and reduces energy costs
Renovation cost estimate screening
| Repair item | Severity | Est. cost |
|---|---|---|
| kitchen countertops · severely worn and need replacement | Major | $15,000–50,000 |
| bathroom fixtures · dated and need updating | Major | $15,000–50,000 |
| roof · visible wear and potential leaks | Major | $15,000–50,000 |
| exterior siding · moderate wear and need repainting | Major | $15,000–50,000 |
| Total estimated repair cost · 4 items | $60,000–200,000 |
Value-add ROI direction
- Both paint interior walls — enhances curb appeal and interior aesthetics ↑
- Both replace worn flooring — improves living space and reduces maintenance costs ↑
- Both repair and replace windows — increases natural light and reduces energy costs ↑
ⓘ Cost ranges are severity-bucket heuristics (US national rule-of-thumb). Get contractor quotes + a written scope before underwriting a rehab budget.
Schools (NCES district)
- District
- Alpine ISD
- NCES district ID
- 4807950
- Math proficiency
- 43% ▼ -4.00%
- Reading proficiency
- 53% ▲ 2.00%
- Median HH income
- $39,184
- Composite
- 40.06/100
- National rank
- #3814
- State rank
- #235 of 826 in TX
Livability — Alpine
- Score
- 78/100
- State rank
- #73
- US rank
- #2631
Category grades
Schools grade is shown separately in the Schools card above.
Census & demographics
- Census place
- Alpine, TX
- County
- Brewster County · 7,853 people
- City population
- 7,853
- Metro
- nan
- Population (ZIP)
- 7,853
- Household income
- $66,546
- Rent vs Own
- Severe rent burden
- 229.0
Population outlook (Brewster County) Hauer SSP2
- Today (2025)
- 8,850 people
- By 2030
- 8,577 · -3.1%
- By 2040
- 7,903 · -10.7%
- By 2050
- 7,338 · -17.1%
- By 2075
- 5,950 · -32.8%
- By 2100
- 4,678 · -47.1%
Race, ethnicity, and origin ACS 2023
- Neighborhood character
- Majority White (52%)
- Race & ethnicity
- White 52% Hispanic / Latino 46% Two or more races 15% Asian 1%
- Hispanic origin (detail)
- Mexican 37%
- Common ancestry
- Serbian 5% Slovak 3% Romanian 2%
- Foreign-born
- 9% · Canada
- Languages at home
- 69% English-only · Spanish 29% Tagalog/Filipino 1%
Political lean MEDSL · Brewster
- 2024 margin
- R (+12.6) · D 43.0% · R 55.6% · Other 1.4%
- 2008→2024 swing
- -15.5pp toward R · 2008: 3.0pp · 2024: -12.6pp
- All cycles
- 2024: R+12.6 2020: R+4.2 2016: R+4.8 2012: R+5.4 2008: D+3.0
Not yet ingested
- Civics
- —
Market trends
- HPI YoY
- ▼ -86.21%
- Current HPI
- 178.4899
- Rent YoY
- —
- Metro
- nan
- State GDP YoY
- ▲ 3.95%
- F500 in state
- 110
Industry mix (Fortune 500 HQ in TX)
| Industry | F500 HQs | Revenue |
|---|---|---|
| Energy | 16 | $1,198B |
|
||
| Technology | 5 | $198B |
|
||
| Engineering / Construction | 4 | $72B |
|
||
| Energy Services | 3 | $60B |
|
||
| Utilities | 3 | $41B |
|
||
| Healthcare | 2 | $330B |
|
||
Price history
3 events — show timeline
- 2026-01-02 Relisted — ODMLS
- 2026-01-01 Delisted — ODMLS
- 2025-04-17 Listed $135,000 ODMLS
Cash-flow waterfall
monthlySold comps — $/sqft
last 12 mo · ≤1 miLoading sold comps…