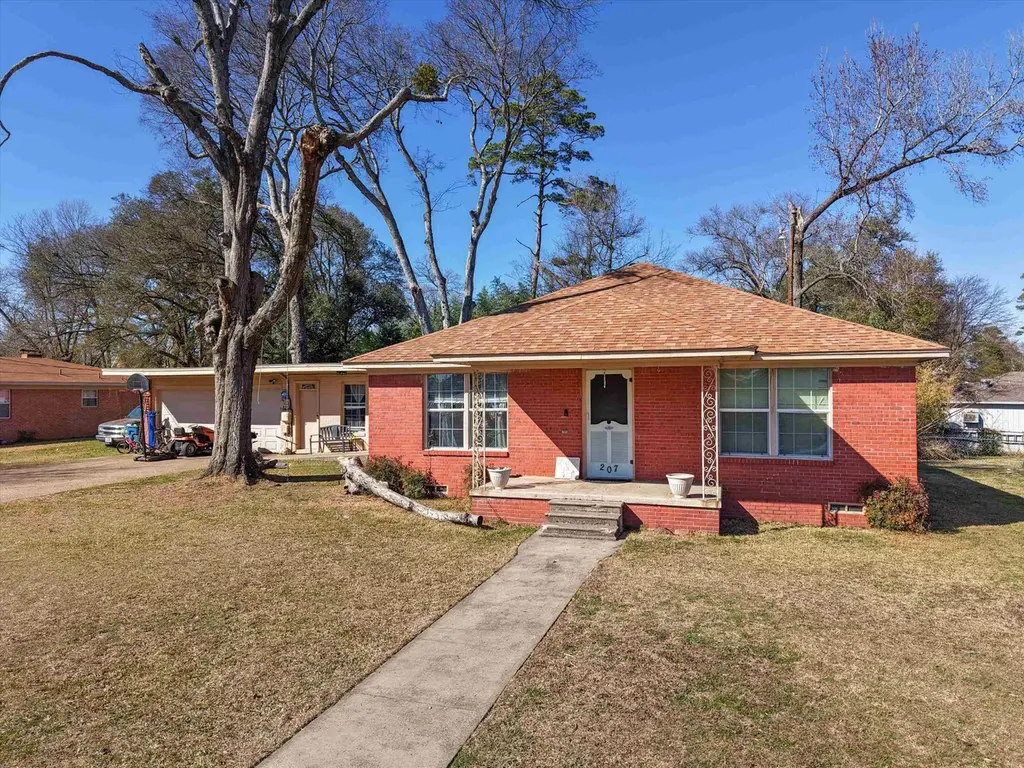
207 Lafayette · Gladewater, TX
Flood risk 1/10 · Minimal
- FEMA flood zone
- X (unshaded)
- Chance of flooding over 30 yrs
- 0.0%
- Est. flood insurance / yr
- $507 – $1,088
Fire risk 5/10 · Moderate
- Est. fire insurance / yr
- $1,222 – $2,270
Heat risk 7/10 · Major
- Hot days now (above 110°F)
- 7 days/yr
- Hot days in 30 yrs
- 25 days/yr
Wind risk 6/10 · Moderate
- Chance of severe wind over 30 yrs
- 52.0%
Air-quality risk 2/10 · Minimal
- Unhealthy air days now
- 0 days/yr
- Unhealthy air days in 30 yrs
- 1 days/yr
Risk factors via First Street. Map © Google.
Why this score? — see what drove the C- grade
The composite is a weighted blend of 9 inputs, each scored 0–100. Each bar is that input's sub-score; the figure is the points it added to the 100-point composite (weight × sub-score).
- Cash flow +15.4/30.0
- ARV discount +15.0/15.0
- 1% rule +4.7/10.0
- DSCR +4.7/10.0
- Livability +3.2/5.0
- Schools +2.7/10.0
- Rent growth +2.5/5.0
- Condition / age +2.5/5.0
- Appreciation +0.0/10.0
$188,000
🖨 Deal sheet 📄 Offer letter ✓ Due diligence
Listing remarks MLS
Charming Red Brick Home in Gladewater - Warm, Welcoming & Priced Right! This adorable red brick home offers comfort, character, and value on a spacious lit. Featuring 3 bedrooms, 1 bath, and a 2-car garage, this property is perfect for anyone looking for a cozy home with extra flexibility. Inside, you’ll find a warm and inviting atmosphere with a bonus living space that can easily serve as a second living area, home office, playroom, or even a potential fourth bedroom. The kitchen features charming open shelving upper cabinets, adding personality and a modern farmhouse touch. Step outside to enjoy the generous yard space — ideal for gardening, pets, entertaining, or simply relaxing. 3 Bedrooms | 1 Bath 2-Car Garage Bonus Living / Multi-Use Room Open Shelving Kitchen Accents Spacious 0.3 Acre Lot Warm & Inviting Feel Cute, comfortable, and priced to sell at just $189,000 - this Gladewater gem is ready to welcome you home!
Key facts
- Spacious lot
- Bonus living room
- Generous yard space
Tags
Neighborhood map
What this means for you Summary
Snapshot
- This is a 3-bed/2.0-bath single-family listed at $188k.
Deal economics
- At list price, monthly cash flow is $74 ($885/yr) — positive.
- The deal already cash-flows at list — no discount required.
- To meet the 1% rule (rent ≥ 1% of price), the offer needs to be $183k (2.7% below list).
- Recommended offer: $171k (9.0% below list) — sets the bar for market timing.
- Cap rate 6.8% vs local median 5.0% in Gladewater — top-decile yield for the area; either an underpriced asset or a hidden risk that comps aren't pricing in. Stress-test before assuming the spread holds.
Location & tenants
- Location reads 64/100 on livability (#805 in TX) — a middle-class / working-renter tenant base. Strengths: cost of living A+, housing A; Watch: crime C-, schools D+, amenities F.
- Gladewater ISD (suburban): math 29% / reading 34% proficiency, ranked #594 of 826 in TX (top 72%) — families likely to look elsewhere, expect single-tenant / working-renter base with shorter leases; 63% free/reduced lunch — lower-income household profile, screen leases tightly.
- Market conditions: 178 active listings in the ZIP; 193 units permitted in Gregg County in 2024 (0 in 5+ unit buildings).
Forward outlook
- Local home prices are declining (-3.0%/yr); year-one equity from $1k of loan paydown is wiped out by about $6k of value loss. Plan a longer hold.
Negotiation context
- It's been on market 119 days — a 9% lower offer ($171k) is reasonable based on typical stale-listing flexibility.
- 3 sale attempts since 6y ago with the ask held roughly flat each time — persistent listings suggest the price (not the market) is what's stuck; bring a comps-based counter.
Risks & watch-outs
- Watch-outs: built in 1945 — expect roof / HVAC / electrical / plumbing capex.
- Climate carrying-cost: major wind risk, 52% chance of damaging wind over 30y; moderate wildfire risk; extreme-heat days projected 7→25/yr by 2055 (HVAC capex compounding) — expect insurance premiums to compound above CPI over the hold.
Questions for the listing agent
- It's been on market 119 days. Have you received any prior offers? Is the seller open to a 9% concession, seller financing, or rate buy-down credit?
- Built in 1945 — when were the roof, HVAC, electrical panel, plumbing, and water heater last replaced?
- Why hasn't it sold? Are there any deal-killer items the seller is aware of (foundation, flood, title, zoning, code violations)?
- Is there a deadline driving the sale (1031 exchange, divorce, estate, relocation)? That informs how much negotiation room exists.
- Schools are D-rated, which usually means shorter tenancies and higher turnover. Who's the typical renter profile here, and what's been the actual vacancy rate?
- What's the average days-on-market for RENTAL listings here right now (not sales)? A rising rental-DOM trend means longer vacancies and softer asking-rent achievability than the comps imply.
- What's the recent tenant-quality profile in this submarket — average credit score on applications, eviction rate, late-payment / NSF rate, and stable-employment percentage? A property-management company in the area should have these aggregated.
- How much new for-sale + rental construction is in the pipeline within 1–3 miles? Heavy new supply typically softens prices + rents 12–24 months out; constrained supply supports both.
Investment metrics
- 1% rule
- 0.97% ✗
- Cap rate
- 6.76%
- Cash-on-cash
- 1.68%
- DSCR
- 1.07
- GRM
- 8.6
CMA / ARV
- ARV (median comp)
- $249,968
- List price
- $188,000
- Delta
- -24.79%
- Verdict
- UNDERPRICED
- Comps
- 5 within 1.0 mi
Show comp detail 3 sales within ~0.75 mi
| Address | Dist | Beds/Ba | Sqft | Sold | Price | $/sf | Match |
|---|---|---|---|---|---|---|---|
| 605 Briarwood Dr | 0.26mi | 3/2.0 | 1,916 (-9%) | 2mo | $249,900 | $130 | 71 |
| 593 Briarwood Dr | 0.26mi | 3/2.0 | 1,917 (-9%) | 8mo | $289,900 | $151 | 66 |
| 804 Willow | 0.12mi | 4/2.5 (+1) | 2,370 (+12%) | 19mo | $259,000 | $109 | 51 |
Match score weights: distance 35% · size 25% · config 20% · recency 20%. Top-matched comps best support the ARV.
Projected returns pro-forma
-3.0% appreciation · 3.0% rent growth · sell at horizon
- IRR
- -13.6%
- Equity multiple
- 0.51×
- Total profit
- $-25,696
- Equity at exit
- $28,031
- IRR
- -4.6%
- Equity multiple
- 0.70×
- Total profit
- $-16,037
- Equity at exit
- $16,255
Cash invested: $52,640 (down + closing). Projections, not guarantees.
Landlord ↔ Tenant lean methodology
- Overall (STATE)
- 87 Strongly Landlord-Friendly
- State Texas
- 87 Strongly Landlord-Friendly · R+5
- County
- — inherits STATE
- City
- — inherits STATE
ZIP-level market 75647
- Home prices YoY
- -8.2%
- Active inventory
- 178
- Price-to-rent
- 8.6×
Monthly cashflow live
- Estimated rent
- $1,829 medium interval (Pro) →
- Mortgage (P&I)
- −$986
- Tax from tax record
- −$307 /mo · $3,681/yr
- Insurance
- −$78
- HOA
- −$0
- Vacancy / Maint / Mgmt
- −$384
- Net cashflow
- $74
Break-even live
UW: 25.0% down · 7.5% · 30yr · 1.5% tax · 5.0% vac · 8.0% maint · 8.0% mgmt
Financing live
Cash to close
- Down payment
- $47,000
- Closing costs
- $5,640
- Reserves months
- —
- Total cash needed
- —
Loan-product check · same deal, 3 products live
Conventional
25% down · 7.5% · 30yr
- Down + closing
- —
- Monthly P&I
- —
- Monthly cashflow
- —
- DSCR
- —
- Eligible?
- —
Personal DTI + credit; lowest rate.
DSCR
20% down · 8.5% · 30yr
- Down + closing
- —
- Monthly P&I
- —
- Monthly cashflow
- —
- DSCR
- —
- Eligible?
- —
No personal income docs; deal must DSCR.
Hard money
10% down · 12.0% · 12mo
- Down + closing
- —
- Monthly P&I
- —
- Monthly cashflow
- —
- DSCR
- —
- Eligible?
- —
Short-term bridge; refi at stabilization.
Listing history 24 events
-
2026-06-19days on market $188,000 Active 119 DOM
-
2026-06-18days on market $188,000 Active 118 DOM
-
2026-06-17days on market $188,000 Active 117 DOM
-
2026-06-16days on market $188,000 Active 116 DOM
-
2026-06-15days on market $188,000 Active 115 DOM
-
2026-06-14days on market $188,000 Active 113 DOM
-
2026-06-13days on market $188,000 Active 112 DOM
-
2026-06-10days on market $188,000 Active 110 DOM
-
2026-06-09days on market $188,000 Active 109 DOM
-
2026-06-08days on market $188,000 Active 108 DOM
-
2026-06-07days on market $188,000 Active 107 DOM
-
2026-06-03days on market $188,000 Active 103 DOM
-
2026-06-02days on market $188,000 Active 102 DOM
-
2026-06-01days on market $188,000 Active 101 DOM
-
2026-05-31days on market $188,000 Active 100 DOM
-
2026-05-30days on market $188,000 Active 99 DOM
-
2026-02-20$189,000 Active 960-char remark
Show marketing remark (960 chars)
Charming Red Brick Home in Gladewater - Warm, Welcoming & Priced Right! This adorable red brick home offers comfort, character, and value on a spacious lit. Featuring 3 bedrooms, 1 bath, and a 2-car garage, this property is perfect for anyone looking for a cozy home with extra flexibility. Inside, you’ll find a warm and inviting atmosphere with a bonus living space that can easily serve as a second living area, home office, playroom, or even a potential fourth bedroom. The kitchen features charming open shelving upper cabinets, adding personality and a modern farmhouse touch. Step outside to enjoy the generous yard space — ideal for gardening, pets, entertaining, or simply relaxing. 3 Bedrooms | 1 Bath 2-Car Garage Bonus Living / Multi-Use Room Open Shelving Kitchen Accents Spacious 0.3 Acre Lot Warm & Inviting Feel Cute, comfortable, and priced to sell at just $189,000 - this Gladewater gem is ready to welcome you home!
-
2021-11-29soldstatus
-
2021-11-24soldstatus 252-char remark
Show marketing remark (252 chars)
This 3 bedroom 2 bath home in a established neighborhood in Gladewater, TX has new flooring in bedrooms, original hardwoods in living and a Brick style tile in family room/bonus space. This home does need some love, but the final potential is amazing.
-
2021-09-28$129,000 252-char remark
Show marketing remark (252 chars)
This 3 bedroom 2 bath home in a established neighborhood in Gladewater, TX has new flooring in bedrooms, original hardwoods in living and a Brick style tile in family room/bonus space. This home does need some love, but the final potential is amazing.
-
2020-11-03soldstatus
-
2020-10-30soldstatus
-
2020-08-13$85,000
-
1987-04-01soldstatus
ⓘ Source: listings_history table (triggers on properties + properties_extension) + one-shot
backfill from property_details.listing_events for pre-trigger history.
Tax reassessment forecast TX · Resets to sale price
- Current annual tax
- $3,681 · $307/mo
- Projected year-2 tax
- $3,681 · $307/mo
- Expected delta
- $0/yr ($0/mo · 0.0%)
ⓘ Screening estimate from a state-policy table — verify with the county assessor before closing.
Climate risk First Street
- Flood 1/10 Low FEMA zone X (unshaded) · 0% chance over 30 yrs
- Wildfire 5/10 Major
- Heat 7/10 Severe 7 d/yr ≥110°F today · 25 d/yr by 30 yrs out
- Wind 6/10 Major 52% chance of damaging wind over 30 yrs
- Air quality 2/10 Low 0 unhealthy d/yr today · 1 by 30 yrs out
Nearby sold comps map
Loading sold comps map…
Walkable amenities ~0.75 mi
Loading nearby amenities…
Taxation est. · year 1
- Rental income
- $21,945
- − Mortgage interest
- −$10,531
- − Property taxes
- −$3,681
- − Insurance
- −$940
- − Repairs & maintenance
- −$1,756
- − Management
- −$1,756
- − Depreciation
- −$5,469
- Taxable loss
- −$2,187
- Est. tax savings @ 24.0%
- +$525
- After-tax cash flow
- $1,410/yr
For passive investors: Depreciation is non-cash, so a rental often shows a tax loss while cash-flowing — sheltering income. Rental losses are passive: they offset passive income freely, and up to $25,000/yr can offset ordinary (W-2) income if you actively participate and your MAGI is under $100k (phasing out to $0 by $150k); unused losses carry forward. On sale, claimed depreciation is recaptured at up to 25%, and gains may owe capital-gains tax (a 1031 exchange can defer both). Figures are a year-1 estimate at your 24.0% rate — not tax advice; consult a CPA.
Schools (NCES district)
- District
- Gladewater ISD
- NCES district ID
- 4820760
- Math proficiency
- 29% ▼ -12.00%
- Reading proficiency
- 34% ▼ -1.00%
- Median HH income
- $41,485
- Composite
- 26.62/100
- National rank
- #7177
- State rank
- #594 of 826 in TX
Livability — Gladewater
- Score
- 64/100
- State rank
- #805
- US rank
- #14670
Category grades
Schools grade is shown separately in the Schools card above.
Census & demographics
- Census place
- Gladewater, TX
- Population (ZIP)
- 13,457
Population outlook (Gregg County) Hauer SSP2
- Today (2025)
- 125,947 people
- By 2030
- 126,542 · +0.5%
- By 2040
- 127,311 · +1.1%
- By 2050
- 127,289 · +1.1%
- By 2075
- 124,954 · -0.8%
- By 2100
- 113,737 · -9.7%
Race, ethnicity, and origin ACS 2023
- Neighborhood character
- Predominantly White (73%)
- Race & ethnicity
- White 73% Black 12% Hispanic / Latino 9% Two or more races 8%
- Hispanic origin (detail)
- Mexican 8%
- Common ancestry
- Serbian 3% Slovak 2% Italian 2%
- Foreign-born
- 3% · Canada
- Languages at home
- 96% English-only · Spanish 4%
Political lean MEDSL · Gregg
- 2024 margin
- Solid R (+42.2) · D 28.5% · R 70.7%
- 2008→2024 swing
- -4.6pp toward R · 2008: -37.6pp · 2024: -42.2pp
- All cycles
- 2024: R+42.2 2020: R+36.9 2016: R+41.3 2012: R+39.5 2008: R+37.6
Not yet ingested
- Civics
- —
Market trends
- HPI YoY
- ▼ -27.12%
- Current HPI
- 303.1316
- Rent YoY
- —
- Metro
- —
- State GDP YoY
- ▲ 3.95%
- F500 in state
- 110
Industry mix (Fortune 500 HQ in TX)
| Industry | F500 HQs | Revenue |
|---|---|---|
| Energy | 16 | $1,198B |
|
||
| Technology | 5 | $198B |
|
||
| Engineering / Construction | 4 | $72B |
|
||
| Energy Services | 3 | $60B |
|
||
| Utilities | 3 | $41B |
|
||
| Healthcare | 2 | $330B |
|
||
Price history
+122.4% since first listed8 events — show timeline
- 2026-02-20 Listed $189,000 LAAR
- 2021-11-29 Sold (Public Records) — Public Records
- 2021-11-24 Sold (MLS) — LAAR
- 2021-09-28 Listed $129,000 LAAR
- 2020-11-03 Sold (Public Records) — Public Records
- 2020-10-30 Sold (MLS) — LAAR
- 2020-08-13 Listed $85,000 LAAR
- 1987-04-01 Sold (Public Records) — Public Records
Property tax history
+4.0%/yrLatest (2025): $3,681 · -0.8% YoY. Source: county tax records.
Cash-flow waterfall
monthlySold comps — $/sqft
last 12 mo · ≤1 miLoading sold comps…