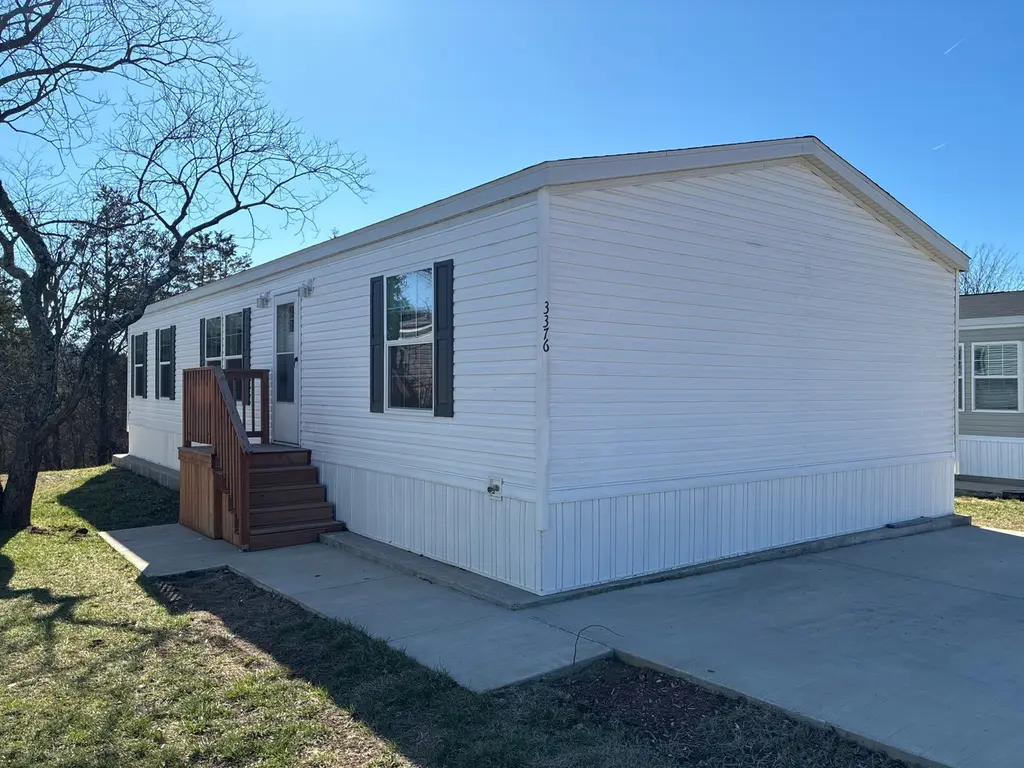
3376 Marigold Rd #228 · Imperial, MO
Flood risk 1/10 · Minimal
- FEMA flood zone
- X (unshaded)
- Chance of flooding over 30 yrs
- 0.0%
- Est. flood insurance / yr
- $507 – $1,088
Fire risk 4/10 · Minor
- Est. fire insurance / yr
- $1,054 – $1,958
Heat risk 4/10 · Minor
- Hot days now (above 107°F)
- 7 days/yr
- Hot days in 30 yrs
- 21 days/yr
Wind risk 2/10 · Minimal
- Chance of severe wind over 30 yrs
- 1.0%
Air-quality risk 3/10 · Minor
- Unhealthy air days now
- 1 days/yr
- Unhealthy air days in 30 yrs
- 4 days/yr
Risk factors via First Street. Map © Google.
Why this score? — see what drove the B grade
The composite is a weighted blend of 9 inputs, each scored 0–100. Each bar is that input's sub-score; the figure is the points it added to the 100-point composite (weight × sub-score).
- Cash flow +30.0/30.0
- 1% rule +10.0/10.0
- DSCR +10.0/10.0
- ARV discount +7.5/15.0
- Condition / age +4.0/5.0
- Schools +3.8/10.0
- Livability +3.1/5.0
- Rent growth +2.5/5.0
- Appreciation +0.0/10.0
$81,000
🖨 Deal sheet (PDF) 📄 Offer letter ✓ Due diligence
Listing remarks MLS
* THIS IS A RESALE LISTING * This welcoming, well-maintained 3 bedroom, 2 bathroom home is a perfect place to raise your family. For your convenience, we have onsite community management to assist you when you need it. With our family-friendly community amenities such as community events, , and , your family will be excited to live here. This home won't be on the market long, so call us today for more information or to schedule a tour. Deposits & Fees are subject to change.
Key facts
- Built 2026
- Listed 74 days
Neighborhood map
What this means for you Summary
Snapshot
- This is a 3-bed/2.0-bath manufactured listed at $81k. Condition is rated good.
Deal economics
- At list price, monthly cash flow is $750 ($9k/yr) — positive.
- The deal already cash-flows at list — no discount required.
- Meets the 1% rule at list price ($2k rent vs $81k).
- Recommended offer: $76k (6.0% below list) — sets the bar for market timing.
- Cap rate 17.4% vs local median 3.3% in Imperial — top-decile yield for the area; either an underpriced asset or a hidden risk that comps aren't pricing in. Stress-test before assuming the spread holds.
Location & tenants
- Location reads 62/100 on livability (#389 in MO) — a middle-class / working-renter tenant base. Strengths: cost of living A+, housing A+, crime B; Watch: schools D+, amenities F, commute F.
- Fox C-6 (suburban): math 35% / reading 50% proficiency, ranked #103 of 324 in MO (top 32%) — families likely to look elsewhere, expect single-tenant / working-renter base with shorter leases.
- Market conditions: 123 active listings in the ZIP; solid renter incomes; 807 units permitted in Jefferson County in 2024 (104 in 5+ unit buildings).
Forward outlook
- Local home prices are declining (-3.0%/yr); year-one equity from $560 of loan paydown is wiped out by about $2k of value loss. Plan a longer hold.
- At projected returns (-3.0% appreciation + 3.0% rent growth), your $23k cash investment doubles in ~3 years — after that, you're playing with house money.
Negotiation context
- It's been on market 75 days — a 6% lower offer ($76k) is reasonable based on typical stale-listing flexibility.
Questions for the listing agent
- It's been on market 75 days. Have you received any prior offers? Is the seller open to a 6% concession, seller financing, or rate buy-down credit?
- Why hasn't it sold? Are there any deal-killer items the seller is aware of (foundation, flood, title, zoning, code violations)?
- Is there a deadline driving the sale (1031 exchange, divorce, estate, relocation)? That informs how much negotiation room exists.
- Schools are D-rated, which usually means shorter tenancies and higher turnover. Who's the typical renter profile here, and what's been the actual vacancy rate?
- What's the average days-on-market for RENTAL listings here right now (not sales)? A rising rental-DOM trend means longer vacancies and softer asking-rent achievability than the comps imply.
- What's the recent tenant-quality profile in this submarket — average credit score on applications, eviction rate, late-payment / NSF rate, and stable-employment percentage? A property-management company in the area should have these aggregated.
- How much new for-sale + rental construction is in the pipeline within 1–3 miles? Heavy new supply typically softens prices + rents 12–24 months out; constrained supply supports both.
Investment metrics
- 1% rule
- 2.05% ✓
- Cap rate
- 17.41%
- Cash-on-cash
- 39.71%
- DSCR
- 2.77
- GRM
- 4.1
CMA / ARV
No comps found within radius.
Projected returns pro-forma
-3.0% appreciation · 3.0% rent growth · sell at horizon
- IRR
- 36.0%
- Equity multiple
- 2.53×
- Total profit
- $34,696
- Equity at exit
- $12,077
- IRR
- 42.7%
- Equity multiple
- 5.05×
- Total profit
- $91,859
- Equity at exit
- $7,003
Cash invested: $22,680 (down + closing). Projections, not guarantees.
Landlord ↔ Tenant lean methodology
- Overall (STATE)
- 81 Strongly Landlord-Friendly
- State Missouri
- 81 Strongly Landlord-Friendly · R+10
- County
- — inherits STATE
- City
- — inherits STATE
ZIP-level market 63052
- Active inventory
- 123
- Price-to-rent
- 4.1×
Monthly cashflow live
- Estimated rent
- $1,658 medium interval (Pro) →
- Mortgage (P&I)
- −$425
- Tax est. 1.5%
- −$101 /mo · $1,215/yr
- Insurance
- −$34
- HOA
- −$0
- Vacancy / Maint / Mgmt
- −$348
- Net cashflow
- $750
Break-even live
Sensitivity live
| Price | -10% $806 | -5% $778 | +0% $750 | +5% $722 | +10% $694 |
|---|---|---|---|---|---|
| Rent | -10% $619 | -5% $685 | +0% $750 | +5% $816 | +10% $881 |
| Rate | -1.0pp $791 | -0.5pp $771 | base $750 | +0.5pp $729 | +1.0pp $708 |
UW: 25.0% down · 7.5% · 30yr · 1.5% tax · 5.0% vac · 8.0% maint · 8.0% mgmt
Financing live
Cash to close
- Down payment
- $20,250
- Closing costs
- $2,430
- Reserves months
- —
- Total cash needed
- —
Loan-product check · same deal, 3 products live
Conventional
25% down · 7.5% · 30yr
- Down + closing
- —
- Monthly P&I
- —
- Monthly cashflow
- —
- DSCR
- —
- Eligible?
- —
Personal DTI + credit; lowest rate.
DSCR
20% down · 8.5% · 30yr
- Down + closing
- —
- Monthly P&I
- —
- Monthly cashflow
- —
- DSCR
- —
- Eligible?
- —
No personal income docs; deal must DSCR.
Hard money
10% down · 12.0% · 12mo
- Down + closing
- —
- Monthly P&I
- —
- Monthly cashflow
- —
- DSCR
- —
- Eligible?
- —
Short-term bridge; refi at stabilization.
Listing history 1 events
-
2026-03-11$81,000 Active 487-char remark
Show marketing remark (487 chars)
* THIS IS A RESALE LISTING * This welcoming, well-maintained 3 bedroom, 2 bathroom home is a perfect place to raise your family. For your convenience, we have onsite community management to assist you when you need it. With our family-friendly community amenities such as community events, , and , your family will be excited to live here. This home won't be on the market long, so call us today for more information or to schedule a tour. Deposits & Fees are subject to change.
ⓘ Source: listings_history table (triggers on properties + properties_extension) + one-shot
backfill from property_details.listing_events for pre-trigger history.
Climate risk First Street
- Flood 1/10 Low FEMA zone X (unshaded) · 0% chance over 30 yrs
- Wildfire 4/10 Moderate
- Heat 4/10 Moderate 7 d/yr ≥107°F today · 21 d/yr by 30 yrs out
- Wind 2/10 Low 100% chance of damaging wind over 30 yrs
- Air quality 3/10 Moderate 1 unhealthy d/yr today · 4 by 30 yrs out
Nearby sold comps map
Loading sold comps map…
Walkable amenities ~0.75 mi
Loading nearby amenities…
Taxation est. · year 1
- Rental income
- $19,902
- − Mortgage interest
- −$4,537
- − Property taxes
- −$1,215
- − Insurance
- −$405
- − Repairs & maintenance
- −$1,592
- − Management
- −$1,592
- − Depreciation
- −$2,356
- Taxable income
- $8,204
- Est. tax owed @ 24.0%
- −$1,969
- After-tax cash flow
- $7,036/yr
For passive investors: Depreciation is non-cash, so a rental often shows a tax loss while cash-flowing — sheltering income. Rental losses are passive: they offset passive income freely, and up to $25,000/yr can offset ordinary (W-2) income if you actively participate and your MAGI is under $100k (phasing out to $0 by $150k); unused losses carry forward. On sale, claimed depreciation is recaptured at up to 25%, and gains may owe capital-gains tax (a 1031 exchange can defer both). Figures are a year-1 estimate at your 24.0% rate — not tax advice; consult a CPA.
Condition & rehab AI · 12 photos
This well-maintained, modern mobile home is move-in ready and offers a great value for both resale and rental markets.
Value-add opportunities
- Both Paint exterior siding — Fresh paint can enhance curb appeal and property value
- Both Replace ceiling fans with modern fixtures — Modern fans can improve aesthetics and energy efficiency
- Both Install smart home devices — Smart home devices can increase property value and attract tech-savvy buyers
Renovation cost estimate screening
Value-add ROI direction
- Both Paint exterior siding — Fresh paint can enhance curb appeal and property value ↑
- Both Replace ceiling fans with modern fixtures — Modern fans can improve aesthetics and energy efficiency ↑
- Both Install smart home devices — Smart home devices can increase property value and attract tech-savvy buyers ↑
ⓘ Cost ranges are severity-bucket heuristics (US national rule-of-thumb). Get contractor quotes + a written scope before underwriting a rehab budget.
Schools (NCES district)
- District
- Fox C-6
- NCES district ID
- 2912300
- Math proficiency
- 35% ▼ -11.00%
- Reading proficiency
- 50% ▼ -4.00%
- Median HH income
- $60,849
- Composite
- 37.54/100
- National rank
- #4392
- State rank
- #103 of 324 in MO
Livability — Imperial
- Score
- 62/100
- State rank
- #389
- US rank
- #16900
Category grades
Schools grade is shown separately in the Schools card above.
Census & demographics
- County
- Jefferson County · 108,544 people
- City population
- 28,712
- Metro
- St. Louis, MO-IL
- Population (ZIP)
- 28,712
- Household income
- $92,922
- Rent vs Own
- Severe rent burden
- 333.0
Population outlook (Jefferson County) Hauer SSP2
- Today (2025)
- 235,088 people
- By 2030
- 238,365 · +1.4%
- By 2040
- 240,156 · +2.2%
- By 2050
- 234,651 · -0.2%
- By 2075
- 214,569 · -8.7%
- By 2100
- 179,697 · -23.6%
Race, ethnicity, and origin ACS 2023
- Neighborhood character
- Predominantly White (91%)
- Race & ethnicity
- White 91% Two or more races 4% Hispanic / Latino 3% Black 1%
- Common ancestry
- Lithuanian 5% Romanian 2% Italian 2%
- Foreign-born
- 2% · Canada
- Languages at home
- 97% English-only · Spanish 2%
Political lean MEDSL · Jefferson
- 2024 margin
- Solid R (+36.7) · D 31.0% · R 67.7% · Other 1.3%
- 2008→2024 swing
- -39.3pp toward R · 2008: 2.5pp · 2024: -36.7pp
- All cycles
- 2024: R+36.7 2020: R+33.9 2016: R+35.3 2012: R+12.7 2008: D+2.5
Not yet ingested
- Civics
- —
Market trends
- HPI YoY
- ▼ -210.31%
- Current HPI
- 196.6159
- Rent YoY
- —
- Metro
- St. Louis, MO-IL
- State GDP YoY
- ▲ 1.84%
- F500 in state
- 20
Industry mix (Fortune 500 HQ in MO)
| Industry | F500 HQs | Revenue |
|---|---|---|
| Healthcare | 1 | $163B |
|
||
| Insurance | 1 | $21B |
|
||
| Industrial Technology | 1 | $17B |
|
||
| Retail | 1 | $16B |
|
||
| Industrial Distribution | 1 | $10B |
|
||
| Utilities | 1 | $9B |
|
||
Price history
1 event — show timeline
- 2026-03-11 Listed $81,000 Zillow
Cash-flow waterfall
monthlySold comps — $/sqft
last 12 mo · ≤1 miLoading sold comps…