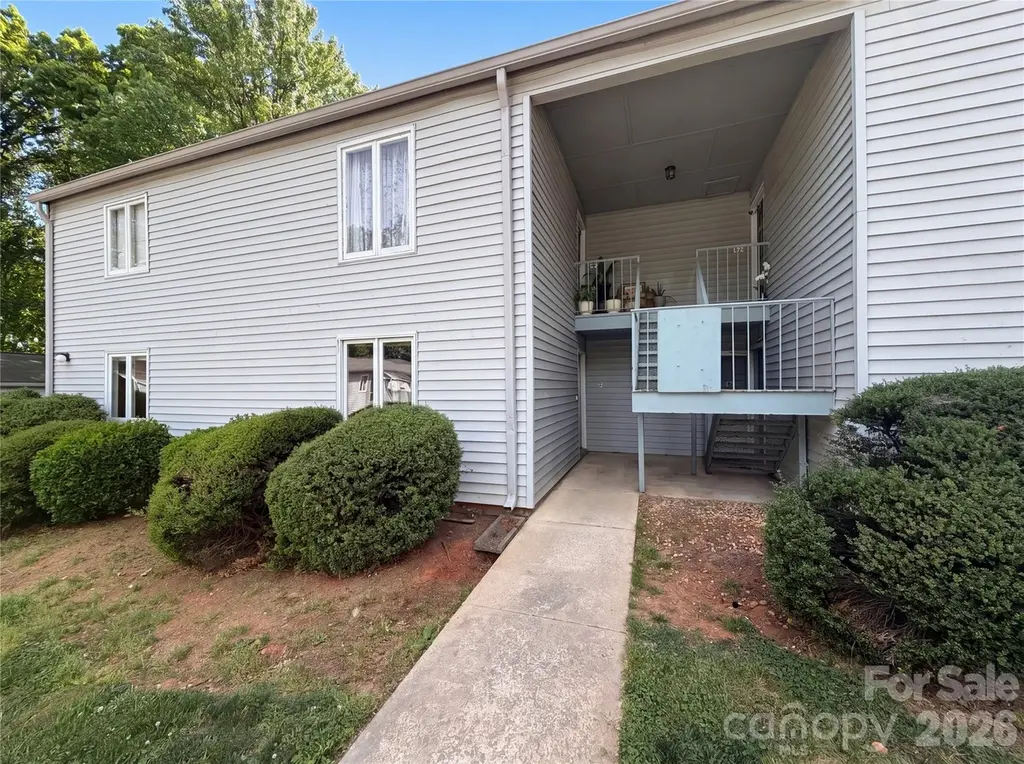
2020 Stoney Point Ln #59 · Charlotte, NC
Flood risk No data
- FEMA flood zone
- —
- Chance of flooding over 30 yrs
- —
- Est. flood insurance / yr
- —
Fire risk No data
- Est. fire insurance / yr
- —
Heat risk No data
- Hot days now (above threshold)
- —
- Hot days in 30 yrs
- —
Wind risk No data
- Chance of severe wind over 30 yrs
- —
Air-quality risk No data
- Unhealthy air days now
- —
- Unhealthy air days in 30 yrs
- —
Risk factors via First Street. Map © Google.
Why this score? — see what drove the D- grade
The composite is a weighted blend of 9 inputs, each scored 0–100. Each bar is that input's sub-score; the figure is the points it added to the 100-point composite (weight × sub-score).
- Cash flow +11.1/30.0
- ARV discount +7.5/15.0
- 1% rule +5.1/10.0
- Livability +3.9/5.0
- Schools +3.8/10.0
- DSCR +3.2/10.0
- Condition / age +2.5/5.0
- Rent growth +2.2/5.0
- Appreciation +0.0/10.0
$131,000
🖨 Deal sheet (PDF) 📄 Offer letter ✓ Due diligence
Listing remarks
Welcome to 2020 Stoney Point Ln, a property that boasts a myriad of desirable features. The home is nestled in a quiet, peaceful neighborhood, providing a tranquil living environment. The property is surrounded by a beautifully landscaped garden, providing a serene outdoor space for relaxation. The interior is adorned with hardwood floors, adding a touch of elegance and warmth to the home. The kitchen features an efficient cooking experience. The home is conveniently located near local amenities, making daily errands a breeze. Don't miss out on this gem. Included 100-Day Home Warranty with buyer activation
Key facts
- Serene outdoor space
- Landscaped garden
- $303 HOA
Tags
Property features AI
Finance
- HOA & community: HOA managed by Greenway Realty Management; Mandatory HOA dues of $303 per month
Exterior
- Parking: Driveway and open parking spaces (no garage or carport)
- Utilities: Public water; Public sewer
- Home design: Residential condominium; One story; Site-built construction
- Construction: Vinyl exterior; Composition roof; Slab foundation
- Exterior features: Driveway parking; 1 open parking space; Publicly maintained asphalt road
Interior
- Kitchen: Dishwasher; Electric range
- Bedrooms: 2 bedrooms on the main level
- Flooring: Carpet; Tile; Vinyl
- Bathrooms: 2 full bathrooms on the main level
- Heating & cooling: Central heating (electric); Central air conditioning
- Interior features: 8 total rooms; Entry level is 1
- Laundry & utility: Laundry located in the kitchen
Neighborhood map
What this means for you Summary
Snapshot
- This is a 2-bed/2.0-bath condo listed at $131k.
Deal economics
- At list price, monthly cash flow is $-53 ($-635/yr) — negative.
- To cash-flow at today's rent, offer at most $122k (7.1% below list).
- Meets the 1% rule at list price ($1k rent vs $131k).
- Recommended offer: $122k (7.1% below list) — sets the bar for cash-flow.
- Cap rate 5.8% vs local median 3.1% in Charlotte — top-decile yield for the area; either an underpriced asset or a hidden risk that comps aren't pricing in. Stress-test before assuming the spread holds.
Location & tenants
- Location reads 78/100 on livability (#26 in NC, #2,502 nationally) — a middle-class / working-renter tenant base. Strengths: amenities A+, commute A+, housing A+; Watch: crime F.
- Charlotte-Mecklenburg Schools (urban): math 42% / reading 46% proficiency, ranked #85 of 178 in NC (top 48%) — families likely to look elsewhere, expect single-tenant / working-renter base with shorter leases.
- Zoned schools: Sterling Elementary (math 11% / reading 13%, grade F, #1,373 of 1,410 statewide, top 98%, 695 students, 100% FRL); Quail Hollow Middle (math 24% / reading 30%, grade F, #374 of 475 statewide, top 80%, 1,144 students, 49% FRL); South Mecklenburg High School (math 71% / reading 66%, grade B, #134 of 535 statewide, top 25%, 3,344 students, 36% FRL).
- Market conditions: Rents soft (-1.0%/yr); 242 active listings in the ZIP; 31 comparable units currently listed for rent nearby; rentals at typical pace (median 16d on market — plan ~3-4 weeks tenant-placement turnaround); solid renter incomes; 11,969 units permitted in Mecklenburg County in 2024 (5,377 in 5+ unit buildings).
- This rent is only 16% of the median local income ($101k/yr) — well below the 30% rent-burden line; pricing power to push rent on renewal without tenant pushback.
Forward outlook
- Local home prices are declining (-3.0%/yr); year-one equity from $906 of loan paydown is wiped out by about $4k of value loss. Plan a longer hold.
- Mecklenburg County population projected at +53% by 2050 — long-run rental-demand tailwind backs the buy-and-hold thesis.
Negotiation context
- It's been on market 43 days — a 3% lower offer ($127k) is reasonable based on typical stale-listing flexibility.
- 2 sale attempts since 3y ago; this cycle's ask has dropped $8k (6%) from the opening price — seller is motivated, your offer sets the floor, not the list.
- Current owner paid $105k; 25% above their basis — modest negotiation headroom, anchor on the comps not their cost.
Risks & watch-outs
- Watch-outs: HOA is 23% of rent.
Questions for the listing agent
- What do current leases actually rent for vs. the listed asking? Can we see a recent rent roll and the last 12 months of T-12 income?
- It's been on market 43 days. Have you received any prior offers? Is the seller open to a 7% concession, seller financing, or rate buy-down credit?
- Built in 1972 — when were the roof, HVAC, electrical panel, plumbing, and water heater last replaced?
- What does the HOA fee cover, when was the last increase, and are there any pending special assessments or reserve-fund shortfalls?
- Any open or pending special assessments — roof, HVAC, plumbing, elevator, façade? What's the per-unit balance and payoff schedule, and is the seller paying it off at close or rolling it to the buyer?
- Is there a deadline driving the sale (1031 exchange, divorce, estate, relocation)? That informs how much negotiation room exists.
- Schools are D-rated, which usually means shorter tenancies and higher turnover. Who's the typical renter profile here, and what's been the actual vacancy rate?
- Crime grade is F in this area — have there been break-ins, vandalism, or insurance claims at this property in the last 3 years? What carrier currently insures it and at what premium?
- The area grade is low — what's the realistic commute time and amenity access for the typical tenant pool here? Any planned neighborhood developments (good or bad) we should know about?
- What's the average days-on-market for RENTAL listings here right now (not sales)? A rising rental-DOM trend means longer vacancies and softer asking-rent achievability than the comps imply.
- What's the recent tenant-quality profile in this submarket — average credit score on applications, eviction rate, late-payment / NSF rate, and stable-employment percentage? A property-management company in the area should have these aggregated.
- How much new apartment / multifamily construction is in the pipeline within 1–3 miles? Heavy new supply (>2% of stock underway) typically softens rents 12–24 months out; light construction supports rent growth.
Investment metrics
- 1% rule
- 1.01% ✓
- Cap rate
- 5.81%
- Cash-on-cash
- -1.73%
- DSCR
- 0.92
- GRM
- 8.2
CMA / ARV
No comps found within radius.
Projected returns pro-forma
-3.0% appreciation · 0.0% rent growth · sell at horizon
- IRR
- -23.3%
- Equity multiple
- 0.23×
- Total profit
- $-28,345
- Equity at exit
- $19,533
- IRR
- -32.5%
- Equity multiple
- -0.19×
- Total profit
- $-43,474
- Equity at exit
- $11,326
Cash invested: $36,680 (down + closing). Projections, not guarantees.
Landlord ↔ Tenant lean methodology
- Overall (STATE)
- 85 Strongly Landlord-Friendly
- State North Carolina
- 85 Strongly Landlord-Friendly · R+3
- County
- — inherits STATE
- City
- — inherits STATE
ZIP-level market 28210
- Rents YoY
- -1.0%
- Active inventory
- 242
- Price-to-rent
- 8.2×
Monthly cashflow live
- Estimated rent
- $1,326 high interval (Pro) →
- Mortgage (P&I)
- −$687
- Tax from tax record
- −$56 /mo · $672/yr
- Insurance
- −$55
- HOA
- −$303
- Vacancy / Maint / Mgmt
- −$278
- Net cashflow
- $-53
Break-even live
Sensitivity live
| Price | -10% $21 | -5% $-16 | +0% $-53 | +5% $-90 | +10% $-127 |
|---|---|---|---|---|---|
| Rent | -10% $-158 | -5% $-105 | +0% $-53 | +5% $-1 | +10% $52 |
| Rate | -1.0pp $13 | -0.5pp $-20 | base $-53 | +0.5pp $-87 | +1.0pp $-121 |
UW: 25.0% down · 7.5% · 30yr · 1.5% tax · 5.0% vac · 8.0% maint · 8.0% mgmt
Financing live
Cash to close
- Down payment
- $32,750
- Closing costs
- $3,930
- Reserves months
- —
- Total cash needed
- —
Loan-product check · same deal, 3 products live
Conventional
25% down · 7.5% · 30yr
- Down + closing
- —
- Monthly P&I
- —
- Monthly cashflow
- —
- DSCR
- —
- Eligible?
- —
Personal DTI + credit; lowest rate.
DSCR
20% down · 8.5% · 30yr
- Down + closing
- —
- Monthly P&I
- —
- Monthly cashflow
- —
- DSCR
- —
- Eligible?
- —
No personal income docs; deal must DSCR.
Hard money
10% down · 12.0% · 12mo
- Down + closing
- —
- Monthly P&I
- —
- Monthly cashflow
- —
- DSCR
- —
- Eligible?
- —
Short-term bridge; refi at stabilization.
Rent comps 31 comps
| Address | Beds | Baths | Sqft | Rent | $/sqft | DOM | Units | Dist |
|---|---|---|---|---|---|---|---|---|
| 2015 Countrymens Ct #53 Charlotte, NC | 1.0 | 1.0 | 758 | $1,100 | $1.45 | 25d | 1 | 0.05mi |
| 2010 Countrymens Ct #65 Charlotte, NC | 1.0 | 1.0 | 738 | $950 | $1.29 | 25d | 1 | 0.08mi |
| 1909 Meadowlark Ln #40 Charlotte, NC | 1.0 | 1.0 | 758 | $950 | $1.25 | 18d | 1 | 0.10mi |
| 2021 Harvest Ln Charlotte, NC | 1.0 | 1.0 | 758 | $1,200 | $1.58 | 25d | 1 | 0.16mi |
| 7903 Oak Meadow Ct #2 Charlotte, NC | 2.0 | 1.5 | 1048 | $1,600 | $1.53 | 19d | 1 | 0.16mi |
| 7961 Unit 63 Shady Oak Trl Charlotte, NC | 2.0 | 2.0 | 1048 | $1,175 | $1.12 | 25d | 1 | 0.19mi |
| 1909 Harvest Ln Charlotte, NC | 2.0 | 2.0 | 1000 | $1,495 | $1.50 | 0d | 1 | 0.19mi |
| 7961 Shady Oak Trl Unit 65 Charlotte, NC | 2.0 | 1.5 | 1050 | $1,175 | $1.12 | 25d | 1 | 0.20mi |
| 1911 Smoke Ridge Ct #5 Charlotte, NC | 2.0 | 1.5 | 1000 | $1,550 | $1.55 | 25d | 1 | 0.21mi |
| 7808 Andover Woods Dr Charlotte, NC | 1.0–2.0 | 1.0–2.0 | 916 | $1,495 | $1.63 | 0d | 32 | 0.23mi |
| 2123 El Verano Cir Charlotte, NC | 1.0–2.0 | 1.0 | 787 | $1,520 | $1.93 | 6d | 10 | 0.24mi |
| 1937 Sharon Rd W Charlotte, NC | 1.0–2.0 | 1.0–2.0 | 800 | $1,199 | $1.50 | 25d | 1 | 0.29mi |
| 7561 Quail Meadow Ln Charlotte, NC | 2.0 | 2.0–2.5 | 1109 | $1,542 | $1.39 | 0d | 8 | 0.37mi |
| 8000 Waterford Lakes Dr Charlotte, NC | 1.0–3.0 | 1.0–2.0 | 915 | $1,385 | $1.51 | 0d | 94 | 0.41mi |
| 7600 Antlers Ln Charlotte, NC | 3.0 | 1.0–2.0 | 854 | $1,387 | $1.62 | 0d | 39 | 0.45mi |
| 8625 Winter Oaks Ln Charlotte, NC | 1.0–3.0 | 1.0–2.0 | 977 | $1,486 | $1.52 | 0d | 84 | 0.50mi |
| 8200 Riverbirch Dr Charlotte, NC | 1.0–3.0 | 1.0–2.0 | 1048 | $1,310 | $1.25 | 0d | 27 | 0.52mi |
| 1357 Sharon Rd W Charlotte, NC | 2.0–3.0 | 1.5–2.0 | 1117 | $1,535 | $1.37 | 3d | 6 | 0.60mi |
| 1600 Village Brook Dr Charlotte, NC | 1.0–2.0 | 1.0–2.0 | 709 | $1,247 | $1.76 | 0d | 11 | 0.65mi |
| 12509 Crown Park Ct Charlotte, NC | 1.0–3.0 | 1.0–2.0 | 1050 | $1,658 | $1.58 | 0d | 26 | 0.78mi |
| 1226 Bexton St Charlotte, NC | 3.0 | 1.0–2.0 | 1001 | $1,796 | $1.79 | 0d | 19 | 0.79mi |
| 9056 Arborgate Dr Charlotte, NC | 1.0–2.0 | 1.0–2.0 | 786 | $1,499 | $1.91 | 5d | 1 | 1.22mi |
| 9215 Kings Canyon Dr Charlotte, NC | 2.0 | 2.0 | 998 | $2,690 | $2.70 | 25d | 1 | 1.30mi |
| 6720 Woodstream Dr Charlotte, NC | 2.0 | 1.0 | 900 | $1,300 | $1.44 | 25d | 1 | 1.31mi |
| 8030 Sycamore Creek Dr Charlotte, NC | 2.0 | 2.0 | 917 | $1,575 | $1.72 | 25d | 1 | 1.31mi |
| 9252 Kings Canyon Dr Charlotte, NC | 2.0 | 2.0 | 987 | $1,700 | $1.72 | 16d | 1 | 1.32mi |
| 9252 Kings Canyon Dr Charlotte, NC | 2.0 | 2.0 | 987 | $1,700 | $1.72 | 25d | 1 | 1.32mi |
| 8508 Lodge South Cir Charlotte, NC | 3.0 | 1.0–2.0 | 897 | $1,494 | $1.66 | 0d | 17 | 1.43mi |
| 9616 China Grove Church Rd Pineville, NC | 2.0 | 1.0 | 888 | $1,695 | $1.91 | 9d | 1 | 1.47mi |
| 1015 Deep Rock Cir Charlotte, NC | 1.0 | 1.0 | 775 | $1,163 | $1.50 | 25d | 1 | 1.48mi |
| 8825 Mont Carmel Ln Charlotte, NC | 1.0–2.0 | 1.0–2.0 | 916 | $1,450 | $1.58 | 25d | 2 | 1.49mi |
HOA detail condo
- Monthly dues
- $303 · $3,636/yr
- Assessments
- None detected in remarks — confirm with the listing agent.
Listing history 14 events
-
2026-06-04pricedays on market $131,000 Active 43 DOM
-
2026-06-03days on market $135,000 Active 42 DOM
-
2026-06-02days on market $135,000 Active 41 DOM
-
2026-06-02days on market $135,000 Active 40 DOM
-
2026-05-31days on market $135,000 Active 39 DOM
-
2026-04-30price $135,000
-
2026-04-22$139,000 Active
-
2026-04-10soldstatus $105,000
-
2024-04-21historical $1,149
-
2024-02-15price $1,149
-
2024-01-25price $1,199
-
2024-01-09price $1,200
-
2023-12-02price $1,250
-
2023-11-18$1,300
ⓘ Source: listings_history table (triggers on properties + properties_extension) + one-shot
backfill from property_details.listing_events for pre-trigger history.
Tax reassessment forecast NC · Resets to sale price
- Current annual tax
- $672 · $56/mo
- Projected year-2 tax
- $1,074 · $90/mo
- Expected delta
- +$403/yr (+$34/mo · 59.9%)
ⓘ Screening estimate from a state-policy table — verify with the county assessor before closing.
Nearby sold comps map
Loading sold comps map…
Walkable amenities ~0.75 mi
Loading nearby amenities…
Taxation est. · year 1
- Rental income
- $15,913
- − Mortgage interest
- −$7,338
- − Property taxes
- −$672
- − Insurance
- −$655
- − Repairs & maintenance
- −$1,273
- − Management
- −$1,273
- − HOA
- −$3,636
- − Depreciation
- −$3,811
- Taxable loss
- −$2,745
- Est. tax savings @ 24.0%
- +$659
- After-tax cash flow
- $24/yr
For passive investors: Depreciation is non-cash, so a rental often shows a tax loss while cash-flowing — sheltering income. Rental losses are passive: they offset passive income freely, and up to $25,000/yr can offset ordinary (W-2) income if you actively participate and your MAGI is under $100k (phasing out to $0 by $150k); unused losses carry forward. On sale, claimed depreciation is recaptured at up to 25%, and gains may owe capital-gains tax (a 1031 exchange can defer both). Figures are a year-1 estimate at your 24.0% rate — not tax advice; consult a CPA.
Schools (NCES district)
- District
- Charlotte-Mecklenburg Schools
- NCES district ID
- 3702970
- Math proficiency
- 42% ▼ -6.00%
- Reading proficiency
- 46% ▲ 1.00%
- Median HH income
- $57,175
- Composite
- 38.49/100
- National rank
- #4183
- State rank
- #85 of 178 in NC
Livability — Charlotte
- Score
- 78/100
- State rank
- #26
- US rank
- #2502
Category grades
Schools grade is shown separately in the Schools card above.
Census & demographics
- Census place
- Charlotte, NC
- County
- Mecklenburg County · 1,167,319 people
- City population
- 920,422
- Metro
- Charlotte-Concord-Gastonia, NC-SC
- Population (ZIP)
- 47,359
- Household income
- $100,824
- Rent vs Own
- Severe rent burden
- 2363.0
Population outlook (Mecklenburg County) Hauer SSP2
- Today (2025)
- 1,305,740 people
- By 2030
- 1,442,752 · +10.5%
- By 2040
- 1,722,441 · +31.9%
- By 2050
- 1,999,450 · +53.1%
- By 2075
- 2,642,495 · +102.4%
- By 2100
- 3,106,755 · +137.9%
Race, ethnicity, and origin ACS 2023
- Neighborhood character
- Diverse neighborhood (Simpson 0.58)
- Race & ethnicity
- White 60% Hispanic / Latino 20% Two or more races 13% Black 12% Asian 3%
- Hispanic origin (detail)
- Mexican 5% Dominican 1%
- Common ancestry
- Serbian 4% Slovak 3% Romanian 2%
- Foreign-born
- 19% · Canada, Jamaica, Guatemala
- Languages at home
- 77% English-only · Spanish 17% Other Indo-European 2% Russian/Polish/Slavic 1%
Political lean MEDSL · Mecklenburg
- 2024 margin
- Solid D (+32.9) · D 65.6% · R 32.7% · Other 1.6%
- 2008→2024 swing
- +8.5pp toward D · 2008: 24.4pp · 2024: 32.9pp
- All cycles
- 2024: D+32.9 2020: D+35.1 2016: D+29.9 2012: D+22.5 2008: D+24.4
Not yet ingested
- Civics
- —
Market trends
- HPI YoY
- ▼ -521.35%
- Current HPI
- 316.6779
- Rent YoY
- ▼ -1.00%
- Metro
- Charlotte-Concord-Gastonia, NC-SC
- State GDP YoY
- ▲ 3.28%
- F500 in state
- 26
Industry mix (Fortune 500 HQ in NC)
| Industry | F500 HQs | Revenue |
|---|---|---|
| Financial Services | 2 | $213B |
|
||
| Retail | 2 | $95B |
|
||
| Industrial Conglomerate | 1 | $38B |
|
||
| Metals / Steel | 1 | $35B |
|
||
| Utilities | 1 | $30B |
|
||
| Industrial Machinery | 1 | $19B |
|
||
Price history
+10284.6% since first listed9 events — show timeline
- 2026-04-30 Price Changed $135,000 CANOPYMLS as Distributed by MLS Grid
- 2026-04-22 Listed $139,000 CANOPYMLS as Distributed by MLS Grid
- 2026-04-10 Sold (Public Records) $105,000 Public Records
- 2024-04-21 Rental Removed $1,149 RENT.
- 2024-02-15 Price Changed $1,149 RENT.
- 2024-01-25 Price Changed $1,199 RENT.
- 2024-01-09 Price Changed $1,200 RENT.
- 2023-12-02 Price Changed $1,250 RENT.
- 2023-11-18 Listed for Rent $1,300 RENT.
Property tax history
+6.8%/yrLatest (2020): $672 · +2.4% YoY. Source: county tax records.
Cash-flow waterfall
monthlySold comps — $/sqft
last 12 mo · ≤1 miLoading sold comps…