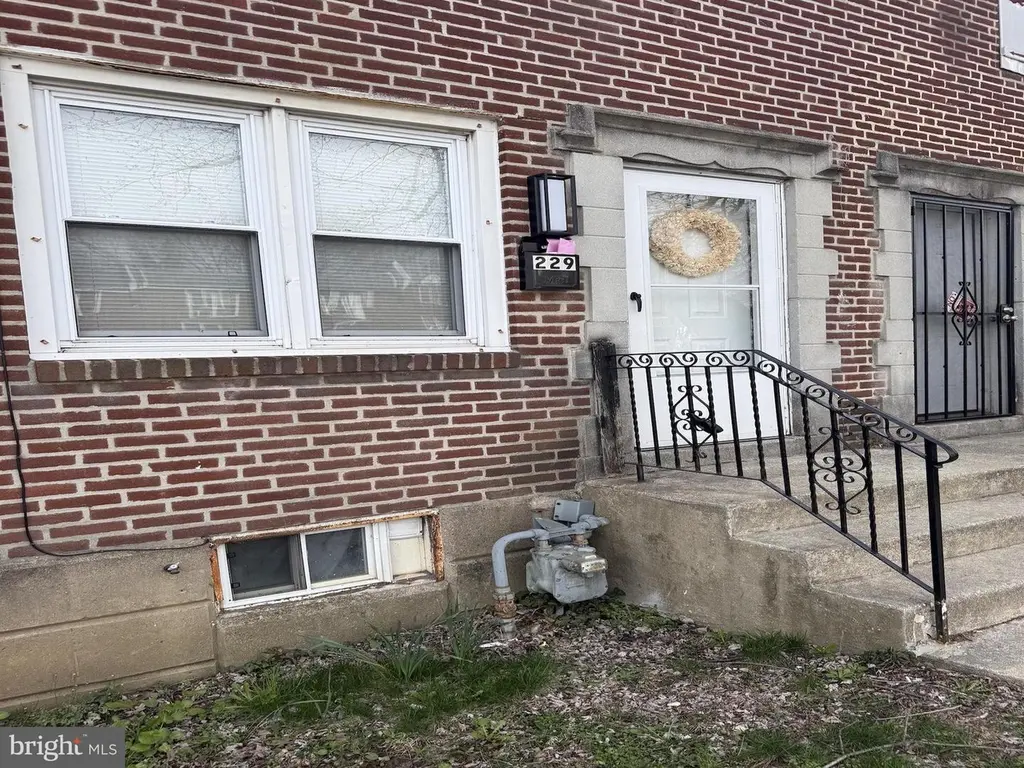
229 W 22nd St · Chester, PA
Flood risk 1/10 · Minimal
- FEMA flood zone
- X (unshaded)
- Chance of flooding over 30 yrs
- 0.0%
- Est. flood insurance / yr
- $473 – $860
Fire risk 1/10 · Minimal
- Est. fire insurance / yr
- $511 – $949
Heat risk 7/10 · Major
- Hot days now (above 103°F)
- 7 days/yr
- Hot days in 30 yrs
- 15 days/yr
Wind risk 6/10 · Moderate
- Chance of severe wind over 30 yrs
- 27.0%
Air-quality risk 3/10 · Minor
- Unhealthy air days now
- 2 days/yr
- Unhealthy air days in 30 yrs
- 4 days/yr
Risk factors via First Street. Map © Google.
Why this score? — see what drove the D grade
The composite is a weighted blend of 9 inputs, each scored 0–100. Each bar is that input's sub-score; the figure is the points it added to the 100-point composite (weight × sub-score).
- Cash flow +15.8/30.0
- 1% rule +6.0/10.0
- ARV discount +5.6/15.0
- DSCR +4.9/10.0
- Rent growth +4.2/5.0
- Livability +3.7/5.0
- Condition / age +2.5/5.0
- Schools +0.8/10.0
- Appreciation +0.0/10.0
$149,999
🖨 Deal sheet (PDF) 📄 Offer letter ✓ Due diligence
Listing remarks MLS
Welcome Home! This home features a functional layout with comfortable living and dining areas, three nicely sized bedrooms, and a full bath. The clean, dry unfinished basement which is currently be used as additional living space, provides additional usable space. Ideal for storage, a home office, gym, or recreation. A converted garage adds extra square footage with potential for customization. Enjoy a front yard and a deep rear yard beyond the alley, perfect for outdoor use or future projects. Located just minutes from Subaru Park, home of the Philadelphia Union, with easy access to Philadelphia, Delaware, major highways, shopping, dining, and public transportation. Schedule your showing today.
Key facts
- Built 1943
- Listed 86 days
Neighborhood map
What this means for you Summary
Snapshot
- This is a 3-bed/1.0-bath townhouse listed at $150k.
Deal economics
- At list price, monthly cash flow is $69 ($822/yr) — positive.
- The deal already cash-flows at list — no discount required.
- Meets the 1% rule at list price ($2k rent vs $150k).
- Recommended offer: $141k (6.0% below list) — sets the bar for market timing.
Location & tenants
- Location reads 73/100 on livability (#540 in PA) — a middle-class / working-renter tenant base. Strengths: amenities A+, commute A+, cost of living A+; Watch: crime F, employment F.
- Chester-Upland SD (suburban): math 4% / reading 17% proficiency, ranked #533 of 539 in PA (top 99%) — low school quality limits family demand, transient renter base, plan for 1-2y turnover; 81% free/reduced lunch — lower-income household profile, screen leases tightly.
- Zoned schools: Toby Farms Intermediate School (math 2% / reading 12%, grade F, #506 of 512 statewide, top 99%, 299 students, 100% FRL) — zoned schools average 100% FRL vs 81% district-wide (19 pts higher); higher-poverty schools than district average — tighter screening recommended.
- Market conditions: Rents rising fast (+6.9%/yr); 140 active listings in the ZIP; 36 comparable units currently listed for rent nearby; rentals at typical pace (median 21d on market — plan ~3-4 weeks tenant-placement turnaround); lower-income renter base — watch delinquency; 299 units permitted in Delaware County in 2024 (5 in 5+ unit buildings).
- At $1,657/mo this rent would consume 48% of the median local household income ($41k/yr) (locally 2668% of renters already pay >50% of income on rent) — very limited rent-growth headroom before tenants either downsize or default.
Forward outlook
- Local home prices are declining (-3.0%/yr); year-one equity from $1k of loan paydown is wiped out by about $4k of value loss. Plan a longer hold.
Negotiation context
- It's been on market 87 days — a 6% lower offer ($141k) is reasonable based on typical stale-listing flexibility.
- 6 sale attempts since 23y ago with the ask held roughly flat each time — persistent listings suggest the price (not the market) is what's stuck; bring a comps-based counter.
- Current owner paid $128k; 17% above their basis — modest negotiation headroom, anchor on the comps not their cost.
Risks & watch-outs
- Watch-outs: property tax is 3.1% of price; built in 1943 — expect roof / HVAC / electrical / plumbing capex.
- Climate carrying-cost: major wind risk, 27% chance of damaging wind over 30y; extreme-heat days projected 7→15/yr by 2055 (HVAC capex compounding) — expect insurance premiums to compound above CPI over the hold.
Questions for the listing agent
- It's been on market 87 days. Have you received any prior offers? Is the seller open to a 6% concession, seller financing, or rate buy-down credit?
- Built in 1943 — when were the roof, HVAC, electrical panel, plumbing, and water heater last replaced?
- Property tax is high relative to price — has the assessment been appealed recently, and will the sale trigger a re-assessment?
- Why hasn't it sold? Are there any deal-killer items the seller is aware of (foundation, flood, title, zoning, code violations)?
- Is there a deadline driving the sale (1031 exchange, divorce, estate, relocation)? That informs how much negotiation room exists.
- Schools are F-rated, which usually means shorter tenancies and higher turnover. Who's the typical renter profile here, and what's been the actual vacancy rate?
- Crime grade is F in this area — have there been break-ins, vandalism, or insurance claims at this property in the last 3 years? What carrier currently insures it and at what premium?
- The area grade is low — what's the realistic commute time and amenity access for the typical tenant pool here? Any planned neighborhood developments (good or bad) we should know about?
- What's the average days-on-market for RENTAL listings here right now (not sales)? A rising rental-DOM trend means longer vacancies and softer asking-rent achievability than the comps imply.
- What's the recent tenant-quality profile in this submarket — average credit score on applications, eviction rate, late-payment / NSF rate, and stable-employment percentage? A property-management company in the area should have these aggregated.
- How much new for-sale + rental construction is in the pipeline within 1–3 miles? Heavy new supply typically softens prices + rents 12–24 months out; constrained supply supports both.
Investment metrics
- 1% rule
- 1.10% ✓
- Cap rate
- 6.84%
- Cash-on-cash
- 1.96%
- DSCR
- 1.09
- GRM
- 7.5
CMA / ARV
- ARV (median comp)
- $143,929
- List price
- $149,999
- Delta
- 4.22%
- Verdict
- FAIR
- Comps
- 20 within 1.0 mi
Show comp detail 12 sales within ~0.75 mi
| Address | Dist | Beds/Ba | Sqft | Sold | Price | $/sf | Match |
|---|---|---|---|---|---|---|---|
| 200 W 21st St | 0.05mi | 3/1.0 | 1,152 (0%) | 3mo | $160,000 | $139 | 95 |
| 312 W 21st St | 0.08mi | 3/1.0 | 1,152 (0%) | 2mo | $155,000 | $135 | 94 |
| 248 W 22nd St | 0.04mi | 3/1.0 | 1,152 (0%) | 5mo | $130,000 | $113 | 94 |
| 327 W 21st St | 0.10mi | 3/1.5 | 1,152 (0%) | 2mo | $105,312 | $91 | 92 |
| 125 W 21st St | 0.12mi | 3/1.5 | 1,152 (0%) | 1mo | $135,000 | $117 | 92 |
| 21 W 21st St | 0.17mi | 3/1.0 | 1,151 (-0%) | 3mo | $137,500 | $119 | 89 |
| 1137 Mulberry St | 0.36mi | 3/1.5 | 1,122 (-3%) | 2mo | $235,000 | $209 | 75 |
| 2535 Lindsay St | 0.43mi | 3/1.0 | 1,088 (-6%) | 5mo | $80,000 | $74 | 67 |
| 2419 Upland St | 0.48mi | 3/1.0 | 1,212 (+5%) | 3mo | $105,000 | $87 | 66 |
| 2534 Sandeland St | 0.43mi | 2/1.0 (-1) | 1,204 (+4%) | 4mo | $190,000 | $158 | 64 |
| 1009 Mulberry St | 0.46mi | 3/1.5 | 1,078 (-6%) | 5mo | $215,000 | $199 | 61 |
| 215 8th St | 0.66mi | 2/1.0 (-1) | 1,023 (-11%) | 3mo | $145,000 | $142 | 43 |
Match score weights: distance 35% · size 25% · config 20% · recency 20%. Top-matched comps best support the ARV.
Projected returns pro-forma
-3.0% appreciation · 6.88% rent growth · sell at horizon
- IRR
- -8.1%
- Equity multiple
- 0.69×
- Total profit
- $-13,070
- Equity at exit
- $22,365
- IRR
- 6.5%
- Equity multiple
- 1.59×
- Total profit
- $24,724
- Equity at exit
- $12,969
Cash invested: $42,000 (down + closing). Projections, not guarantees.
Landlord ↔ Tenant lean methodology
- Overall (STATE)
- 62 Landlord-Friendly
- State Pennsylvania
- 62 Landlord-Friendly · EVEN
- County
- — inherits STATE
- City
- — inherits STATE
ZIP-level market 19013
- Rents YoY
- 6.9%
- Active inventory
- 140
- Price-to-rent
- 7.5×
Monthly cashflow live
- Estimated rent
- $1,657 high interval (Pro) →
- Mortgage (P&I)
- −$787
- Tax from tax record
- −$391 /mo · $4,695/yr
- Insurance
- −$62
- HOA
- −$0
- Vacancy / Maint / Mgmt
- −$348
- Net cashflow
- $69
Break-even live
Sensitivity live
| Price | -10% $153 | -5% $111 | +0% $69 | +5% $26 | +10% $-16 |
|---|---|---|---|---|---|
| Rent | -10% $-62 | -5% $3 | +0% $69 | +5% $134 | +10% $199 |
| Rate | -1.0pp $144 | -0.5pp $107 | base $69 | +0.5pp $30 | +1.0pp $-10 |
UW: 25.0% down · 7.5% · 30yr · 1.5% tax · 5.0% vac · 8.0% maint · 8.0% mgmt
Financing live
Cash to close
- Down payment
- $37,500
- Closing costs
- $4,500
- Reserves months
- —
- Total cash needed
- —
Loan-product check · same deal, 3 products live
Conventional
25% down · 7.5% · 30yr
- Down + closing
- —
- Monthly P&I
- —
- Monthly cashflow
- —
- DSCR
- —
- Eligible?
- —
Personal DTI + credit; lowest rate.
DSCR
20% down · 8.5% · 30yr
- Down + closing
- —
- Monthly P&I
- —
- Monthly cashflow
- —
- DSCR
- —
- Eligible?
- —
No personal income docs; deal must DSCR.
Hard money
10% down · 12.0% · 12mo
- Down + closing
- —
- Monthly P&I
- —
- Monthly cashflow
- —
- DSCR
- —
- Eligible?
- —
Short-term bridge; refi at stabilization.
Rent comps 36 comps
| Address | Beds | Baths | Sqft | Rent | $/sqft | DOM | Units | Dist |
|---|---|---|---|---|---|---|---|---|
| 330 W 21st St Chester, PA | 3.0 | 1.0 | 1152 | $1,500 | $1.30 | 46d | 1 | 0.09mi |
| 125 W 21st St Chester, PA | 4.0 | 1.5 | 1152 | $1,850 | $1.61 | 26d | 1 | 0.13mi |
| 13 E 21st St Unit A Chester, PA | 2.0 | 1.0 | 900 | $1,250 | $1.39 | 46d | 1 | 0.27mi |
| 25 W Parkway Ave Chester, PA | 3.0 | 1.0 | 1324 | $1,600 | $1.21 | 7d | 1 | 0.33mi |
| 2219 Madison St Unit B Chester, PA | 2.0 | 1.0 | 800 | $1,000 | $1.25 | 46d | 1 | 0.36mi |
| 2607 Edgmont Ave Unit 2F Brookhaven, PA | 2.0 | 1.0 | 850 | $1,600 | $1.88 | 26d | 1 | 0.49mi |
| 30 W Roland Rd Brookhaven, PA | 3.0 | 1.0 | 1424 | $1,695 | $1.19 | 46d | 1 | 0.51mi |
| 314 E 24th St Chester, PA | 2.0 | 1.0–1.5 | 800 | $1,500 | $1.88 | 1d | 12 | 0.52mi |
| 2701 Madison St Chester, PA | 1.0–2.0 | 1.0 | 860 | $1,533 | $1.78 | 4d | 10 | 0.56mi |
| 2015 Hyatt St Chester, PA | 3.0 | 1.5 | 988 | $1,950 | $1.97 | 1d | 1 | 0.73mi |
| 1127 Walnut St Chester, PA | 4.0 | 1.5 | 1312 | $1,600 | $1.22 | 10d | 1 | 0.79mi |
| 814 Upland St Chester, PA | 3.0 | 1.0 | 1344 | $1,525 | $1.13 | 10d | 1 | 0.85mi |
| 51 Park Valley Ln Brookhaven, PA | 2.0 | 1.5 | 990 | $1,795 | $1.81 | 20d | 1 | 0.90mi |
| 89 Park Valley Ln Brookhaven, PA | 2.0 | 1.5 | 984 | $1,705 | $1.73 | 46d | 1 | 0.91mi |
| 1510 Washington Ave Chester, PA | 4.0 | 1.5 | 1280 | $2,000 | $1.56 | 20d | 1 | 0.92mi |
| 1211 Johnson St Chester, PA | 3.0 | 1.0 | 882 | $1,500 | $1.70 | 5d | 1 | 0.95mi |
| 921 E 15th St Chester, PA | 3.0 | 1.0 | 1279 | $1,650 | $1.29 | 1d | 1 | 0.98mi |
| 1118 Brown St Unit 318 Chester, PA | 3.0 | 1.0 | 1092 | $1,900 | $1.74 | 17d | 1 | 1.02mi |
| 1944 Ridley Mill Ln Woodlyn, PA | 2.0 | 1.0 | 840 | $1,600 | $1.90 | 46d | 1 | 1.04mi |
| 418 Penn St Chester, PA | 3.0 | 1.0 | 1250 | $1,350 | $1.08 | 46d | 1 | 1.08mi |
| 1124 Thomas St Chester, PA | 3.0 | 1.0 | 1046 | $1,200 | $1.15 | 26d | 1 | 1.10mi |
| 1206 Thomas St Chester, PA | 3.0 | 1.0 | 833 | $1,399 | $1.68 | 26d | 1 | 1.12mi |
| 407 Beech Rd Apt B Wallingford, PA | 2.0 | 1.0 | 998 | $1,600 | $1.60 | 46d | 1 | 1.18mi |
| 1224 Elson Rd Brookhaven, PA | 3.0 | 2.0 | 1200 | $1,900 | $1.58 | 19d | 1 | 1.21mi |
| 1315 Harshaw Rd Brookhaven, PA | 3.0 | 2.5 | 1260 | $2,395 | $1.90 | 0d | 1 | 1.26mi |
| 280 Bridgewater Rd Brookhaven, PA | 1.0–2.0 | 1.0–1.5 | 775 | $1,695 | $2.19 | 1d | 2 | 1.28mi |
| 280 Bridgewater Rd Brookhaven, PA | 1.0–2.0 | 1.0–1.5 | 775 | $1,800 | $2.32 | 26d | 2 | 1.28mi |
| 403 Trenton Ct Wallingford, PA | 2.0 | 1.0 | 775 | $2,250 | $2.90 | 0d | 1 | 1.30mi |
| 925 W 3rd St Chester, PA | 4.0 | 1.0 | 1500 | $1,700 | $1.13 | 20d | 1 | 1.34mi |
| 532 Brookhaven Rd Brookhaven, PA | 1.0–2.0 | 1.0 | 720 | $1,720 | $2.39 | 1d | 10 | 1.34mi |
| 1312 E 13th St Crum Lynne, PA | 3.0 | 1.0 | 1280 | $1,940 | $1.52 | 20d | 1 | 1.35mi |
| 739 Pennsylvania Ave Wallingford, PA | 3.0 | 1.0 | 1026 | $2,100 | $2.05 | 10d | 1 | 1.39mi |
| 404 Nashville Ct Wallingford, PA | 2.0 | 1.0 | 868 | $1,750 | $2.02 | 20d | 1 | 1.41mi |
| 768 Putnam Blvd Unit A Wallingford, PA | 2.0 | 1.0 | 889 | $1,595 | $1.79 | 26d | 1 | 1.44mi |
| 732 Putnam Blvd Wallingford, PA | 2.0 | 1.0 | 889 | $1,700 | $1.91 | 7d | 1 | 1.48mi |
| 1400 MacDade Blvd Woodlyn, PA | 1.0–2.0 | 1.0 | 775 | $1,600 | $2.06 | 46d | 2 | 1.50mi |
Listing history 38 events
-
2026-06-21days on market $149,999 Active 87 DOM
-
2026-06-18days on market $149,999 Active 84 DOM
-
2026-06-17days on market $149,999 Active 83 DOM
-
2026-06-16days on market $149,999 Active 82 DOM
-
2026-06-15days on market $149,999 Active 81 DOM
-
2026-06-13days on market $149,999 Active 79 DOM
-
2026-06-13days on market $149,999 Active 78 DOM
-
2026-06-09days on market $149,999 Active 75 DOM
-
2026-06-08days on market $149,999 Active 74 DOM
-
2026-06-07days on market $149,999 Active 73 DOM
-
2026-06-04days on market $149,999 Active 70 DOM
-
2026-06-03days on market $149,999 Active 69 DOM
-
2026-06-02days on market $149,999 Active 68 DOM
-
2026-06-01days on market $149,999 Active 67 DOM
-
2026-05-31days on market $149,999 Active 66 DOM
-
2026-04-16price $149,999 704-char remark
Show marketing remark (704 chars)
Welcome Home! This home features a functional layout with comfortable living and dining areas, three nicely sized bedrooms, and a full bath. The clean, dry unfinished basement which is currently be used as additional living space, provides additional usable space. Ideal for storage, a home office, gym, or recreation. A converted garage adds extra square footage with potential for customization. Enjoy a front yard and a deep rear yard beyond the alley, perfect for outdoor use or future projects. Located just minutes from Subaru Park, home of the Philadelphia Union, with easy access to Philadelphia, Delaware, major highways, shopping, dining, and public transportation. Schedule your showing today.
-
2026-03-27$155,000 Active 704-char remark
Show marketing remark (704 chars)
Welcome Home! This home features a functional layout with comfortable living and dining areas, three nicely sized bedrooms, and a full bath. The clean, dry unfinished basement which is currently be used as additional living space, provides additional usable space. Ideal for storage, a home office, gym, or recreation. A converted garage adds extra square footage with potential for customization. Enjoy a front yard and a deep rear yard beyond the alley, perfect for outdoor use or future projects. Located just minutes from Subaru Park, home of the Philadelphia Union, with easy access to Philadelphia, Delaware, major highways, shopping, dining, and public transportation. Schedule your showing today.
-
2026-03-26historical $155,000 704-char remark
Show marketing remark (704 chars)
Welcome Home! This home features a functional layout with comfortable living and dining areas, three nicely sized bedrooms, and a full bath. The clean, dry unfinished basement which is currently be used as additional living space, provides additional usable space. Ideal for storage, a home office, gym, or recreation. A converted garage adds extra square footage with potential for customization. Enjoy a front yard and a deep rear yard beyond the alley, perfect for outdoor use or future projects. Located just minutes from Subaru Park, home of the Philadelphia Union, with easy access to Philadelphia, Delaware, major highways, shopping, dining, and public transportation. Schedule your showing today.
-
2026-02-01historical
-
2025-12-14$160,000 Active
-
2024-09-23soldstatus $128,000
-
2024-09-20soldstatus $128,000 Closed
-
2024-08-26historical Active Under Contract
-
2024-07-10$140,000 Active
-
2023-03-16soldstatus $535,000
-
2007-04-27soldstatus $62,000
-
2007-04-17soldstatus $62,000
-
2007-04-02historical
-
2007-03-12$62,000
-
2005-09-27soldstatus $64,000
-
2005-08-18soldstatus $64,000
-
2005-07-11historical
-
2005-06-27$64,000
-
2004-01-27soldstatus $47,500
-
2003-12-22soldstatus $47,500
-
2003-11-13historical
-
2003-09-22$47,500
-
1980-08-18soldstatus $26,900
ⓘ Source: listings_history table (triggers on properties + properties_extension) + one-shot
backfill from property_details.listing_events for pre-trigger history.
Tax reassessment forecast PA · Partial reset (capped growth)
- Current annual tax
- $4,695 · $391/mo
- Projected year-2 tax
- $4,695 · $391/mo
- Expected delta
- $0/yr ($0/mo · 0.0%)
ⓘ Screening estimate from a state-policy table — verify with the county assessor before closing.
Climate risk First Street
- Flood 1/10 Low FEMA zone X (unshaded) · 0% chance over 30 yrs
- Wildfire 1/10 Low
- Heat 7/10 Severe 7 d/yr ≥103°F today · 15 d/yr by 30 yrs out
- Wind 6/10 Major 27% chance of damaging wind over 30 yrs
- Air quality 3/10 Moderate 2 unhealthy d/yr today · 4 by 30 yrs out
Nearby sold comps map
Loading sold comps map…
Walkable amenities ~0.75 mi
Loading nearby amenities…
Taxation est. · year 1
- Rental income
- $19,883
- − Mortgage interest
- −$8,402
- − Property taxes
- −$4,695
- − Insurance
- −$750
- − Repairs & maintenance
- −$1,591
- − Management
- −$1,591
- − Depreciation
- −$4,364
- Taxable loss
- −$1,510
- Est. tax savings @ 24.0%
- +$362
- After-tax cash flow
- $1,185/yr
For passive investors: Depreciation is non-cash, so a rental often shows a tax loss while cash-flowing — sheltering income. Rental losses are passive: they offset passive income freely, and up to $25,000/yr can offset ordinary (W-2) income if you actively participate and your MAGI is under $100k (phasing out to $0 by $150k); unused losses carry forward. On sale, claimed depreciation is recaptured at up to 25%, and gains may owe capital-gains tax (a 1031 exchange can defer both). Figures are a year-1 estimate at your 24.0% rate — not tax advice; consult a CPA.
Schools (NCES district)
- District
- Chester-Upland SD
- NCES district ID
- 4205860
- Math proficiency
- 4% ▼ -3.00%
- Reading proficiency
- 17% ▼ -6.00%
- Median HH income
- $29,790
- Composite
- 8.05/100
- National rank
- #9918
- State rank
- #533 of 539 in PA
Livability — Chester
- Score
- 73/100
- State rank
- #540
- US rank
- #5053
Category grades
Schools grade is shown separately in the Schools card above.
Census & demographics
- Census place
- Chester, PA
- County
- Delaware County · 399,863 people
- City population
- 35,064
- Metro
- Philadelphia-Camden-Wilmington, PA-NJ-DE-MD
- Population (ZIP)
- 35,064
- Household income
- $41,261
- Rent vs Own
- Severe rent burden
- 2668.0
Population outlook (Delaware County) Hauer SSP2
- Today (2025)
- 577,490 people
- By 2030
- 581,243 · +0.6%
- By 2040
- 584,700 · +1.2%
- By 2050
- 586,581 · +1.6%
- By 2075
- 598,706 · +3.7%
- By 2100
- 590,823 · +2.3%
Race, ethnicity, and origin ACS 2023
- Neighborhood character
- Predominantly Black (71%)
- Race & ethnicity
- Black 71% White 14% Hispanic / Latino 9% Two or more races 4%
- Hispanic origin (detail)
- Puerto Rican 6%
- Common ancestry
- Romanian 2%
- Foreign-born
- 4% · Canada
- Languages at home
- 92% English-only · Spanish 6%
Political lean MEDSL · Delaware
- 2024 margin
- Strong D (+23.7) · D 61.4% · R 37.6% · Other 1.0%
- 2008→2024 swing
- +2.3pp toward D · 2008: 21.4pp · 2024: 23.7pp
- All cycles
- 2024: D+23.7 2020: D+26.7 2016: D+22.0 2012: D+21.8 2008: D+21.4
Not yet ingested
- Civics
- —
Market trends
- HPI YoY
- ▼ -149.69%
- Current HPI
- 219.5173
- Rent YoY
- ▲ 6.88%
- Metro
- Philadelphia-Camden-Wilmington, PA-NJ-DE-MD
- State GDP YoY
- ▲ 1.68%
- F500 in state
- 34
Industry mix (Fortune 500 HQ in PA)
| Industry | F500 HQs | Revenue |
|---|---|---|
| Healthcare | 2 | $309B |
|
||
| Insurance | 2 | $27B |
|
||
| Telecommunications / Media | 1 | $124B |
|
||
| Industrial Distribution | 1 | $22B |
|
||
| Financial Services | 1 | $20B |
|
||
| Chemicals / Materials | 1 | $18B |
|
||
Price history
+457.6% since first listed23 events — show timeline
- 2026-04-16 Price Changed $149,999 BRIGHT MLS
- 2026-03-27 Listed $155,000 BRIGHT MLS
- 2026-03-26 Coming Soon $155,000 BRIGHT MLS
- 2026-02-01 Listing Removed — BRIGHT MLS
- 2025-12-14 Listed $160,000 BRIGHT MLS
- 2024-09-23 Sold (Public Records) $128,000 Public Records
- 2024-09-20 Sold (MLS) $128,000 BRIGHT MLS
- 2024-08-26 Contingent — BRIGHT MLS
- 2024-07-10 Listed $140,000 BRIGHT MLS
- 2023-03-16 Sold (Public Records) $535,000 Public Records
- 2007-04-27 Sold (Public Records) $62,000 Public Records
- 2007-04-17 Sold (MLS) $62,000 BRIGHT MLS
- 2007-04-02 Listing Removed — BRIGHT MLS
- 2007-03-12 Listed $62,000 BRIGHT MLS
- 2005-09-27 Sold (Public Records) $64,000 Public Records
- 2005-08-18 Sold (MLS) $64,000 BRIGHT MLS
- 2005-07-11 Listing Removed — BRIGHT MLS
- 2005-06-27 Listed $64,000 BRIGHT MLS
- 2004-01-27 Sold (Public Records) $47,500 Public Records
- 2003-12-22 Sold (MLS) $47,500 BRIGHT MLS
- 2003-11-13 Listing Removed — BRIGHT MLS
- 2003-09-22 Listed $47,500 BRIGHT MLS
- 1980-08-18 Sold (Public Records) $26,900 Public Records
Property tax history
+21.2%/yrLatest (2026): $4,695 · +261.9% YoY. Source: county tax records.
Cash-flow waterfall
monthlySold comps — $/sqft
last 12 mo · ≤1 miLoading sold comps…