 Triplex
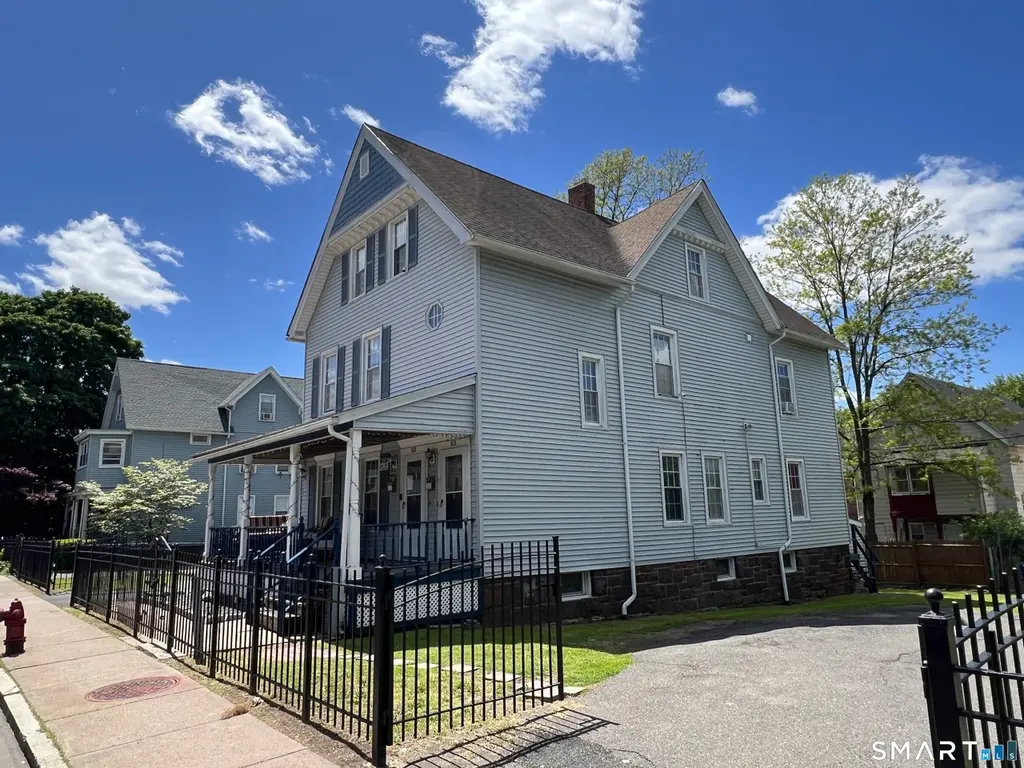
53-55 Dean St · Hartford, CT
Flood risk 1/10 · Minimal
- FEMA flood zone
- X (unshaded)
- Chance of flooding over 30 yrs
- 0.0%
- Est. flood insurance / yr
- $473 – $860
Fire risk 1/10 · Minimal
- Est. fire insurance / yr
- $829 – $1,539
Heat risk 5/10 · Moderate
- Hot days now (above 97°F)
- 7 days/yr
- Hot days in 30 yrs
- 16 days/yr
Wind risk 6/10 · Moderate
- Chance of severe wind over 30 yrs
- 27.0%
Air-quality risk 3/10 · Minor
- Unhealthy air days now
- 3 days/yr
- Unhealthy air days in 30 yrs
- 4 days/yr
Risk factors via First Street. Map © Google.
Why this score? — see what drove the B+ grade
The composite is a weighted blend of 9 inputs, each scored 0–100. Each bar is that input's sub-score; the figure is the points it added to the 100-point composite (weight × sub-score).
- Cash flow +30.0/30.0
- 1% rule +10.0/10.0
- DSCR +10.0/10.0
- Appreciation +10.0/10.0
- ARV discount +7.5/15.0
- Condition / age +4.0/5.0
- Livability +3.8/5.0
- Rent growth +2.9/5.0
- Schools +1.4/10.0
$399,900
🖨 Deal sheet 📄 Offer letter ✓ Due diligence
Multi-family units
County records classify this as Multi-Family (2-4 Unit). Listing-text estimate: 3 units. confirmed
Listing remarks
This is far from your typical three-family property! Lovingly owned and meticulously maintained by the same family since 1995, pride of ownership is evident throughout. Major improvements provide peace of mind, including a roof, vinyl siding, and replacement windows that are approximately 15 years young, along with all three gas-fired boilers replaced in 2024 and 2025. The property also features separate utilities, including three gas hot water heaters, three electrical services, and an owner's meter servicing the common areas, attic, and basement. Offering a desirable unit mix, the first-floor apartment features three bedrooms, the second-floor apartment offers three bedrooms, and the thir
Key facts
- 9,147 sq ft lot
- Built 1900
- Listed 6 days
Property features AI
Finance
- Other: Total of 3 units; 12 total rooms
Exterior
- Utilities: Public water connected; Public sewer connected; Natural gas for hot water and heating
- Home design: Multi-family property (3-family); Frame construction
- Construction: Asphalt shingle roof; Vinyl siding; Stone foundation; Built with frame construction
- Exterior features: Level lot; Sidewalk; Shed; Porch; Covered deck; Gutters
Interior
- Bedrooms: 7 bedrooms total
- Bathrooms: 3 full bathrooms
- Heating & cooling: Natural gas hot air heating; Storm doors and thermopane windows for improved energy efficiency
- Interior features: Thermostat(s); Full basement with hatchway
- Laundry & utility: Basement laundry hook-up; In-unit laundry hook-up (2 units); 40-gallon natural gas hot water tank
Neighborhood map
What this means for you Summary
Snapshot
- This is a 3 × 2-bed/1.0-bath units multifamily listed at $400k. Condition is rated good.
Deal economics
- At list price, monthly cash flow is $2k ($24k/yr) — positive. Per door: $657/mo.
- The deal already cash-flows at list — no discount required.
- Meets the 1% rule at list price ($6k rent vs $400k).
Location & tenants
- Location reads 76/100 on livability (#58 in CT, #3,553 nationally) — a middle-class / working-renter tenant base. Strengths: amenities A+, commute A+, health & safety A+; Watch: crime F, employment F.
- Hartford School District (urban): math 13% / reading 21% proficiency, ranked #150 of 153 in CT (top 98%) — low school quality limits family demand, transient renter base, plan for 1-2y turnover; 84% free/reduced lunch — lower-income household profile, screen leases tightly.
- Zoned schools: M. D. Fox School (math 12% / reading 9%, grade F, #506 of 553 statewide, top 92%, 493 students, 86% FRL); Bulkeley High School (math 5% / reading 15%, grade F, #185 of 194 statewide, top 96%, 548 students, 87% FRL) — zoned schools at 87% FRL track the district average.
- Market conditions: Rents rising (+1.5%/yr); 54 active listings in the ZIP; 1,867 units permitted in Capitol Planning Region in 2024 (1,399 in 5+ unit buildings).
- At $5,995/mo this rent would consume 138% of the median local household income ($52k/yr) (locally 1897% of renters already pay >50% of income on rent) — very limited rent-growth headroom before tenants either downsize or default.
Forward outlook
- In year one you build about $43k of equity ($3k loan paydown + $40k appreciation (10.0% local appreciation)).
- At projected returns (10.0% appreciation + 1.5% rent growth), your $112k cash investment doubles in ~2 years — after that, you're playing with house money.
- By year 2, paydown + projected appreciation supports a ~$69k cash-out refi (75% LTV) — recoverable capital for the next deal without selling this one.
Negotiation context
- Only 6 days on market — expect competitive offers; lowballing is unlikely to land.
Risks & watch-outs
- Watch-outs: built in 1900 — expect roof / HVAC / electrical / plumbing capex.
- Climate carrying-cost: major wind risk, 27% chance of damaging wind over 30y; extreme-heat days projected 7→16/yr by 2055 (HVAC capex compounding) — expect insurance premiums to compound above CPI over the hold.
Questions for the listing agent
- Can we see the unit-by-unit rent roll, current vacancy, and any below-market leases? What's the average tenancy length?
- What capital expenditures (roof, boiler, parking lot, exteriors) have been made in the last 5 years, and what's planned in the next 2?
- Built in 1900 — when were the roof, HVAC, electrical panel, plumbing, and water heater last replaced?
- Is there a deadline driving the sale (1031 exchange, divorce, estate, relocation)? That informs how much negotiation room exists.
- Schools are D-rated, which usually means shorter tenancies and higher turnover. Who's the typical renter profile here, and what's been the actual vacancy rate?
- Crime grade is F in this area — have there been break-ins, vandalism, or insurance claims at this property in the last 3 years? What carrier currently insures it and at what premium?
- What's the average days-on-market for RENTAL listings here right now (not sales)? A rising rental-DOM trend means longer vacancies and softer asking-rent achievability than the comps imply.
- What's the recent tenant-quality profile in this submarket — average credit score on applications, eviction rate, late-payment / NSF rate, and stable-employment percentage? A property-management company in the area should have these aggregated.
- How much new apartment / multifamily construction is in the pipeline within 1–3 miles? Heavy new supply (>2% of stock underway) typically softens rents 12–24 months out; light construction supports rent growth.
Investment metrics
- 1% rule
- 1.50% ✓
- Cap rate
- 12.21%
- Cash-on-cash
- 21.14%
- DSCR
- 1.94
- GRM
- 5.6
CMA / ARV
No comps found within radius.
Projected returns pro-forma
10.0% appreciation · 1.47% rent growth · sell at horizon
- IRR
- 39.3%
- Equity multiple
- 3.99×
- Total profit
- $334,421
- Equity at exit
- $360,262
- IRR
- 33.3%
- Equity multiple
- 8.76×
- Total profit
- $868,886
- Equity at exit
- $776,918
Cash invested: $111,972 (down + closing). Projections, not guarantees.
Landlord ↔ Tenant lean methodology
- Overall (STATE)
- 27 Tenant-Leaning
- State Connecticut
- 27 Tenant-Leaning · D+7
- County
- — inherits STATE
- City
- — inherits STATE
ZIP-level market 06114
- Home prices YoY
- 4.7%
- Rents YoY
- 1.5%
- Active inventory
- 54
- Price-to-rent
- 16.7×
Monthly cashflow live
- Estimated rent
- $5,995 high interval (Pro) →
- Mortgage (P&I)
- −$2,097
- Tax est. 1.5%
- −$500 /mo · $5,998/yr
- Insurance
- −$167
- HOA
- −$0
- Vacancy / Maint / Mgmt
- −$1,259
- Net cashflow
- $1,972
Break-even live
3-unit breakdown (identical units grouped — click to expand)
| Units | Beds | Baths | Est. rent |
|---|---|---|---|
| 3× units | 2 | 1 | $5,994 |
| #1 | 2 | 1 | $1,998 |
| #2 | 2 | 1 | $1,998 |
| #3 | 2 | 1 | $1,998 |
| Total (3 units) | $5,995 | ||
UW: 25.0% down · 7.5% · 30yr · 1.5% tax · 5.0% vac · 8.0% maint · 8.0% mgmt
Financing live
Cash to close
- Down payment
- $99,975
- Closing costs
- $11,997
- Reserves months
- —
- Total cash needed
- —
Loan-product check · same deal, 3 products live
Conventional
25% down · 7.5% · 30yr
- Down + closing
- —
- Monthly P&I
- —
- Monthly cashflow
- —
- DSCR
- —
- Eligible?
- —
Personal DTI + credit; lowest rate.
DSCR
20% down · 8.5% · 30yr
- Down + closing
- —
- Monthly P&I
- —
- Monthly cashflow
- —
- DSCR
- —
- Eligible?
- —
No personal income docs; deal must DSCR.
Hard money
10% down · 12.0% · 12mo
- Down + closing
- —
- Monthly P&I
- —
- Monthly cashflow
- —
- DSCR
- —
- Eligible?
- —
Short-term bridge; refi at stabilization.
Listing history 16 events
-
2026-06-18status $399,900 Under Contract 6 DOM
-
2026-06-17days on market $399,900 Active 6 DOM
-
2026-06-16days on market $399,900 Active 5 DOM
-
2026-06-15days on market $399,900 Active 4 DOM
-
2026-06-13days on market $399,900 Active 2 DOM
-
2026-06-13statusdays on market $399,900 Active 1 DOM
-
2026-06-10days on market $399,900 Coming Soon 12 DOM
-
2026-06-09days on market $399,900 Coming Soon 11 DOM
-
2026-06-08days on market $399,900 Coming Soon 10 DOM
-
2026-06-07days on market $399,900 Coming Soon 9 DOM
-
2026-06-05days on market $399,900 Coming Soon 6 DOM
-
2026-06-03days on market $399,900 Coming Soon 5 DOM
-
2026-06-02days on market $399,900 Coming Soon 4 DOM
-
2026-06-01days on market $399,900 Coming Soon 3 DOM
-
2026-05-31days on market $399,900 Coming Soon 2 DOM
-
2026-05-29historical $399,900
ⓘ Source: listings_history table (triggers on properties + properties_extension) + one-shot
backfill from property_details.listing_events for pre-trigger history.
Climate risk First Street
- Flood 1/10 Low FEMA zone X (unshaded) · 0% chance over 30 yrs
- Wildfire 1/10 Low
- Heat 5/10 Major 7 d/yr ≥97°F today · 16 d/yr by 30 yrs out
- Wind 6/10 Major 27% chance of damaging wind over 30 yrs
- Air quality 3/10 Moderate 3 unhealthy d/yr today · 4 by 30 yrs out
Nearby sold comps map
Loading sold comps map…
Walkable amenities ~0.75 mi
Loading nearby amenities…
Taxation est. · year 1
- Rental income
- $71,940
- − Mortgage interest
- −$22,401
- − Property taxes
- −$5,998
- − Insurance
- −$2,000
- − Repairs & maintenance
- −$5,755
- − Management
- −$5,755
- − Depreciation
- −$11,633
- Taxable income
- $18,398
- Est. tax owed @ 24.0%
- −$4,415
- After-tax cash flow
- $19,254/yr
For passive investors: Depreciation is non-cash, so a rental often shows a tax loss while cash-flowing — sheltering income. Rental losses are passive: they offset passive income freely, and up to $25,000/yr can offset ordinary (W-2) income if you actively participate and your MAGI is under $100k (phasing out to $0 by $150k); unused losses carry forward. On sale, claimed depreciation is recaptured at up to 25%, and gains may owe capital-gains tax (a 1031 exchange can defer both). Figures are a year-1 estimate at your 24.0% rate — not tax advice; consult a CPA.
Condition & rehab AI · 12 photos
This three-family property is in good condition with no major repairs needed. It offers a desirable unit mix and is well-maintained, making it a solid investment opportunity.
Value-add opportunities
- Both Painting the exterior — Fresh paint can enhance curb appeal and property value.
- Both Landscaping improvements — Well-maintained landscaping can increase both resale and rental value.
- Both Interior updates — Updating the interior can improve the home's appeal and increase its value.
- Both Energy-efficient upgrades — Upgrading to energy-efficient systems can reduce utility costs and improve the home's value.
- Both Kitchen and bathroom updates — Updating the kitchen and bathrooms can significantly increase the home's value and appeal to potential buyers/renters.
Renovation cost estimate screening
Value-add ROI direction
- Both Painting the exterior — Fresh paint can enhance curb appeal and property value. ↑
- Both Landscaping improvements — Well-maintained landscaping can increase both resale and rental value. ↑
- Both Interior updates — Updating the interior can improve the home's appeal and increase its value. ↑
- Both Energy-efficient upgrades — Upgrading to energy-efficient systems can reduce utility costs and improve the home's value. ↑
- Both Kitchen and bathroom updates — Updating the kitchen and bathrooms can significantly increase the home's value and appeal to potential buyers/renters. ↑
ⓘ Cost ranges are severity-bucket heuristics (US national rule-of-thumb). Get contractor quotes + a written scope before underwriting a rehab budget.
Schools (NCES district)
- District
- Hartford School District
- NCES district ID
- 0901920
- Math proficiency
- 13% ▼ -5.00%
- Reading proficiency
- 21% ▼ -6.00%
- Median HH income
- $30,521
- Composite
- 13.54/100
- National rank
- #9514
- State rank
- #150 of 153 in CT
Livability — Hartford
- Score
- 76/100
- State rank
- #58
- US rank
- #3553
Category grades
Schools grade is shown separately in the Schools card above.
Census & demographics
- Census place
- Hartford, CT
- County
- Hartford County · 754,208 people
- City population
- 121,162
- Metro
- Hartford-East Hartford-Middletown, CT
- Population (ZIP)
- 26,458
- Household income
- $52,110
- Rent vs Own
- Severe rent burden
- 1897.0
Population outlook (Capitol County) Hauer SSP2
- By 2040
- 1,063,519
Race, ethnicity, and origin ACS 2023
- Neighborhood character
- Diverse neighborhood (Simpson 0.57)
- Race & ethnicity
- Hispanic / Latino 60% White 19% Black 19% Two or more races 10% Native American 1%
- Hispanic origin (detail)
- Mexican 4% Puerto Rican 36% Dominican 6%
- Common ancestry
- American 6% Romanian 1% Lithuanian 1%
- Foreign-born
- 31% · Canada, Jamaica
- Languages at home
- 36% English-only · Spanish 49% Russian/Polish/Slavic 8% Other Indo-European 4%
Political lean MEDSL · Capitol
- 2024 margin
- Strong D (+21.9) · D 60.1% · R 38.2% · Other 1.7%
- All cycles
- 2024: D+21.9
Not yet ingested
- Civics
- —
Market trends
- HPI YoY
- ▲ 16.02%
- Current HPI
- 356.5892
- Rent YoY
- ▲ 1.47%
- Metro
- Hartford-East Hartford-Middletown, CT
- State GDP YoY
- ▲ 1.06%
- F500 in state
- 38
Industry mix (Fortune 500 HQ in CT)
| Industry | F500 HQs | Revenue |
|---|---|---|
| Industrial Machinery | 4 | $38B |
|
||
| Insurance | 3 | $71B |
|
||
| Financial Services | 2 | $25B |
|
||
| Transportation / Logistics | 2 | $18B |
|
||
| Healthcare | 1 | $247B |
|
||
| Telecommunications | 1 | $55B |
|
||
Price history
1 event — show timeline
- 2026-05-29 Coming Soon $399,900 Smart MLS
Cash-flow waterfall
monthlySold comps — $/sqft
last 12 mo · ≤1 miLoading sold comps…