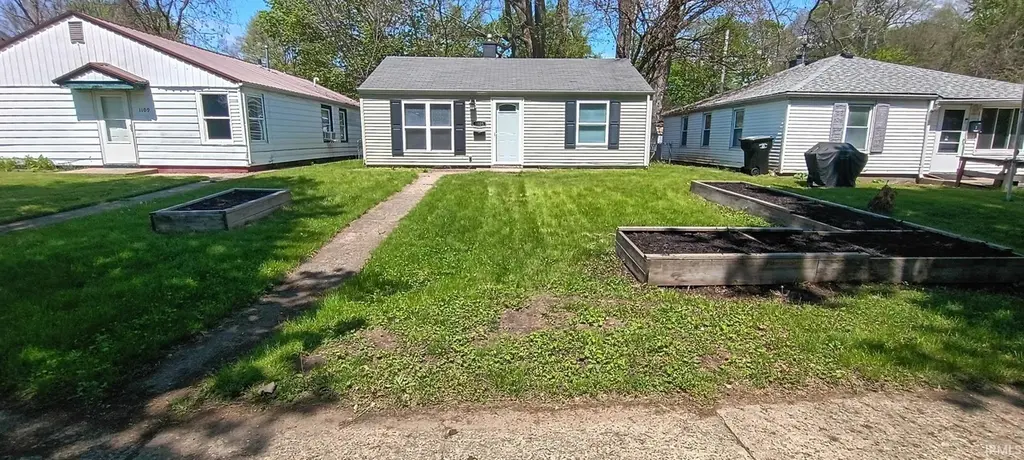
1105 W Rose St · South Bend, IN
Flood risk 10/10 · Severe
- FEMA flood zone
- X (unshaded)
- Chance of flooding over 30 yrs
- 0.99%
- Est. flood insurance / yr
- $507 – $1,088
Fire risk 1/10 · Minimal
- Est. fire insurance / yr
- $717 – $1,331
Heat risk 2/10 · Minimal
- Hot days now (above 99°F)
- 7 days/yr
- Hot days in 30 yrs
- 16 days/yr
Wind risk 2/10 · Minimal
- Chance of severe wind over 30 yrs
- —
Air-quality risk 3/10 · Minor
- Unhealthy air days now
- 3 days/yr
- Unhealthy air days in 30 yrs
- 3 days/yr
Risk factors via First Street. Map © Google.
Why this score? — see what drove the D- grade
The composite is a weighted blend of 9 inputs, each scored 0–100. Each bar is that input's sub-score; the figure is the points it added to the 100-point composite (weight × sub-score).
- Cash flow +16.8/30.0
- DSCR +5.2/10.0
- 1% rule +4.3/10.0
- Rent growth +4.1/5.0
- Livability +3.2/5.0
- Condition / age +2.5/5.0
- Schools +1.4/10.0
- ARV discount +0.0/15.0
- Appreciation +0.0/10.0
$115,000
🖨 Deal sheet 📄 Offer letter ✓ Due diligence
Listing remarks MLS
Own your home for less than rent. Cute 2 bed 1 bath home with all new windows, roof and siding in 2008. The bathroom has been redone and one bedroom. The bedroom has new studs, insulation, and flooring. Water heater was new within last 8 years. Home has a shed to store your mower and toys in. Call today! Agents "See Agent Remarks. "
Key facts
- Move-in ready
- New cabinets
- Spacious deck
Tags
Property features AI
Finance
- HOA & community: No association amenities
Exterior
- Utilities: Public water; Public sewer
- Home design: Single-story, single-family residence; Site-built home
- Construction: Aluminum and vinyl siding
- Exterior features: Level lot; Lot dimensions approximately 40 x 128
Interior
- Bedrooms: Total of 5 rooms (includes bedrooms and living spaces)
- Bathrooms: One full bathroom on the main level
- Heating & cooling: Forced-air heating; No central cooling
- Interior features: One fireplace
- Laundry & utility: Laundry on the main level
Neighborhood map
What this means for you Summary
Snapshot
- This is a 2-bed/1.0-bath single-family listed at $115k.
Deal economics
- At list price, monthly cash flow is $8 ($91/yr) — positive.
- The deal already cash-flows at list — no discount required.
- To meet the 1% rule (rent ≥ 1% of price), the offer needs to be $107k (6.9% below list).
- Recommended offer: $107k (6.9% below list) — sets the bar for 1% rule.
- Cap rate 7.1% vs local median 4.4% in South Bend — top-decile yield for the area; either an underpriced asset or a hidden risk that comps aren't pricing in. Stress-test before assuming the spread holds.
Location & tenants
- Location reads 64/100 on livability (#365 in IN) — a middle-class / working-renter tenant base. Strengths: cost of living A+, housing A+, health & safety A+; Watch: amenities D, employment D, crime F.
- South Bend Community School Corporation (urban): math 12% / reading 21% proficiency, ranked #284 of 301 in IN (top 94%) — low school quality limits family demand, transient renter base, plan for 1-2y turnover; 66% free/reduced lunch — lower-income household profile, screen leases tightly.
- Zoned schools: Muessel Elementary School (math 2% / reading 2%, grade F, #989 of 994 statewide, top 100%, 241 students, 88% FRL); Adams High School (math 28% / reading 57%, grade F, #195 of 369 statewide, top 53%, 1,976 students, 56% FRL).
- Market conditions: Rents rising fast (+6.5%/yr); 42 active listings in the ZIP; 12 comparable units currently listed for rent nearby; rentals lingering (median 44d on market — plan ~5-8 weeks vacancy on turnover, expect pricing pressure); 50% of comp listings sitting > 30 days — soft ceiling on asking rent; 754 units permitted in St. Joseph County in 2024 (460 in 5+ unit buildings).
Forward outlook
- Local home prices are declining (-3.0%/yr); year-one equity from $795 of loan paydown is wiped out by about $3k of value loss. Plan a longer hold.
Negotiation context
- Only 8 days on market — expect competitive offers; lowballing is unlikely to land.
- 2 sale attempts since 9y ago with the ask held roughly flat each time — persistent listings suggest the price (not the market) is what's stuck; bring a comps-based counter.
- Current owner paid $21k; list at $115k implies a 442% gain — meaningful room to come down on a strong offer.
Risks & watch-outs
- Watch-outs: flood insurance adds $66/mo; built in 1948 — expect roof / HVAC / electrical / plumbing capex.
- Climate carrying-cost: severe flood risk — expect insurance premiums to compound above CPI over the hold.
Questions for the listing agent
- Built in 1948 — when were the roof, HVAC, electrical panel, plumbing, and water heater last replaced?
- What's the actual annual flood-insurance premium (NFIP or private), and is the property in a SFHA with mandatory coverage?
- Is there a deadline driving the sale (1031 exchange, divorce, estate, relocation)? That informs how much negotiation room exists.
- Schools are F-rated, which usually means shorter tenancies and higher turnover. Who's the typical renter profile here, and what's been the actual vacancy rate?
- Crime grade is F in this area — have there been break-ins, vandalism, or insurance claims at this property in the last 3 years? What carrier currently insures it and at what premium?
- The area grade is low — what's the realistic commute time and amenity access for the typical tenant pool here? Any planned neighborhood developments (good or bad) we should know about?
- What's the average days-on-market for RENTAL listings here right now (not sales)? A rising rental-DOM trend means longer vacancies and softer asking-rent achievability than the comps imply.
- What's the recent tenant-quality profile in this submarket — average credit score on applications, eviction rate, late-payment / NSF rate, and stable-employment percentage? A property-management company in the area should have these aggregated.
- How much new for-sale + rental construction is in the pipeline within 1–3 miles? Heavy new supply typically softens prices + rents 12–24 months out; constrained supply supports both.
Investment metrics
- 1% rule
- 0.93% ✗
- Cap rate
- 7.07%
- Cash-on-cash
- 2.76%
- DSCR
- 1.12
- GRM
- 8.9
CMA / ARV
- ARV (on-the-fly)
- $92,160
- Comps found
- 12
Show comp detail 12 sales within ~0.75 mi
| Address | Dist | Beds/Ba | Sqft | Sold | Price | $/sf | Match |
|---|---|---|---|---|---|---|---|
| 1106 W Rose St | 0.03mi | 2/1.0 | 720 (0%) | 11mo | $92,000 | $128 | 90 |
| 2022 Hollywood Pl | 0.43mi | 2/1.0 | 746 (+4%) | 2mo | $175,500 | $235 | 72 |
| 1650 N Brookfield St | 0.59mi | 2/1.0 | 720 (0%) | 1mo | $50,000 | $69 | 72 |
| 1717 Anderson Ave | 0.33mi | 2/1.0 | 736 (+2%) | 13mo | $50,000 | $68 | 70 |
| 1113 Queen St | 0.13mi | 2/1.0 | 656 (-9%) | 13mo | $76,000 | $116 | 68 |
| 1518 Keller St | 0.36mi | 2/1.0 | 748 (+4%) | 14mo | $115,000 | $154 | 65 |
| 1701 Johnson St | 0.67mi | 2/1.0 | 720 (0%) | 7mo | $70,900 | $98 | 63 |
| 1333 College St | 0.65mi | 2/1.0 | 720 (0%) | 13mo | $105,000 | $146 | 59 |
| 1527 Elwood Ave | 0.48mi | 2/1.0 | 672 (-7%) | 15mo | $87,000 | $129 | 54 |
| 1404 Wilber St | 0.49mi | 3/1.5 (+1) | 768 (+7%) | 7mo | $70,000 | $91 | 53 |
| 1318 N Adams St | 0.60mi | 2/1.0 | 768 (+7%) | 11mo | $75,000 | $98 | 51 |
| 615 Marquette Ave | 0.57mi | 2/1.0 | 824 (+14%) | 11mo | $192,000 | $233 | 40 |
Match score weights: distance 35% · size 25% · config 20% · recency 20%. Top-matched comps best support the ARV.
Projected returns pro-forma
-3.0% appreciation · 6.49% rent growth · sell at horizon
- IRR
- -11.8%
- Equity multiple
- 0.56×
- Total profit
- $-14,215
- Equity at exit
- $17,147
- IRR
- 2.1%
- Equity multiple
- 1.17×
- Total profit
- $5,586
- Equity at exit
- $9,943
Cash invested: $32,200 (down + closing). Projections, not guarantees.
Landlord ↔ Tenant lean methodology
- Overall (STATE)
- 90 Strongly Landlord-Friendly
- State Indiana
- 90 Strongly Landlord-Friendly · R+11
- County
- — inherits STATE
- City
- — inherits STATE
ZIP-level market 46616
- Home prices YoY
- -17.9%
- Rents YoY
- 6.5%
- Active inventory
- 42
- Price-to-rent
- 8.9×
Monthly cashflow live
- Estimated rent
- $1,071 high interval (Pro) →
- Mortgage (P&I)
- −$603
- Tax from tax record
- −$121 /mo · $1,454/yr
- Insurance
- −$48
- Flood insurance flood zone
- −$66 /mo · $798/yr
- HOA
- −$0
- Vacancy / Maint / Mgmt
- −$225
- Net cashflow
- $8
Break-even live
UW: 25.0% down · 7.5% · 30yr · 1.5% tax · 5.0% vac · 8.0% maint · 8.0% mgmt
Financing live
Cash to close
- Down payment
- $28,750
- Closing costs
- $3,450
- Reserves months
- —
- Total cash needed
- —
Loan-product check · same deal, 3 products live
Conventional
25% down · 7.5% · 30yr
- Down + closing
- —
- Monthly P&I
- —
- Monthly cashflow
- —
- DSCR
- —
- Eligible?
- —
Personal DTI + credit; lowest rate.
DSCR
20% down · 8.5% · 30yr
- Down + closing
- —
- Monthly P&I
- —
- Monthly cashflow
- —
- DSCR
- —
- Eligible?
- —
No personal income docs; deal must DSCR.
Hard money
10% down · 12.0% · 12mo
- Down + closing
- —
- Monthly P&I
- —
- Monthly cashflow
- —
- DSCR
- —
- Eligible?
- —
Short-term bridge; refi at stabilization.
Rent comps 12 comps
| Address | Beds | Baths | Sqft | Rent | $/sqft | DOM | Units | Dist |
|---|---|---|---|---|---|---|---|---|
| 937 Roosevelt St South Bend, IN | 2.0 | 1.0 | 720 | $1,060 | $1.47 | 43d | 1 | 0.13mi |
| 929 Beale St South Bend, IN | 2.0 | 1.0 | 720 | $975 | $1.35 | 43d | 1 | 0.18mi |
| 1308 Kinyon St South Bend, IN | 2.0 | 1.0 | 700 | $1,100 | $1.57 | 43d | 1 | 0.21mi |
| 2013 Elwood Ave South Bend, IN | 3.0 | 1.0 | 720 | $999 | $1.39 | 43d | 1 | 0.76mi |
| 1709 Huey St South Bend, IN | 2.0 | 1.0 | 720 | $995 | $1.38 | 21d | 1 | 0.81mi |
| 1301 N Michigan St South Bend, IN | 1.0 | 1.0 | 575 | $740 | $1.29 | 21d | 1 | 0.86mi |
| 1614 Fremont St South Bend, IN | 2.0 | 1.0 | 720 | $850 | $1.18 | 21d | 1 | 0.98mi |
| 717 Huey St South Bend, IN | 2.0 | 1.0 | 672 | $1,050 | $1.56 | 43d | 1 | 1.24mi |
| 729 N Elmer St South Bend, IN | 2.0 | 1.0 | 672 | $1,100 | $1.64 | 13d | 1 | 1.28mi |
| 2823 Calhoun St South Bend, IN | 2.0 | 1.0 | 720 | $1,249 | $1.73 | 43d | 1 | 1.28mi |
| 125 W Marion St South Bend, IN | 2.0 | 1.0 | 672 | $1,350 | $2.01 | 13d | 5 | 1.33mi |
| 716 N Niles Ave South Bend, IN | 1.0–2.0 | 1.0–2.0 | 732 | $1,750 | $2.39 | 13d | 11 | 1.36mi |
Listing history 3 events
-
2026-05-19$115,000 Active
-
2017-08-30soldstatus $21,200 346-char remark
Show marketing remark (346 chars)
Own your home for less than rent. Cute 2 bed 1 bath home with all new windows, roof and siding in 2008. The bathroom has been redone and one bedroom. The bedroom has new studs, insulation, and flooring. Water heater was new within last 8 years. Home has a shed to store your mower and toys in. Call today! Agents "See Agent Remarks. "
-
2017-06-13$28,000 346-char remark
Show marketing remark (346 chars)
Own your home for less than rent. Cute 2 bed 1 bath home with all new windows, roof and siding in 2008. The bathroom has been redone and one bedroom. The bedroom has new studs, insulation, and flooring. Water heater was new within last 8 years. Home has a shed to store your mower and toys in. Call today! Agents "See Agent Remarks. "
ⓘ Source: listings_history table (triggers on properties + properties_extension) + one-shot
backfill from property_details.listing_events for pre-trigger history.
Tax reassessment forecast IN · Partial reset (capped growth)
- Current annual tax
- $1,454 · $121/mo
- Projected year-2 tax
- $1,454 · $121/mo
- Expected delta
- $0/yr ($0/mo · 0.0%)
ⓘ Screening estimate from a state-policy table — verify with the county assessor before closing.
Climate risk First Street
- Flood 10/10 Extreme FEMA zone X (unshaded) · 99% chance over 30 yrs
- Wildfire 1/10 Low
- Heat 2/10 Low 7 d/yr ≥99°F today · 16 d/yr by 30 yrs out
- Wind 2/10 Low
- Air quality 3/10 Moderate 3 unhealthy d/yr today · 3 by 30 yrs out
Nearby sold comps map
Loading sold comps map…
Walkable amenities ~0.75 mi
Loading nearby amenities…
Taxation est. · year 1
- Rental income
- $12,854
- − Mortgage interest
- −$6,442
- − Property taxes
- −$1,454
- − Insurance
- −$1,372
- − Repairs & maintenance
- −$1,028
- − Management
- −$1,028
- − Depreciation
- −$3,345
- Taxable loss
- −$1,816
- Est. tax savings @ 24.0%
- +$436
- After-tax cash flow
- $527/yr
For passive investors: Depreciation is non-cash, so a rental often shows a tax loss while cash-flowing — sheltering income. Rental losses are passive: they offset passive income freely, and up to $25,000/yr can offset ordinary (W-2) income if you actively participate and your MAGI is under $100k (phasing out to $0 by $150k); unused losses carry forward. On sale, claimed depreciation is recaptured at up to 25%, and gains may owe capital-gains tax (a 1031 exchange can defer both). Figures are a year-1 estimate at your 24.0% rate — not tax advice; consult a CPA.
Schools (NCES district)
- District
- South Bend Community School Corporation
- NCES district ID
- 1810290
- Math proficiency
- 12% ▼ -10.00%
- Reading proficiency
- 21% ▼ -6.00%
- Median HH income
- $41,935
- Composite
- 14.21/100
- National rank
- #9452
- State rank
- #284 of 301 in IN
Livability — South Bend
- Score
- 64/100
- State rank
- #365
- US rank
- #13730
Category grades
Schools grade is shown separately in the Schools card above.
Census & demographics
- Census place
- South Bend, IN
- County
- Saint Joseph County · 189,048 people
- City population
- 99,767
- Metro
- South Bend-Mishawaka, IN-MI
- Population (ZIP)
- 5,979
- Household income
- $58,537
- Rent vs Own
- Severe rent burden
- 339.0
Population outlook (St. Joseph County) Hauer SSP2
- Today (2025)
- 273,186 people
- By 2030
- 273,594 · +0.1%
- By 2040
- 271,641 · -0.6%
- By 2050
- 269,187 · -1.5%
- By 2075
- 263,136 · -3.7%
- By 2100
- 245,659 · -10.1%
Race, ethnicity, and origin ACS 2023
- Neighborhood character
- Diverse neighborhood (Simpson 0.59)
- Race & ethnicity
- White 59% Black 21% Hispanic / Latino 16% Two or more races 14% Asian 1%
- Hispanic origin (detail)
- Mexican 9% Puerto Rican 2%
- Common ancestry
- Romanian 7% Portuguese 2% Slovak 2%
- Foreign-born
- 5% · Canada, China
- Languages at home
- 90% English-only · Spanish 7% Other Indo-European 1%
Political lean MEDSL · St. Joseph
- 2024 margin
- Toss-up / Even · D 50.0% · R 48.5% · Other 1.5%
- 2008→2024 swing
- -15.6pp toward R · 2008: 17.1pp · 2024: 1.5pp
- All cycles
- 2024: D+1.5 2020: D+5.8 2016: D+0.2 2012: D+3.5 2008: D+17.1
Not yet ingested
- Civics
- —
Market trends
- HPI YoY
- ▼ -51.53%
- Current HPI
- 237.0154
- Rent YoY
- ▲ 6.49%
- Metro
- South Bend-Mishawaka, IN-MI
- State GDP YoY
- ▲ 2.90%
- F500 in state
- 18
Industry mix (Fortune 500 HQ in IN)
| Industry | F500 HQs | Revenue |
|---|---|---|
| Industrial Machinery | 2 | $37B |
|
||
| Healthcare | 1 | $177B |
|
||
| Pharmaceuticals | 1 | $45B |
|
||
| Metals / Steel | 1 | $18B |
|
||
| Agriculture | 1 | $17B |
|
||
| Packaging | 1 | $12B |
|
||
Price history
+310.7% since first listed3 events — show timeline
- 2026-05-19 Listed $115,000 IRMLS
- 2017-08-30 Sold (MLS) $21,200 IRMLS
- 2017-06-13 Listed $28,000 IRMLS
Property tax history
-2.2%/yrLatest (2023): $1,454 · +19.1% YoY. Source: county tax records.
Cash-flow waterfall
monthlySold comps — $/sqft
last 12 mo · ≤1 miLoading sold comps…