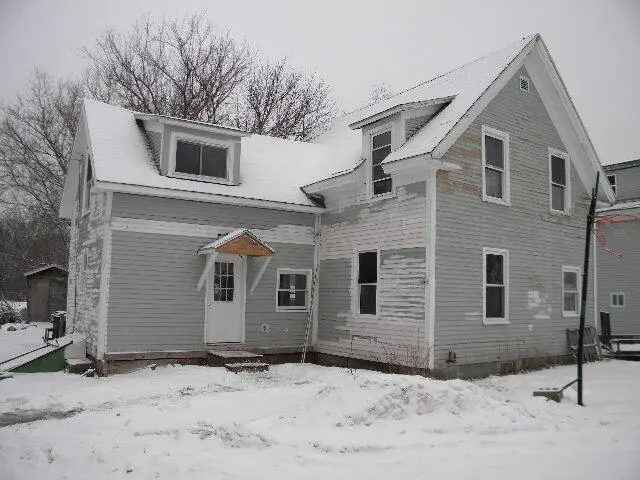
19 Depot St · Mattawamkeag, ME
Flood risk No data
- FEMA flood zone
- —
- Chance of flooding over 30 yrs
- —
- Est. flood insurance / yr
- —
Fire risk No data
- Est. fire insurance / yr
- —
Heat risk No data
- Hot days now (above threshold)
- —
- Hot days in 30 yrs
- —
Wind risk No data
- Chance of severe wind over 30 yrs
- —
Air-quality risk No data
- Unhealthy air days now
- —
- Unhealthy air days in 30 yrs
- —
Risk factors via First Street. Map © Google.
Why this score? — see what drove the A- grade
The composite is a weighted blend of 9 inputs, each scored 0–100. Each bar is that input's sub-score; the figure is the points it added to the 100-point composite (weight × sub-score).
- Cash flow +30.0/30.0
- ARV discount +15.0/15.0
- DSCR +10.0/10.0
- 1% rule +9.6/10.0
- Schools +6.8/10.0
- Appreciation +5.0/10.0
- Rent growth +2.5/5.0
- Livability +2.5/5.0
- Condition / age +2.5/5.0
$85,000
🖨 Deal sheet (PDF) 📄 Offer letter ✓ Due diligence
Listing remarks MLS
3-bedroom home, with kitchen, dining area and living room, the home is located close to the town office. The home is in need of repairs but could be a nice home. home is priced accordingly.
Key facts
- 0.8 acre lot
- Parking
- Built 1880
Neighborhood map
What this means for you Summary
Snapshot
- This is a 3-bed/1.0-bath single-family listed at $85k.
Deal economics
- At list price, monthly cash flow is $438 ($5k/yr) — positive.
- The deal already cash-flows at list — no discount required.
- Meets the 1% rule at list price ($1k rent vs $85k).
- Recommended offer: $75k (12.0% below list) — sets the bar for market timing.
Location & tenants
- Location reads: area grade A — affects rentability + tenant quality, not the cash-flow math above.
- RSU 67 (rural): math 79% / reading 85% proficiency, ranked #83 of 112 in ME (top 74%) — strong family-tenant draw, lease renewals of 3-5y typical.
- Zoned schools: Ella P Burr School (math 74% / reading 84%, grade A, #182 of 294 statewide, top 69%, 307 students, 44% FRL); Mattanawcook Jr High School (math 78% / reading 85%, grade A+, #56 of 85 statewide, top 67%, 325 students, 45% FRL); Mattanawcook Academy (math 84% / reading 84%, grade A, #75 of 108 statewide, top 83%, 308 students, 39% FRL).
- Market conditions: 8 active listings in the ZIP; 440 units permitted in Penobscot County in 2024 (40 in 5+ unit buildings).
Forward outlook
- In year one you build about $3k of equity ($588 loan paydown + $3k appreciation (3.0% local appreciation)).
- Penobscot County population projected at -17% by 2050 — secular population decline; favor cash flow + early exit over multi-decade hold.
- At projected returns (3.0% appreciation + 3.0% rent growth), your $24k cash investment doubles in ~3 years — after that, you're playing with house money.
- By year 10, paydown + projected appreciation supports a ~$30k cash-out refi (75% LTV) — recoverable capital for the next deal without selling this one.
Negotiation context
- It's been on market 161 days — a 12% lower offer ($75k) is reasonable based on typical stale-listing flexibility.
Risks & watch-outs
- Watch-outs: built in 1880 — expect roof / HVAC / electrical / plumbing capex.
Questions for the listing agent
- It's been on market 161 days. Have you received any prior offers? Is the seller open to a 12% concession, seller financing, or rate buy-down credit?
- Built in 1880 — when were the roof, HVAC, electrical panel, plumbing, and water heater last replaced?
- Why hasn't it sold? Are there any deal-killer items the seller is aware of (foundation, flood, title, zoning, code violations)?
- Is there a deadline driving the sale (1031 exchange, divorce, estate, relocation)? That informs how much negotiation room exists.
- What's the average days-on-market for RENTAL listings here right now (not sales)? A rising rental-DOM trend means longer vacancies and softer asking-rent achievability than the comps imply.
- What's the recent tenant-quality profile in this submarket — average credit score on applications, eviction rate, late-payment / NSF rate, and stable-employment percentage? A property-management company in the area should have these aggregated.
- How much new for-sale + rental construction is in the pipeline within 1–3 miles? Heavy new supply typically softens prices + rents 12–24 months out; constrained supply supports both.
Investment metrics
- 1% rule
- 1.46% ✓
- Cap rate
- 12.47%
- Cash-on-cash
- 22.08%
- DSCR
- 1.98
- GRM
- 5.7
CMA / ARV
- ARV (median comp)
- $108,238
- List price
- $85,000
- Delta
- -21.47%
- Verdict
- UNDERPRICED
- Comps
- 5 within 1.0 mi
Show comp detail 5 sales within ~0.75 mi
| Address | Dist | Beds/Ba | Sqft | Sold | Price | $/sf | Match |
|---|---|---|---|---|---|---|---|
| 17 Willow St | 0.07mi | 3/2.0 | 2,421 | 2mo | $247,500 | $102 | 79 |
| 262 Main St | 0.27mi | 4/2.0 (+1) | 2,000 | 1mo | $67,000 | $34 | 65 |
| 45 Hathaway Rd | 0.34mi | 2/1.0 (-1) | 941 | 7mo | $111,000 | $118 | 61 |
| 450 N Main St | 0.64mi | 3/1.5 | 1,936 | 0mo | $265,000 | $137 | 55 |
| 48 Medway Rd | 0.71mi | 4/2.0 (+1) | 1,440 | 13mo | $140,000 | $97 | 35 |
Match score weights: distance 35% · size 25% · config 20% · recency 20%. Top-matched comps best support the ARV.
Projected returns pro-forma
3.0% appreciation · 3.0% rent growth · sell at horizon
- IRR
- 28.3%
- Equity multiple
- 2.60×
- Total profit
- $38,121
- Equity at exit
- $38,220
- IRR
- 28.8%
- Equity multiple
- 5.06×
- Total profit
- $96,624
- Equity at exit
- $58,901
Cash invested: $23,800 (down + closing). Projections, not guarantees.
Landlord ↔ Tenant lean methodology
- Overall (STATE)
- 41 Moderately Tenant-Leaning
- State Maine
- 41 Moderately Tenant-Leaning · D+2
- County
- — inherits STATE
- City
- — inherits STATE
ZIP-level market 04459
- Active inventory
- 8
- Price-to-rent
- 5.7×
Monthly cashflow live
- Estimated rent
- $1,243 medium interval (Pro) →
- Mortgage (P&I)
- −$446
- Tax from tax record
- −$63 /mo · $759/yr
- Insurance
- −$35
- HOA
- −$0
- Lot rent
- −$0
- Vacancy / Maint / Mgmt
- −$261
- Net cashflow
- $438
Break-even live
Sensitivity live
| Price | -10% $486 | -5% $462 | +0% $438 | +5% $414 | +10% $390 |
|---|---|---|---|---|---|
| Rent | -10% $340 | -5% $389 | +0% $438 | +5% $487 | +10% $536 |
| Rate | -1.0pp $481 | -0.5pp $460 | base $438 | +0.5pp $416 | +1.0pp $393 |
UW: 25.0% down · 7.5% · 30yr · 1.5% tax · 5.0% vac · 8.0% maint · 8.0% mgmt
Financing live
Cash to close
- Down payment
- $21,250
- Closing costs
- $2,550
- Reserves months
- —
- Total cash needed
- —
Loan-product check · same deal, 3 products live
Conventional
25% down · 7.5% · 30yr
- Down + closing
- —
- Monthly P&I
- —
- Monthly cashflow
- —
- DSCR
- —
- Eligible?
- —
Personal DTI + credit; lowest rate.
DSCR
20% down · 8.5% · 30yr
- Down + closing
- —
- Monthly P&I
- —
- Monthly cashflow
- —
- DSCR
- —
- Eligible?
- —
No personal income docs; deal must DSCR.
Hard money
10% down · 12.0% · 12mo
- Down + closing
- —
- Monthly P&I
- —
- Monthly cashflow
- —
- DSCR
- —
- Eligible?
- —
Short-term bridge; refi at stabilization.
Listing history 19 events
-
2026-06-22days on market $85,000 Active 161 DOM
-
2026-06-21days on market $85,000 Active 160 DOM
-
2026-06-21days on market $85,000 Active 159 DOM
-
2026-06-18days on market $85,000 Active 157 DOM
-
2026-06-17days on market $85,000 Active 156 DOM
-
2026-06-16days on market $85,000 Active 155 DOM
-
2026-06-15days on market $85,000 Active 154 DOM
-
2026-06-13days on market $85,000 Active 152 DOM
-
2026-06-12days on market $85,000 Active 151 DOM
-
2026-06-09days on market $85,000 Active 148 DOM
-
2026-06-08days on market $85,000 Active 147 DOM
-
2026-06-07days on market $85,000 Active 146 DOM
-
2026-06-07days on market $85,000 Active 145 DOM
-
2026-06-04days on market $85,000 Active 142 DOM
-
2026-06-02days on market $85,000 Active 141 DOM
-
2026-06-01days on market $85,000 Active 140 DOM
-
2026-05-31days on market $85,000 Active 139 DOM
-
2026-05-31days on market $85,000 Active 138 DOM
-
2026-01-12$85,000 Active 189-char remark
Show marketing remark (189 chars)
3-bedroom home, with kitchen, dining area and living room, the home is located close to the town office. The home is in need of repairs but could be a nice home. home is priced accordingly.
ⓘ Source: listings_history table (triggers on properties + properties_extension) + one-shot
backfill from property_details.listing_events for pre-trigger history.
Tax reassessment forecast ME · Partial reset (capped growth)
- Current annual tax
- $759 · $63/mo
- Projected year-2 tax
- $958 · $80/mo
- Expected delta
- +$198/yr (+$17/mo · 26.2%)
ⓘ Screening estimate from a state-policy table — verify with the county assessor before closing.
Nearby sold comps map
Loading sold comps map…
Walkable amenities ~0.75 mi
Loading nearby amenities…
Taxation est. · year 1
- Rental income
- $14,921
- − Mortgage interest
- −$4,761
- − Property taxes
- −$759
- − Insurance
- −$425
- − Repairs & maintenance
- −$1,194
- − Management
- −$1,194
- − Depreciation
- −$2,473
- Taxable income
- $4,116
- Est. tax owed @ 24.0%
- −$988
- After-tax cash flow
- $4,267/yr
For passive investors: Depreciation is non-cash, so a rental often shows a tax loss while cash-flowing — sheltering income. Rental losses are passive: they offset passive income freely, and up to $25,000/yr can offset ordinary (W-2) income if you actively participate and your MAGI is under $100k (phasing out to $0 by $150k); unused losses carry forward. On sale, claimed depreciation is recaptured at up to 25%, and gains may owe capital-gains tax (a 1031 exchange can defer both). Figures are a year-1 estimate at your 24.0% rate — not tax advice; consult a CPA.
Schools (NCES district)
- District
- RSU 67
- NCES district ID
- 2314777
- Math proficiency
- 79% ▲ 50.00%
- Reading proficiency
- 85% ▲ 38.00%
- Median HH income
- $36,167
- Composite
- 67.98/100
- National rank
- #357
- State rank
- #83 of 112 in ME
Livability — Mattawamkeag
No livability data for this city. (Only ~50 U.S. cities are tracked.)
Census & demographics
- Census place
- Mattawamkeag, ME
- Population (ZIP)
- 703
Population outlook (Penobscot County) Hauer SSP2
- Today (2025)
- 149,928 people
- By 2030
- 146,386 · -2.4%
- By 2040
- 135,952 · -9.3%
- By 2050
- 123,864 · -17.4%
- By 2075
- 97,825 · -34.8%
- By 2100
- 77,196 · -48.5%
Race, ethnicity, and origin ACS 2023
- Neighborhood character
- Predominantly White (90%)
- Race & ethnicity
- White 90% Two or more races 5% Black 4%
- Common ancestry
- Lithuanian 18% Slovak 6% Serbian 1%
- Foreign-born
- 1% · Canada
- Languages at home
- 99% English-only · French/Haitian/Cajun 1%
Political lean MEDSL · Penobscot
- 2024 margin
- R (+10.9) · D 43.6% · R 54.5% · Other 1.9%
- 2008→2024 swing
- -15.9pp toward R · 2008: 5.0pp · 2024: -10.9pp
- All cycles
- 2024: R+10.9 2020: R+8.3 2016: R+10.9 2012: D+2.9 2008: D+5.0
Not yet ingested
- Civics
- —
Market trends
- HPI YoY
- —
- Current HPI
- —
- Rent YoY
- —
- Metro
- —
- State GDP YoY
- —
- F500 in state
- 0
Price history
1 event — show timeline
- 2026-01-12 Listed $85,000 MREIS
Property tax history
-0.7%/yrLatest (2017): $759 · +0.8% YoY. Source: county tax records.
Cash-flow waterfall
monthlySold comps — $/sqft
last 12 mo · ≤1 miLoading sold comps…