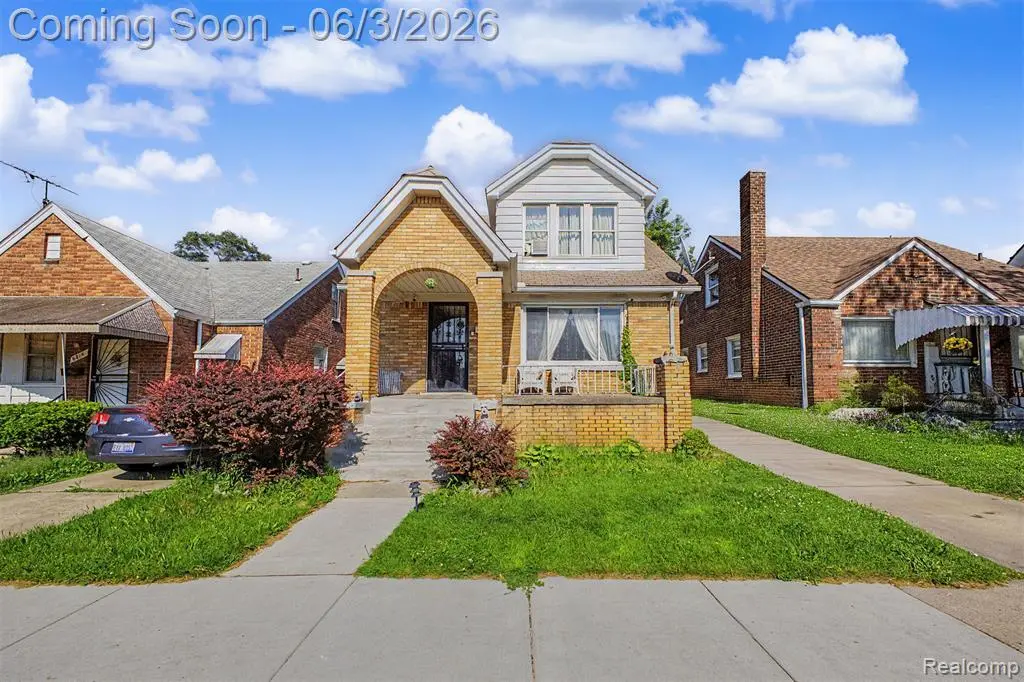
6808 Abington Ave · Detroit, MI
Flood risk 1/10 · Minimal
- FEMA flood zone
- X (unshaded)
- Chance of flooding over 30 yrs
- 0.0%
- Est. flood insurance / yr
- $473 – $860
Fire risk 1/10 · Minimal
- Est. fire insurance / yr
- $784 – $1,456
Heat risk 3/10 · Minor
- Hot days now (above 97°F)
- 7 days/yr
- Hot days in 30 yrs
- 15 days/yr
Wind risk 2/10 · Minimal
- Chance of severe wind over 30 yrs
- —
Air-quality risk 3/10 · Minor
- Unhealthy air days now
- 2 days/yr
- Unhealthy air days in 30 yrs
- 4 days/yr
Risk factors via First Street. Map © Google.
Why this score? — see what drove the D grade
The composite is a weighted blend of 9 inputs, each scored 0–100. Each bar is that input's sub-score; the figure is the points it added to the 100-point composite (weight × sub-score).
- Cash flow +20.8/30.0
- DSCR +6.6/10.0
- 1% rule +4.7/10.0
- Livability +3.7/5.0
- Condition / age +2.5/5.0
- Rent growth +1.9/5.0
- Schools +1.3/10.0
- ARV discount +0.0/15.0
- Appreciation +0.0/10.0
$139,900
🖨 Deal sheet 📄 Offer letter ✓ Due diligence
Listing remarks MLS
CLEAN BRICK COLONIAL, INVESTORS WILL LOVE . LRAGE HOME WITH 4+ BEDROOMS FOR THIS PRICE. POSITIVE CASH FLOW CITY. HURRY THIS ONE WILL GO QUICKLY
Key facts
- 4,356 sq ft lot
- Garage
- Built 1929
Property features AI
Exterior
- Parking: Detached garage (1.5 parking spaces)
- Utilities: Natural gas heat; Public water (to property and at street); Public sewer at street
- Home design: Residential property; 1 1/2-story structure; Built in 1929; Frontage approximately 35 feet
- Construction: Basement foundation
- Exterior features: Brick exterior; Paved street access
Interior
- Bedrooms: Four bedrooms located on the second floor (approx. dimensions: 12 x 10; 10 x 10; 10; 10 x 10)
- Bathrooms: Two full bathrooms (one on the second floor, one in the basement)
- Heating & cooling: Forced air heating; Central air conditioning
- Interior features: Total of 6 rooms; Finished basement
Neighborhood map
What this means for you Summary
Snapshot
- This is a 4-bed/1.0-bath single-family listed at $140k.
Deal economics
- At list price, monthly cash flow is $191 ($2k/yr) — positive.
- The deal already cash-flows at list — no discount required.
- To meet the 1% rule (rent ≥ 1% of price), the offer needs to be $135k (3.4% below list).
- Recommended offer: $135k (3.4% below list) — sets the bar for 1% rule.
- Cap rate 7.9% vs local median 10.2% in Detroit — below-typical yield; the buyer is paying a premium for something (appreciation thesis, condition, location) that the cap rate doesn't capture.
Location & tenants
- Location reads 73/100 on livability (#218 in MI) — a middle-class / working-renter tenant base. Strengths: amenities A+, commute A+, cost of living A+; Watch: schools F, crime F, employment F.
- Detroit Public Schools Community District (urban): math 10% / reading 24% proficiency, ranked #499 of 540 in MI (top 92%) — low school quality limits family demand, transient renter base, plan for 1-2y turnover; 90% free/reduced lunch — lower-income household profile, screen leases tightly.
- Market conditions: Rents soft (-2.3%/yr); 363 active listings in the ZIP; 13 comparable units currently listed for rent nearby; rentals at typical pace (median 22d on market — plan ~3-4 weeks tenant-placement turnaround); lower-income renter base — watch delinquency; 2,639 units permitted in Wayne County in 2024 (1,216 in 5+ unit buildings).
- At $1,351/mo this rent would consume 53% of the median local household income ($31k/yr) (locally 4144% of renters already pay >50% of income on rent) — very limited rent-growth headroom before tenants either downsize or default.
Forward outlook
- Local home prices are declining (-3.0%/yr); year-one equity from $967 of loan paydown is wiped out by about $4k of value loss. Plan a longer hold.
- Wayne County population projected at -17% by 2050 — secular population decline; favor cash flow + early exit over multi-decade hold.
Negotiation context
- Only 7 days on market — expect competitive offers; lowballing is unlikely to land.
- 2 sale attempts since 16y ago; this cycle's ask is 1313% above the opening price — seller raised mid-cycle; expect resistance to lowballs.
- Current owner paid $12k; list at $140k implies a 1042% gain — meaningful room to come down on a strong offer.
Risks & watch-outs
- Watch-outs: built in 1929 — expect roof / HVAC / electrical / plumbing capex.
Questions for the listing agent
- Built in 1929 — when were the roof, HVAC, electrical panel, plumbing, and water heater last replaced?
- Is there a deadline driving the sale (1031 exchange, divorce, estate, relocation)? That informs how much negotiation room exists.
- Schools are F-rated, which usually means shorter tenancies and higher turnover. Who's the typical renter profile here, and what's been the actual vacancy rate?
- Crime grade is F in this area — have there been break-ins, vandalism, or insurance claims at this property in the last 3 years? What carrier currently insures it and at what premium?
- The area grade is low — what's the realistic commute time and amenity access for the typical tenant pool here? Any planned neighborhood developments (good or bad) we should know about?
- What's the average days-on-market for RENTAL listings here right now (not sales)? A rising rental-DOM trend means longer vacancies and softer asking-rent achievability than the comps imply.
- What's the recent tenant-quality profile in this submarket — average credit score on applications, eviction rate, late-payment / NSF rate, and stable-employment percentage? A property-management company in the area should have these aggregated.
- How much new for-sale + rental construction is in the pipeline within 1–3 miles? Heavy new supply typically softens prices + rents 12–24 months out; constrained supply supports both.
Investment metrics
- 1% rule
- 0.97% ✗
- Cap rate
- 7.93%
- Cash-on-cash
- 5.86%
- DSCR
- 1.26
- GRM
- 8.6
CMA / ARV
- ARV (on-the-fly)
- $106,116
- Comps found
- 12
Show comp detail 12 sales within ~0.75 mi
| Address | Dist | Beds/Ba | Sqft | Sold | Price | $/sf | Match |
|---|---|---|---|---|---|---|---|
| 6514 Woodmont Ave | 0.19mi | 3/1.0 (-1) | 1,433 (-0%) | 4mo | $112,000 | $78 | 83 |
| 7318 Clayburn St | 0.28mi | 3/1.0 (-1) | 1,530 (+7%) | 9mo | $85,000 | $56 | 63 |
| 6815 Mettetal St | 0.23mi | 3/2.0 (-1) | 1,536 (+7%) | 10mo | $161,000 | $105 | 60 |
| 6125 Rosemont Ave | 0.67mi | 3/1.0 (-1) | 1,445 (+1%) | 5mo | $70,000 | $48 | 59 |
| 6857 Woodmont Ave | 0.11mi | 3/1.5 (-1) | 1,234 (-14%) | 7mo | $129,000 | $105 | 59 |
| 7522 Forrer St | 0.66mi | 3/1.0 (-1) | 1,425 (-1%) | 7mo | $75,000 | $53 | 58 |
| 6303 Ashton Ave | 0.53mi | 4/2.5 | 1,509 (+5%) | 9mo | $130,000 | $86 | 53 |
| 7041 Yinger Ave | 0.73mi | 4/2.0 | 1,513 (+6%) | 3mo | $185,000 | $122 | 50 |
| 6380 Rosemont Ave | 0.52mi | 4/2.0 | 1,600 (+12%) | 5mo | $100,000 | $63 | 49 |
| 6390 Archdale St | 0.37mi | 5/1.0 (+1) | 1,600 (+12%) | 12mo | $40,000 | $25 | 49 |
| 6303 Grandmont Ave | 0.35mi | 3/2.0 (-1) | 1,230 (-14%) | 4mo | $90,000 | $73 | 48 |
| 7800 Rutland St | 0.59mi | 3/1.0 (-1) | 1,611 (+12%) | 8mo | $120,000 | $74 | 40 |
Match score weights: distance 35% · size 25% · config 20% · recency 20%. Top-matched comps best support the ARV.
Projected returns pro-forma
-3.0% appreciation · 0.0% rent growth · sell at horizon
- IRR
- -10.4%
- Equity multiple
- 0.63×
- Total profit
- $-14,475
- Equity at exit
- $20,860
- IRR
- -5.6%
- Equity multiple
- 0.68×
- Total profit
- $-12,355
- Equity at exit
- $12,096
Cash invested: $39,172 (down + closing). Projections, not guarantees.
Landlord ↔ Tenant lean methodology
- Overall (STATE)
- 62 Landlord-Friendly
- State Michigan
- 62 Landlord-Friendly · EVEN
- County
- — inherits STATE
- City
- — inherits STATE
ZIP-level market 48228
- Rents YoY
- -2.3%
- Active inventory
- 363
- Price-to-rent
- 8.6×
Monthly cashflow live
- Estimated rent
- $1,351 high interval (Pro) →
- Mortgage (P&I)
- −$734
- Tax from tax record
- −$84 /mo · $1,010/yr
- Insurance
- −$58
- HOA
- −$0
- Vacancy / Maint / Mgmt
- −$284
- Net cashflow
- $191
Break-even live
UW: 25.0% down · 7.5% · 30yr · 1.5% tax · 5.0% vac · 8.0% maint · 8.0% mgmt
Financing live
Cash to close
- Down payment
- $34,975
- Closing costs
- $4,197
- Reserves months
- —
- Total cash needed
- —
Loan-product check · same deal, 3 products live
Conventional
25% down · 7.5% · 30yr
- Down + closing
- —
- Monthly P&I
- —
- Monthly cashflow
- —
- DSCR
- —
- Eligible?
- —
Personal DTI + credit; lowest rate.
DSCR
20% down · 8.5% · 30yr
- Down + closing
- —
- Monthly P&I
- —
- Monthly cashflow
- —
- DSCR
- —
- Eligible?
- —
No personal income docs; deal must DSCR.
Hard money
10% down · 12.0% · 12mo
- Down + closing
- —
- Monthly P&I
- —
- Monthly cashflow
- —
- DSCR
- —
- Eligible?
- —
Short-term bridge; refi at stabilization.
Rent comps 13 comps
| Address | Beds | Baths | Sqft | Rent | $/sqft | DOM | Units | Dist |
|---|---|---|---|---|---|---|---|---|
| 6761 Memorial Ave Detroit, MI | 3.0 | 1.0 | 1060 | $1,100 | $1.04 | 24d | 1 | 0.11mi |
| 6474 Saint Marys St Detroit, MI | 3.0 | 1.0 | 1237 | $1,350 | $1.09 | 43d | 1 | 0.33mi |
| 7312 Mansfield St Detroit, MI | 4.0 | 1.0 | 1300 | $1,400 | $1.08 | 16d | 1 | 0.46mi |
| 6490 Stahelin Ave Detroit, MI | 3.0 | 1.0 | 960 | $1,299 | $1.35 | 16d | 1 | 0.78mi |
| 8047 Robson St Detroit, MI | 3.0 | 2.0 | 1184 | $1,200 | $1.01 | 43d | 1 | 1.16mi |
| 7283 Minock St Detroit, MI | 3.0 | 1.5 | 1520 | $1,200 | $0.79 | 3d | 1 | 1.20mi |
| 8331 Whitcomb St Detroit, MI | 4.0 | 1.0 | 1342 | $1,350 | $1.01 | 22d | 1 | 1.22mi |
| 8850 Rosemont Ave Detroit, MI | 3.0 | 1.0 | 933 | $1,100 | $1.18 | 18d | 1 | 1.32mi |
| 8604 Whitcomb St Detroit, MI | 3.0 | 2.0 | 1033 | $1,300 | $1.26 | 43d | 1 | 1.35mi |
| 8212 Lauder St Detroit, MI | 3.0 | 1.0 | 1026 | $1,150 | $1.12 | 43d | 1 | 1.35mi |
| 8114 Marlowe St Unit home Detroit, MI | 3.0 | 1.0 | 985 | $1,350 | $1.37 | 43d | 1 | 1.35mi |
| 5521 Fairlane Woods Dr Dearborn, MI | 1.0–3.0 | 1.0–2.0 | 1164 | $2,430 | $2.09 | 1d | 12 | 1.36mi |
| 9108 Archdale St Detroit, MI | 3.0 | 1.0 | 1000 | $1,300 | $1.30 | 5d | 1 | 1.43mi |
Listing history 8 events
-
2026-06-10status $139,900 Pending 7 DOM
-
2026-06-09days on market $139,900 Active 7 DOM
-
2026-06-08days on market $139,900 Active 6 DOM
-
2026-06-07days on market $139,900 Active 5 DOM
-
2026-06-04days on market $139,900 Active 2 DOM
-
2026-06-03status $139,900 Active 1 DOM
-
2026-06-02remarks 699-char remark
-
2026-06-02$139,900 Coming Soon 1 DOM
ⓘ Source: listings_history table (triggers on properties + properties_extension) + one-shot
backfill from property_details.listing_events for pre-trigger history.
Tax reassessment forecast MI · Partial reset (capped growth)
- Current annual tax
- $1,010 · $84/mo
- Projected year-2 tax
- $1,582 · $132/mo
- Expected delta
- +$572/yr (+$48/mo · 56.7%)
ⓘ Screening estimate from a state-policy table — verify with the county assessor before closing.
Climate risk First Street
- Flood 1/10 Low FEMA zone X (unshaded) · 0% chance over 30 yrs
- Wildfire 1/10 Low
- Heat 3/10 Moderate 7 d/yr ≥97°F today · 15 d/yr by 30 yrs out
- Wind 2/10 Low
- Air quality 3/10 Moderate 2 unhealthy d/yr today · 4 by 30 yrs out
Nearby sold comps map
Loading sold comps map…
Walkable amenities ~0.75 mi
Loading nearby amenities…
Taxation est. · year 1
- Rental income
- $16,215
- − Mortgage interest
- −$7,837
- − Property taxes
- −$1,010
- − Insurance
- −$700
- − Repairs & maintenance
- −$1,297
- − Management
- −$1,297
- − Depreciation
- −$4,070
- Taxable income
- $5
- Est. tax owed @ 24.0%
- −$1
- After-tax cash flow
- $2,296/yr
For passive investors: Depreciation is non-cash, so a rental often shows a tax loss while cash-flowing — sheltering income. Rental losses are passive: they offset passive income freely, and up to $25,000/yr can offset ordinary (W-2) income if you actively participate and your MAGI is under $100k (phasing out to $0 by $150k); unused losses carry forward. On sale, claimed depreciation is recaptured at up to 25%, and gains may owe capital-gains tax (a 1031 exchange can defer both). Figures are a year-1 estimate at your 24.0% rate — not tax advice; consult a CPA.
Schools (NCES district)
- District
- Detroit Public Schools Community District
- NCES district ID
- 2601103
- Math proficiency
- 10% ▼ -2.00%
- Reading proficiency
- 24% ▲ 6.00%
- Median HH income
- $25,815
- Composite
- 13.06/100
- National rank
- #9564
- State rank
- #499 of 540 in MI
Livability — Detroit
- Score
- 73/100
- State rank
- #218
- US rank
- #5427
Category grades
Schools grade is shown separately in the Schools card above.
Census & demographics
- Census place
- Detroit, MI
- County
- Wayne County · 1,562,939 people
- City population
- 572,865
- Metro
- Detroit-Warren-Dearborn, MI
- Population (ZIP)
- 50,117
- Household income
- $30,680
- Rent vs Own
- Severe rent burden
- 4144.0
Population outlook (Wayne County) Hauer SSP2
- Today (2025)
- 1,675,273 people
- By 2030
- 1,620,300 · -3.3%
- By 2040
- 1,502,341 · -10.3%
- By 2050
- 1,384,039 · -17.4%
- By 2075
- 1,124,592 · -32.9%
- By 2100
- 881,193 · -47.4%
Race, ethnicity, and origin ACS 2023
- Neighborhood character
- Predominantly Black (71%)
- Race & ethnicity
- Black 71% White 16% Two or more races 7% Hispanic / Latino 6%
- Hispanic origin (detail)
- Mexican 3% Puerto Rican 2%
- Common ancestry
- Arab 2% Romanian 2% Lithuanian 1%
- Foreign-born
- 11% · Canada
- Languages at home
- 82% English-only · Arabic 11% Spanish 5%
Political lean MEDSL · Wayne
- 2024 margin
- Strong D (+29.0) · D 62.7% · R 33.7% · Other 3.6%
- 2008→2024 swing
- -20.5pp toward R · 2008: 49.5pp · 2024: 29.0pp
- All cycles
- 2024: D+29.0 2020: D+38.1 2016: D+37.3 2012: D+46.9 2008: D+49.5
Not yet ingested
- Civics
- —
Market trends
- HPI YoY
- ▼ -160.81%
- Current HPI
- 168.6843
- Rent YoY
- ▼ -2.30%
- Metro
- Detroit-Warren-Dearborn, MI
- State GDP YoY
- ▲ 1.37%
- F500 in state
- 28
Industry mix (Fortune 500 HQ in MI)
| Industry | F500 HQs | Revenue |
|---|---|---|
| Automotive Parts | 3 | $48B |
|
||
| Automotive | 2 | $372B |
|
||
| Chemicals | 1 | $45B |
|
||
| Automotive Retail | 1 | $29B |
|
||
| Healthcare / Medical Devices | 1 | $23B |
|
||
| Automotive Technology | 1 | $20B |
|
||
Price history
+1313.1% since first listed6 events — show timeline
- 2026-06-02 Coming Soon $139,900 MiRealSource-MiMLS
- 2010-02-15 Sold (MLS) $12,250 REALCOMP
- 2010-02-15 Sold (MLS) $12,250 MiRealSource-MiMLS
- 2010-01-29 Listing Removed — MiRealSource-MiMLS
- 2010-01-23 Listed $9,900 REALCOMP
- 2010-01-23 Listed $9,900 MiRealSource-MiMLS
Property tax history
-6.2%/yrLatest (2025): $1,010 · -40.0% YoY. Source: county tax records.
Cash-flow waterfall
monthlySold comps — $/sqft
last 12 mo · ≤1 miLoading sold comps…