 🏷️ Likely Rental
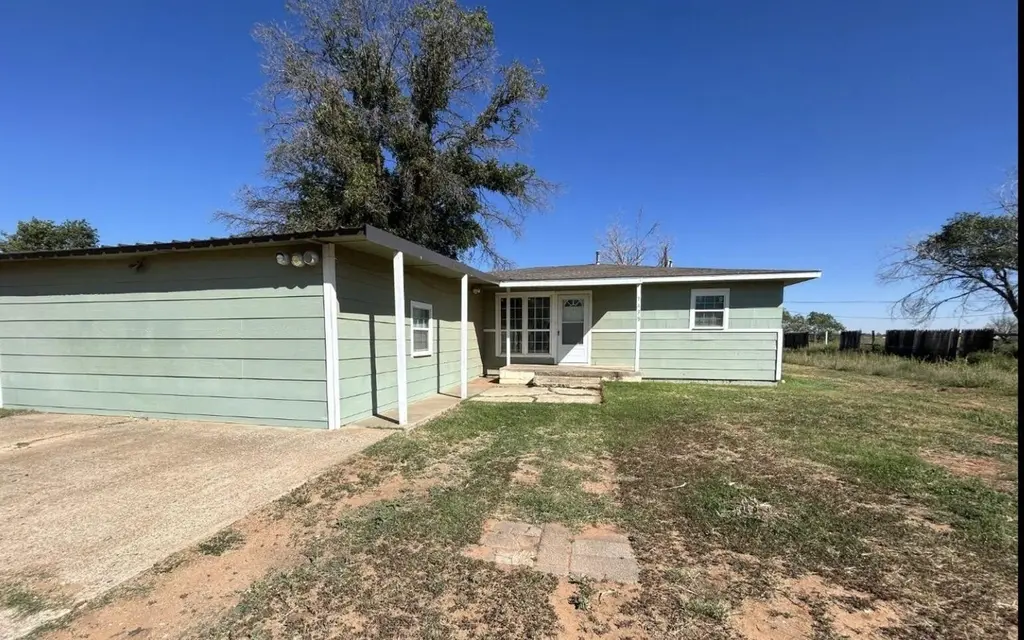
7438 18th St · Lubbock, TX
Flood risk 1/10 · Minimal
- FEMA flood zone
- X (unshaded)
- Chance of flooding over 30 yrs
- 0.0%
- Est. flood insurance / yr
- $507 – $1,088
Fire risk 5/10 · Moderate
- Est. fire insurance / yr
- $1,222 – $2,270
Heat risk 5/10 · Moderate
- Hot days now (above 99°F)
- 7 days/yr
- Hot days in 30 yrs
- 22 days/yr
Wind risk 2/10 · Minimal
- Chance of severe wind over 30 yrs
- 0.0%
Air-quality risk 2/10 · Minimal
- Unhealthy air days now
- 1 days/yr
- Unhealthy air days in 30 yrs
- 1 days/yr
Risk factors via First Street. Map © Google.
Why this score? — see what drove the C+ grade
The composite is a weighted blend of 9 inputs, each scored 0–100. Each bar is that input's sub-score; the figure is the points it added to the 100-point composite (weight × sub-score).
- Cash flow +26.3/30.0
- DSCR +8.9/10.0
- ARV discount +7.5/15.0
- 1% rule +6.9/10.0
- Schools +4.4/10.0
- Livability +4.0/5.0
- Rent growth +3.1/5.0
- Condition / age +2.5/5.0
- Appreciation +0.0/10.0
$149,900
🖨 Deal sheet (PDF) 📄 Offer letter ✓ Due diligence
Listing remarks MLS
Spacious four-bedroom, two-bath home located just west of Lubbock, offering the perfect blend of country charm and convenient access to town. The garage has been thoughtfully converted into a large primary suite, providing a private retreat, though it could easily serve as a second living area if desired. Each of the additional bedrooms is generously sized and features either original wood flooring or durable vinyl plank. Renovated just a few years ago, the home is in excellent condition and move-in ready. With a current month-to-month lease in place, it presents a fantastic opportunity for immediate rental income or a comfortable residence for anyone needing extra space at an attractive price.
Key facts
- 0.39 acre lot
- Built 1953
- Listed 73 days
Neighborhood map
What this means for you Summary
Snapshot
- This is a 3-bed/2.0-bath single-family listed at $150k.
Deal economics
- At list price, monthly cash flow is $387 ($5k/yr) — positive.
- The deal already cash-flows at list — no discount required.
- Meets the 1% rule at list price ($2k rent vs $150k).
- Recommended offer: $141k (6.0% below list) — sets the bar for market timing.
Location & tenants
- Location reads 80/100 on livability (#37 in TX, #1,749 nationally) — a professional / high-income tenant draw. Strengths: commute A+, cost of living A+, housing A+; Watch: employment C-, crime F.
- Frenship ISD (urban): math 47% / reading 54% proficiency, ranked #162 of 826 in TX (top 20%) — acceptable for families but not a draw, mixed tenant base, ~2y average lease.
- Zoned schools: Willow Bend El (math 34% / reading 41%, grade F, #1,744 of 4,322 statewide, top 41%, 730 students, 74% FRL); Terra Vista Middle (math 37% / reading 44%, grade F, #637 of 1,662 statewide, top 39%, 891 students, 66% FRL); Frenship H S (math 44% / reading 65%, grade C-, #379 of 1,632 statewide, top 26%, 3,247 students, 46% FRL) — zoned schools average 62% FRL vs 36% district-wide (25 pts higher); higher-poverty schools than district average — tighter screening recommended.
- Market conditions: Rents rising (+2.2%/yr); 466 active listings in the ZIP; 27 comparable units currently listed for rent nearby; rentals at typical pace (median 23d on market — plan ~3-4 weeks tenant-placement turnaround); 44% of comp listings sitting > 30 days — soft ceiling on asking rent; 2,219 units permitted in Lubbock County in 2024 (252 in 5+ unit buildings).
- This rent runs 34% of the median local income ($64k/yr) — at the standard rent-burdened threshold; future hikes will face affordability resistance.
Forward outlook
- Local home prices are declining (-3.0%/yr); year-one equity from $1k of loan paydown is wiped out by about $4k of value loss. Plan a longer hold.
- Lubbock County population projected at +39% by 2050 — long-run rental-demand tailwind backs the buy-and-hold thesis.
Negotiation context
- It's been on market 73 days — a 6% lower offer ($141k) is reasonable based on typical stale-listing flexibility.
- 2 sale attempts since 2y ago with the ask held roughly flat each time — persistent listings suggest the price (not the market) is what's stuck; bring a comps-based counter.
Risks & watch-outs
- Watch-outs: built in 1953 — expect roof / HVAC / electrical / plumbing capex.
- Climate carrying-cost: moderate wildfire risk; extreme-heat days projected 7→22/yr by 2055 (HVAC capex compounding) — expect insurance premiums to compound above CPI over the hold.
Questions for the listing agent
- It's been on market 73 days. Have you received any prior offers? Is the seller open to a 6% concession, seller financing, or rate buy-down credit?
- Built in 1953 — when were the roof, HVAC, electrical panel, plumbing, and water heater last replaced?
- Why hasn't it sold? Are there any deal-killer items the seller is aware of (foundation, flood, title, zoning, code violations)?
- Is there a deadline driving the sale (1031 exchange, divorce, estate, relocation)? That informs how much negotiation room exists.
- Schools are D-rated, which usually means shorter tenancies and higher turnover. Who's the typical renter profile here, and what's been the actual vacancy rate?
- Crime grade is F in this area — have there been break-ins, vandalism, or insurance claims at this property in the last 3 years? What carrier currently insures it and at what premium?
- What's the average days-on-market for RENTAL listings here right now (not sales)? A rising rental-DOM trend means longer vacancies and softer asking-rent achievability than the comps imply.
- What's the recent tenant-quality profile in this submarket — average credit score on applications, eviction rate, late-payment / NSF rate, and stable-employment percentage? A property-management company in the area should have these aggregated.
- How much new for-sale + rental construction is in the pipeline within 1–3 miles? Heavy new supply typically softens prices + rents 12–24 months out; constrained supply supports both.
Investment metrics
- 1% rule
- 1.19% ✓
- Cap rate
- 9.39%
- Cash-on-cash
- 11.06%
- DSCR
- 1.49
- GRM
- 7.0
CMA / ARV
- ARV (median comp)
- $335,441
- List price
- $149,900
- Delta
- -55.31%
- Verdict
- UNDERPRICED
- Comps
- 1 within 2.0 mi
Projected returns pro-forma
-3.0% appreciation · 2.21% rent growth · sell at horizon
- IRR
- -0.7%
- Equity multiple
- 0.98×
- Total profit
- $-1,044
- Equity at exit
- $22,351
- IRR
- 8.2%
- Equity multiple
- 1.60×
- Total profit
- $25,202
- Equity at exit
- $12,961
Cash invested: $41,972 (down + closing). Projections, not guarantees.
Landlord ↔ Tenant lean methodology
- Overall (STATE)
- 87 Strongly Landlord-Friendly
- State Texas
- 87 Strongly Landlord-Friendly · R+5
- County
- — inherits STATE
- City
- — inherits STATE
ZIP-level market 79416
- Home prices YoY
- -20.0%
- Rents YoY
- 2.2%
- Active inventory
- 466
- Price-to-rent
- 7.0×
Monthly cashflow live
- Estimated rent
- $1,789 high interval (Pro) →
- Mortgage (P&I)
- −$786
- Tax from tax record
- −$178 /mo · $2,140/yr
- Insurance
- −$62
- HOA
- −$0
- Vacancy / Maint / Mgmt
- −$376
- Net cashflow
- $387
Break-even live
Sensitivity live
| Price | -10% $472 | -5% $429 | +0% $387 | +5% $344 | +10% $302 |
|---|---|---|---|---|---|
| Rent | -10% $245 | -5% $316 | +0% $387 | +5% $458 | +10% $528 |
| Rate | -1.0pp $462 | -0.5pp $425 | base $387 | +0.5pp $348 | +1.0pp $308 |
UW: 25.0% down · 7.5% · 30yr · 1.5% tax · 5.0% vac · 8.0% maint · 8.0% mgmt
Financing live
Cash to close
- Down payment
- $37,475
- Closing costs
- $4,497
- Reserves months
- —
- Total cash needed
- —
Loan-product check · same deal, 3 products live
Conventional
25% down · 7.5% · 30yr
- Down + closing
- —
- Monthly P&I
- —
- Monthly cashflow
- —
- DSCR
- —
- Eligible?
- —
Personal DTI + credit; lowest rate.
DSCR
20% down · 8.5% · 30yr
- Down + closing
- —
- Monthly P&I
- —
- Monthly cashflow
- —
- DSCR
- —
- Eligible?
- —
No personal income docs; deal must DSCR.
Hard money
10% down · 12.0% · 12mo
- Down + closing
- —
- Monthly P&I
- —
- Monthly cashflow
- —
- DSCR
- —
- Eligible?
- —
Short-term bridge; refi at stabilization.
Rent comps 27 comps
| Address | Beds | Baths | Sqft | Rent | $/sqft | DOM | Units | Dist |
|---|---|---|---|---|---|---|---|---|
| 7452 8th St Lubbock, TX | 4.0 | 2.0 | 1727 | $2,075 | $1.20 | 15d | 1 | 0.65mi |
| 7105 14th St Lubbock, TX | 4.0 | 2.0 | 1600 | $1,950 | $1.22 | 23d | 1 | 0.70mi |
| 7324 9th St Lubbock, TX | 4.0 | 2.0 | 1778 | $1,950 | $1.10 | 23d | 1 | 0.70mi |
| 7216 24th St Lubbock, TX | 3.0 | 2.0 | 1732 | $1,700 | $0.98 | 45d | 1 | 0.72mi |
| 7415 5th St Unit 2 Lubbock, TX | 3.0 | 2.0 | 1300 | $1,450 | $1.12 | 45d | 1 | 0.81mi |
| 7403 5th St Lubbock, TX | 3.0 | 2.0 | 1306 | $1,349 | $1.03 | 45d | 1 | 0.83mi |
| 7410 5th St Unit 1 Lubbock, TX | 3.0 | 2.0 | 1271 | $1,400 | $1.10 | 45d | 1 | 0.85mi |
| 6927 20th St Lubbock, TX | 3.0 | 2.0 | 1611 | $1,599 | $0.99 | 23d | 1 | 0.89mi |
| 2911 Urbana Pl Lubbock, TX | 3.0 | 2.0 | 1452 | $1,800 | $1.24 | 23d | 1 | 0.89mi |
| 2612 Tiffin Ave Lubbock, TX | 3.0 | 2.0 | 1600 | $1,775 | $1.11 | 15d | 1 | 0.92mi |
| 2801 Trenton Ave Unit LO Lubbock, TX | 3.0 | 2.0 | 1722 | $1,799 | $1.04 | 23d | 1 | 0.95mi |
| 1409 Quincy Ave Lubbock, TX | 3.0 | 2.0 | 1553 | $2,800 | $1.80 | 23d | 1 | 0.99mi |
| 2625 Tiffin Ave Lubbock, TX | 3.0 | 2.0 | 1552 | $1,800 | $1.16 | 45d | 1 | 0.99mi |
| 7541 33rd St Lubbock, TX | 3.0 | 2.0 | 1296 | $1,500 | $1.16 | 23d | 1 | 1.04mi |
| 7420 35th St Lubbock, TX | 3.0 | 2.0 | 1247 | $1,500 | $1.20 | 45d | 1 | 1.12mi |
| 7413 35th St Lubbock, TX | 3.0 | 2.0 | 1247 | $1,475 | $1.18 | 23d | 1 | 1.15mi |
| 6813 7th St Lubbock, TX | 3.0 | 2.0 | 1452 | $1,550 | $1.07 | 23d | 1 | 1.23mi |
| 7222 35th St Lubbock, TX | 3.0 | 2.0 | 1450 | $1,935 | $1.33 | 45d | 1 | 1.30mi |
| 3414 Tiffin Ave Lubbock, TX | 3.0 | 2.0 | 1550 | $1,799 | $1.16 | 15d | 1 | 1.32mi |
| 1003 Oshkosh Ave Lubbock, TX | 3.0 | 2.0 | 1835 | $2,000 | $1.09 | 15d | 1 | 1.34mi |
| 3518 Turner Ave Lubbock, TX | 3.0 | 2.0 | 1450 | $2,199 | $1.52 | 45d | 1 | 1.37mi |
| 8601 10th Pl Lubbock, TX | 3.0 | 2.0 | 1530 | $1,575 | $1.03 | 45d | 1 | 1.41mi |
| 6806 4th St Lubbock, TX | 3.0 | 3.0 | 1500 | $1,500 | $1.00 | 45d | 1 | 1.44mi |
| 6806 4th St Unit D Lubbock, TX | 3.0 | 3.0 | 1640 | $1,550 | $0.95 | 45d | 1 | 1.44mi |
| 2617 Garland Ave Lubbock, TX | 4.0 | 2.0 | 1703 | $2,000 | $1.17 | 23d | 1 | 1.45mi |
| 8522 11th St Lubbock, TX | 3.0 | 2.0 | 1530 | $1,750 | $1.14 | 15d | 1 | 1.47mi |
| 6724 4th St Lubbock, TX | 3.0 | 3.0 | 1640 | $1,500 | $0.91 | 45d | 1 | 1.47mi |
Listing history 24 events
-
2026-06-22days on market $149,900 Active 73 DOM
-
2026-06-18days on market $149,900 Active 70 DOM
-
2026-06-17days on market $149,900 Active 69 DOM
-
2026-06-16days on market $149,900 Active 68 DOM
-
2026-06-15days on market $149,900 Active 67 DOM
-
2026-06-13days on market $149,900 Active 64 DOM
-
2026-06-10days on market $149,900 Active 62 DOM
-
2026-06-09days on market $149,900 Active 61 DOM
-
2026-06-08days on market $149,900 Active 60 DOM
-
2026-06-07days on market $149,900 Active 59 DOM
-
2026-06-05days on market $149,900 Active 56 DOM
-
2026-06-03days on market $149,900 Active 55 DOM
-
2026-06-02days on market $149,900 Active 54 DOM
-
2026-06-01days on market $149,900 Active 53 DOM
-
2026-05-31days on market $149,900 Active 52 DOM
-
2026-05-30days on market $149,900 Active 51 DOM
-
2026-05-13price $149,900 703-char remark
Show marketing remark (703 chars)
Spacious four-bedroom, two-bath home located just west of Lubbock, offering the perfect blend of country charm and convenient access to town. The garage has been thoughtfully converted into a large primary suite, providing a private retreat, though it could easily serve as a second living area if desired. Each of the additional bedrooms is generously sized and features either original wood flooring or durable vinyl plank. Renovated just a few years ago, the home is in excellent condition and move-in ready. With a current month-to-month lease in place, it presents a fantastic opportunity for immediate rental income or a comfortable residence for anyone needing extra space at an attractive price.
-
2026-04-09$154,500 Active 703-char remark
Show marketing remark (703 chars)
Spacious four-bedroom, two-bath home located just west of Lubbock, offering the perfect blend of country charm and convenient access to town. The garage has been thoughtfully converted into a large primary suite, providing a private retreat, though it could easily serve as a second living area if desired. Each of the additional bedrooms is generously sized and features either original wood flooring or durable vinyl plank. Renovated just a few years ago, the home is in excellent condition and move-in ready. With a current month-to-month lease in place, it presents a fantastic opportunity for immediate rental income or a comfortable residence for anyone needing extra space at an attractive price.
-
2024-10-05historical $1,200
-
2024-09-17$1,200
-
2022-07-25price $1,200
-
2022-01-31soldstatus
-
1996-10-01soldstatus
-
1985-08-01soldstatus
ⓘ Source: listings_history table (triggers on properties + properties_extension) + one-shot
backfill from property_details.listing_events for pre-trigger history.
Tax reassessment forecast TX · Resets to sale price
- Current annual tax
- $2,140 · $178/mo
- Projected year-2 tax
- $2,743 · $229/mo
- Expected delta
- +$604/yr (+$50/mo · 28.2%)
ⓘ Screening estimate from a state-policy table — verify with the county assessor before closing.
Climate risk First Street
- Flood 1/10 Low FEMA zone X (unshaded) · 0% chance over 30 yrs
- Wildfire 5/10 Major
- Heat 5/10 Major 7 d/yr ≥99°F today · 22 d/yr by 30 yrs out
- Wind 2/10 Low 0% chance of damaging wind over 30 yrs
- Air quality 2/10 Low 1 unhealthy d/yr today · 1 by 30 yrs out
Nearby sold comps map
Loading sold comps map…
Walkable amenities ~0.75 mi
Loading nearby amenities…
Taxation est. · year 1
- Rental income
- $21,474
- − Mortgage interest
- −$8,397
- − Property taxes
- −$2,140
- − Insurance
- −$750
- − Repairs & maintenance
- −$1,718
- − Management
- −$1,718
- − Depreciation
- −$4,361
- Taxable income
- $2,391
- Est. tax owed @ 24.0%
- −$574
- After-tax cash flow
- $4,068/yr
For passive investors: Depreciation is non-cash, so a rental often shows a tax loss while cash-flowing — sheltering income. Rental losses are passive: they offset passive income freely, and up to $25,000/yr can offset ordinary (W-2) income if you actively participate and your MAGI is under $100k (phasing out to $0 by $150k); unused losses carry forward. On sale, claimed depreciation is recaptured at up to 25%, and gains may owe capital-gains tax (a 1031 exchange can defer both). Figures are a year-1 estimate at your 24.0% rate — not tax advice; consult a CPA.
Schools (NCES district)
- District
- Frenship ISD
- NCES district ID
- 4819830
- Math proficiency
- 47% ▼ -8.00%
- Reading proficiency
- 54% ▬ 0.00%
- Median HH income
- $54,376
- Composite
- 43.59/100
- National rank
- #2976
- State rank
- #162 of 826 in TX
Livability — Lubbock
- Score
- 80/100
- State rank
- #37
- US rank
- #1749
Category grades
Schools grade is shown separately in the Schools card above.
Census & demographics
- Census place
- Lubbock, TX
- County
- Lubbock County · 293,542 people
- City population
- 283,030
- Metro
- Lubbock, TX
- Population (ZIP)
- 36,442
- Household income
- $63,896
- Rent vs Own
- Severe rent burden
- 2214.0
Population outlook (Lubbock County) Hauer SSP2
- Today (2025)
- 345,960 people
- By 2030
- 371,449 · +7.4%
- By 2040
- 424,539 · +22.7%
- By 2050
- 481,150 · +39.1%
- By 2075
- 633,467 · +83.1%
- By 2100
- 746,853 · +115.9%
Race, ethnicity, and origin ACS 2023
- Neighborhood character
- Diverse neighborhood (Simpson 0.62)
- Race & ethnicity
- White 49% Hispanic / Latino 35% Two or more races 14% Black 9% Asian 3%
- Hispanic origin (detail)
- Mexican 28%
- Common ancestry
- Slovak 3% Italian 1% Serbian 1%
- Foreign-born
- 7% · Canada, China, South Korea
- Languages at home
- 81% English-only · Spanish 13% Chinese 1% Tagalog/Filipino 1%
Political lean MEDSL · Lubbock
- 2024 margin
- Solid R (+39.5) · D 29.7% · R 69.2% · Other 1.0%
- 2008→2024 swing
- -2.8pp toward R · 2008: -36.7pp · 2024: -39.5pp
- All cycles
- 2024: R+39.5 2020: R+32.2 2016: R+38.4 2012: R+40.9 2008: R+36.7
Not yet ingested
- Civics
- —
Market trends
- HPI YoY
- ▼ -56.94%
- Current HPI
- 227.7841
- Rent YoY
- ▲ 2.21%
- Metro
- Lubbock, TX
- State GDP YoY
- ▲ 3.95%
- F500 in state
- 110
Industry mix (Fortune 500 HQ in TX)
| Industry | F500 HQs | Revenue |
|---|---|---|
| Energy | 16 | $1,198B |
|
||
| Technology | 5 | $198B |
|
||
| Engineering / Construction | 4 | $72B |
|
||
| Energy Services | 3 | $60B |
|
||
| Utilities | 3 | $41B |
|
||
| Healthcare | 2 | $330B |
|
||
Price history
+12391.7% since first listed8 events — show timeline
- 2026-05-13 Price Changed $149,900 LARMLS
- 2026-04-09 Listed $154,500 LARMLS
- 2024-10-05 Rental Removed $1,200 LARMLS
- 2024-09-17 Listed for Rent $1,200 LARMLS
- 2022-07-25 Price Changed $1,200 RENT.
- 2022-01-31 Sold (Public Records) — Public Records
- 1996-10-01 Sold (Public Records) — Public Records
- 1985-08-01 Sold (Public Records) — Public Records
Property tax history
+7.4%/yrLatest (2025): $2,140 · +19.7% YoY. Source: county tax records.
Cash-flow waterfall
monthlySold comps — $/sqft
last 12 mo · ≤1 miLoading sold comps…