365 Ouachita 312 · Chidester, AR
Flood risk No data
- FEMA flood zone
- —
- Chance of flooding over 30 yrs
- —
- Est. flood insurance / yr
- —
Fire risk No data
- Est. fire insurance / yr
- —
Heat risk No data
- Hot days now (above threshold)
- —
- Hot days in 30 yrs
- —
Wind risk No data
- Chance of severe wind over 30 yrs
- —
Air-quality risk No data
- Unhealthy air days now
- —
- Unhealthy air days in 30 yrs
- —
Risk factors via First Street. Map © Google.
Why this score? — see what drove the C+ grade
The composite is a weighted blend of 9 inputs, each scored 0–100. Each bar is that input's sub-score; the figure is the points it added to the 100-point composite (weight × sub-score).
- Cash flow +26.8/30.0
- DSCR +9.2/10.0
- ARV discount +7.5/15.0
- 1% rule +7.2/10.0
- Appreciation +5.0/10.0
- Livability +2.8/5.0
- Rent growth +2.5/5.0
- Condition / age +1.0/5.0
- Schools +0.9/10.0
$72,500
🖨 Deal sheet 📄 Offer letter ✓ Due diligence
Listing remarks MLS
1986 Mobile home on 1 acre on water. private channel to the lake. property sold as-is.
Key facts
- 1.15 acre lot
- Built 1986
- Listed 79 days
Neighborhood map
What this means for you Summary
Snapshot
- This is a 3-bed/2.0-bath single-family listed at $72k. Condition is rated poor.
Deal economics
- At list price, monthly cash flow is $198 ($2k/yr) — positive.
- The deal already cash-flows at list — no discount required.
- Meets the 1% rule at list price ($885 rent vs $72k).
- Recommended offer: $68k (6.0% below list) — sets the bar for market timing.
Location & tenants
- Location reads 56/100 on livability (#376 in AR) — a working-class tenant base; expect higher turnover. Strengths: cost of living A+, housing A+, health & safety A+; Watch: schools F, crime F, amenities F.
- Camden Fairview School District (town): math 9% / reading 15% proficiency, ranked #229 of 238 in AR (top 96%) — low school quality limits family demand, transient renter base, plan for 1-2y turnover; 68% free/reduced lunch — lower-income household profile, screen leases tightly.
- Market conditions: 13 active listings in the ZIP; 18 units permitted in Ouachita County in 2024 (0 in 5+ unit buildings).
Forward outlook
- In year one you build about $3k of equity ($501 loan paydown + $2k appreciation (3.0% local appreciation)).
- Ouachita County population projected at -33% by 2050 — secular population decline; favor cash flow + early exit over multi-decade hold.
- At projected returns (3.0% appreciation + 3.0% rent growth), your $20k cash investment doubles in ~4 years — after that, you're playing with house money.
Negotiation context
- It's been on market 80 days — a 6% lower offer ($68k) is reasonable based on typical stale-listing flexibility.
- 2 sale attempts since 6y ago with the ask held roughly flat each time — persistent listings suggest the price (not the market) is what's stuck; bring a comps-based counter.
Questions for the listing agent
- It's been on market 80 days. Have you received any prior offers? Is the seller open to a 6% concession, seller financing, or rate buy-down credit?
- Have any recent inspections been done? Can we get a copy of the seller's disclosures and any deferred-maintenance estimates?
- Why hasn't it sold? Are there any deal-killer items the seller is aware of (foundation, flood, title, zoning, code violations)?
- Is there a deadline driving the sale (1031 exchange, divorce, estate, relocation)? That informs how much negotiation room exists.
- Schools are F-rated, which usually means shorter tenancies and higher turnover. Who's the typical renter profile here, and what's been the actual vacancy rate?
- Crime grade is F in this area — have there been break-ins, vandalism, or insurance claims at this property in the last 3 years? What carrier currently insures it and at what premium?
- What's the average days-on-market for RENTAL listings here right now (not sales)? A rising rental-DOM trend means longer vacancies and softer asking-rent achievability than the comps imply.
- What's the recent tenant-quality profile in this submarket — average credit score on applications, eviction rate, late-payment / NSF rate, and stable-employment percentage? A property-management company in the area should have these aggregated.
- How much new for-sale + rental construction is in the pipeline within 1–3 miles? Heavy new supply typically softens prices + rents 12–24 months out; constrained supply supports both.
Investment metrics
- 1% rule
- 1.22% ✓
- Cap rate
- 9.57%
- Cash-on-cash
- 11.72%
- DSCR
- 1.52
- GRM
- 6.8
CMA / ARV
- ARV (median comp)
- $42,131
- List price
- $72,500
- Delta
- 72.08%
- Verdict
- OVERPRICED
- Comps
- 2 within 2.0 mi
Show comp detail 1 sale within ~0.75 mi
| Address | Dist | Beds/Ba | Sqft | Sold | Price | $/sf | Match |
|---|---|---|---|---|---|---|---|
| 297 Ouachita 312 | 0.30mi | 2/1.0 (-1) | 784 (-12%) | 6mo | $107,000 | $136 | 51 |
Match score weights: distance 35% · size 25% · config 20% · recency 20%. Top-matched comps best support the ARV.
Projected returns pro-forma
3.0% appreciation · 3.0% rent growth · sell at horizon
- IRR
- 18.5%
- Equity multiple
- 2.05×
- Total profit
- $21,369
- Equity at exit
- $32,599
- IRR
- 19.8%
- Equity multiple
- 3.88×
- Total profit
- $58,413
- Equity at exit
- $50,239
Cash invested: $20,300 (down + closing). Projections, not guarantees.
Landlord ↔ Tenant lean methodology
- Overall (STATE)
- 92 Strongly Landlord-Friendly
- State Arkansas
- 92 Strongly Landlord-Friendly · R+14
- County
- — inherits STATE
- City
- — inherits STATE
ZIP-level market 71726
- Active inventory
- 13
- Price-to-rent
- 6.8×
Monthly cashflow live
- Estimated rent
- $885 medium interval (Pro) →
- Mortgage (P&I)
- −$380
- Tax est. 1.5%
- −$91 /mo · $1,088/yr
- Insurance
- −$30
- HOA
- −$0
- Vacancy / Maint / Mgmt
- −$186
- Net cashflow
- $198
Break-even live
UW: 25.0% down · 7.5% · 30yr · 1.5% tax · 5.0% vac · 8.0% maint · 8.0% mgmt
Financing live
Cash to close
- Down payment
- $18,125
- Closing costs
- $2,175
- Reserves months
- —
- Total cash needed
- —
Loan-product check · same deal, 3 products live
Conventional
25% down · 7.5% · 30yr
- Down + closing
- —
- Monthly P&I
- —
- Monthly cashflow
- —
- DSCR
- —
- Eligible?
- —
Personal DTI + credit; lowest rate.
DSCR
20% down · 8.5% · 30yr
- Down + closing
- —
- Monthly P&I
- —
- Monthly cashflow
- —
- DSCR
- —
- Eligible?
- —
No personal income docs; deal must DSCR.
Hard money
10% down · 12.0% · 12mo
- Down + closing
- —
- Monthly P&I
- —
- Monthly cashflow
- —
- DSCR
- —
- Eligible?
- —
Short-term bridge; refi at stabilization.
Listing history 19 events
-
2026-06-19days on market $72,500 Active 80 DOM
-
2026-06-18days on market $72,500 Active 79 DOM
-
2026-06-17days on market $72,500 Active 78 DOM
-
2026-06-16days on market $72,500 Active 77 DOM
-
2026-06-15days on market $72,500 Active 76 DOM
-
2026-06-14days on market $72,500 Active 74 DOM
-
2026-06-12days on market $72,500 Active 73 DOM
-
2026-06-09days on market $72,500 Active 70 DOM
-
2026-06-08days on market $72,500 Active 69 DOM
-
2026-06-07days on market $72,500 Active 68 DOM
-
2026-06-05days on market $72,500 Active 66 DOM
-
2026-06-04days on market $72,500 Active 64 DOM
-
2026-06-02days on market $72,500 Active 63 DOM
-
2026-06-01days on market $72,500 Active 62 DOM
-
2026-05-31days on market $72,500 Active 61 DOM
-
2026-05-31days on market $72,500 Active 60 DOM
-
2026-03-31$72,500 New Listing 86-char remark
Show marketing remark (86 chars)
1986 Mobile home on 1 acre on water. private channel to the lake. property sold as-is.
-
2021-10-11historical
-
2020-10-04$55,000
ⓘ Source: listings_history table (triggers on properties + properties_extension) + one-shot
backfill from property_details.listing_events for pre-trigger history.
Nearby sold comps map
Loading sold comps map…
Walkable amenities ~0.75 mi
Loading nearby amenities…
Taxation est. · year 1
- Rental income
- $10,621
- − Mortgage interest
- −$4,061
- − Property taxes
- −$1,088
- − Insurance
- −$362
- − Repairs & maintenance
- −$850
- − Management
- −$850
- − Depreciation
- −$2,109
- Taxable income
- $1,301
- Est. tax owed @ 24.0%
- −$312
- After-tax cash flow
- $2,066/yr
For passive investors: Depreciation is non-cash, so a rental often shows a tax loss while cash-flowing — sheltering income. Rental losses are passive: they offset passive income freely, and up to $25,000/yr can offset ordinary (W-2) income if you actively participate and your MAGI is under $100k (phasing out to $0 by $150k); unused losses carry forward. On sale, claimed depreciation is recaptured at up to 25%, and gains may owe capital-gains tax (a 1031 exchange can defer both). Figures are a year-1 estimate at your 24.0% rate — not tax advice; consult a CPA.
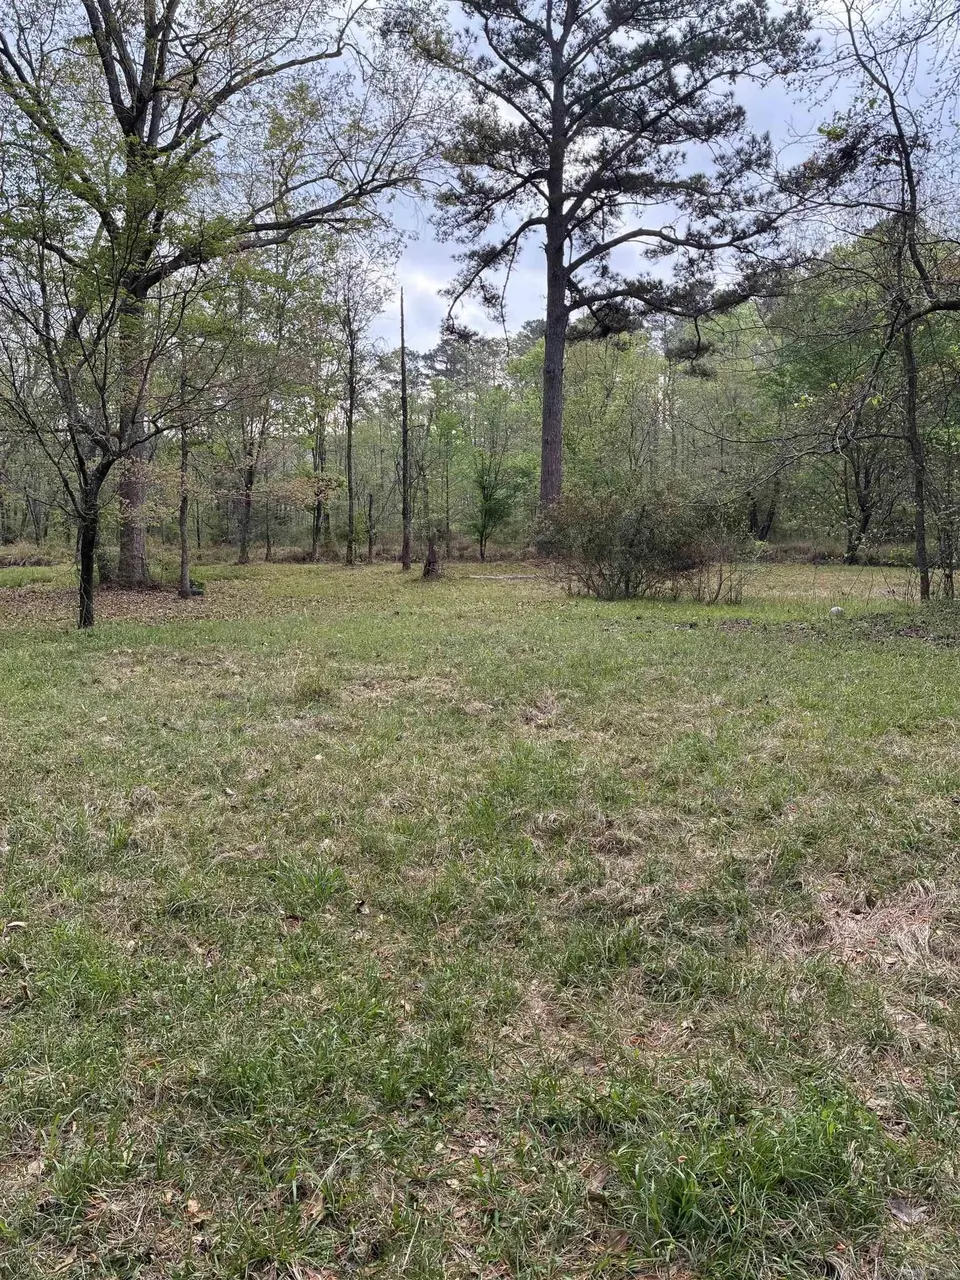
Condition & rehab AI · 1 photo
The property is in poor condition with significant overgrowth and unknown structural and interior conditions. Landscaping is the highest priority to improve both resale and rental value.
Repairs flagged
- Major landscaping — The property is overgrown with grass and weeds, indicating a major landscaping issue.
- Unknown foundation — No foundation or structure is visible in the photos, so its condition is unknown.
- Unknown roof — No roof is visible in the photos, so its condition is unknown.
- Unknown interior walls/paint — No interior walls or paint are visible in the photos, so their condition is unknown.
- Unknown kitchen — No kitchen is visible in the photos, so its condition is unknown.
- Unknown bathrooms — No bathrooms are visible in the photos, so their condition is unknown.
- Unknown systems — No systems are visible in the photos, so their condition is unknown.
- Unknown windows — No windows are visible in the photos, so their condition is unknown.
- Unknown HVAC/mechanicals — No HVAC or mechanicals are visible in the photos, so their condition is unknown.
Value-add opportunities
- Both landscaping — A well-maintained landscape can enhance both the resale and rental value of a property.
Renovation cost estimate screening
| Repair item | Severity | Est. cost |
|---|---|---|
| landscaping · The property is overgrown with grass and weeds, indicating a major landscaping issue. | Major | $15,000–50,000 |
| foundation · No foundation or structure is visible in the photos, so its condition is unknown. | Unknown | $500–3,000 |
| roof · No roof is visible in the photos, so its condition is unknown. | Unknown | $500–3,000 |
| interior walls/paint · No interior walls or paint are visible in the photos, so their condition is unknown. | Unknown | $500–3,000 |
| kitchen · No kitchen is visible in the photos, so its condition is unknown. | Unknown | $500–3,000 |
| bathrooms · No bathrooms are visible in the photos, so their condition is unknown. | Unknown | $500–3,000 |
| systems · No systems are visible in the photos, so their condition is unknown. | Unknown | $500–3,000 |
| windows · No windows are visible in the photos, so their condition is unknown. | Unknown | $500–3,000 |
| HVAC/mechanicals · No HVAC or mechanicals are visible in the photos, so their condition is unknown. | Unknown | $500–3,000 |
| Total estimated repair cost · 9 items | $19,000–74,000 |
Value-add ROI direction
- Both landscaping — A well-maintained landscape can enhance both the resale and rental value of a property. ↑
ⓘ Cost ranges are severity-bucket heuristics (US national rule-of-thumb). Get contractor quotes + a written scope before underwriting a rehab budget.
Schools (NCES district)
- District
- Camden Fairview School District
- NCES district ID
- 0506060
- Math proficiency
- 9% ▼ -16.00%
- Reading proficiency
- 15% ▼ -12.00%
- Median HH income
- $30,854
- Composite
- 9.43/100
- National rank
- #9853
- State rank
- #229 of 238 in AR
Livability — Chidester
- Score
- 56/100
- State rank
- #376
- US rank
- #22428
Category grades
Schools grade is shown separately in the Schools card above.
Census & demographics
- Population (ZIP)
- 1,011
Population outlook (Ouachita County) Hauer SSP2
- Today (2025)
- 21,485 people
- By 2030
- 19,947 · -7.2%
- By 2040
- 16,990 · -20.9%
- By 2050
- 14,431 · -32.8%
- By 2075
- 10,003 · -53.4%
- By 2100
- 7,418 · -65.5%
Race, ethnicity, and origin ACS 2023
- Neighborhood character
- Diverse neighborhood (Simpson 0.57)
- Race & ethnicity
- Black 52% White 39% Two or more races 6% Asian 3%
- Common ancestry
- Italian 3% Lithuanian 2% Slovak 1%
- Foreign-born
- 3%
- Languages at home
- 96% English-only · Tagalog/Filipino 3% Spanish 1%
Political lean MEDSL · Ouachita
- 2024 margin
- R (+19.1) · D 39.5% · R 58.6% · Other 1.8%
- 2008→2024 swing
- -8.2pp toward R · 2008: -10.9pp · 2024: -19.1pp
- All cycles
- 2024: R+19.1 2020: R+13.5 2016: R+10.4 2012: R+8.6 2008: R+10.9
Not yet ingested
- Civics
- —
Market trends
- HPI YoY
- —
- Current HPI
- —
- Rent YoY
- —
- Metro
- —
- State GDP YoY
- ▲ 3.80%
- F500 in state
- 10
Industry mix (Fortune 500 HQ in AR)
| Industry | F500 HQs | Revenue |
|---|---|---|
| Retail | 1 | $681B |
|
||
| Food / Agriculture | 1 | $53B |
|
||
| Retail / Energy | 1 | $22B |
|
||
| Transportation / Logistics | 1 | $12B |
|
||
| Energy | 1 | $4B |
|
||
Price history
+31.8% since first listed3 events — show timeline
- 2026-03-31 Listed $72,500 CARMLS
- 2021-10-11 Listing Removed — CARMLS
- 2020-10-04 Listed $55,000 CARMLS
Cash-flow waterfall
monthlySold comps — $/sqft
last 12 mo · ≤1 miLoading sold comps…