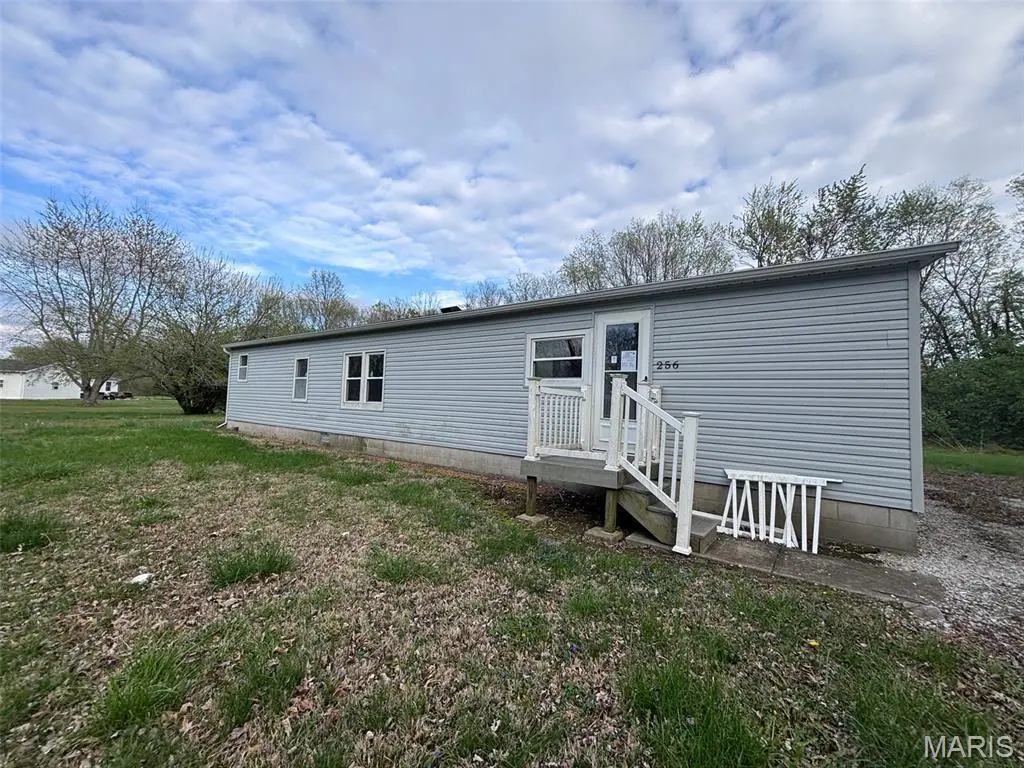
256 N 2nd St · Livingston, IL
Flood risk 1/10 · Minimal
- FEMA flood zone
- X
- Chance of flooding over 30 yrs
- 0.0%
- Est. flood insurance / yr
- $507 – $1,088
Fire risk 1/10 · Minimal
- Est. fire insurance / yr
- $804 – $1,492
Heat risk 4/10 · Minor
- Hot days now (above 106°F)
- 7 days/yr
- Hot days in 30 yrs
- 20 days/yr
Wind risk 2/10 · Minimal
- Chance of severe wind over 30 yrs
- 2.0%
Air-quality risk 2/10 · Minimal
- Unhealthy air days now
- 1 days/yr
- Unhealthy air days in 30 yrs
- 1 days/yr
Risk factors via First Street. Map © Google.
Why this score? — see what drove the B+ grade
The composite is a weighted blend of 9 inputs, each scored 0–100. Each bar is that input's sub-score; the figure is the points it added to the 100-point composite (weight × sub-score).
- Cash flow +30.0/30.0
- 1% rule +10.0/10.0
- DSCR +10.0/10.0
- ARV discount +8.9/15.0
- Appreciation +8.4/10.0
- Livability +3.2/5.0
- Rent growth +2.5/5.0
- Condition / age +2.5/5.0
- Schools +2.2/10.0
$60,000
🖨 Deal sheet (PDF) 📄 Offer letter ✓ Due diligence
Listing remarks MLS
Come take a look at this 3 bedroom home. It features a huge living room, separate dining, 2 full bathrooms and a huge yard for all of your entertaining needs. Located within minutes of I55 makes it very convenient. With a little bit of TLC this will make someone a great home. For more information please visit www.hudhomestore.gov HUD case number 132-186688 INSURED WITH ESCROW. Owned by the US Department of HUD. Seller makes no representations or warranties as to the condition of property. Seller may contribute up to 3% of buyers closing costs upon buyers request. Sold AS-IS. Equal Housing Opportunity.
Key facts
- 0.34 acre lot
- Built 1972
- Listed 59 days
Neighborhood map
What this means for you Summary
Snapshot
- This is a 2-bed/2.0-bath single-family listed at $60k.
Deal economics
- At list price, monthly cash flow is $422 ($5k/yr) — positive.
- The deal already cash-flows at list — no discount required.
- Meets the 1% rule at list price ($1k rent vs $60k).
- Recommended offer: $58k (3.0% below list) — sets the bar for market timing.
Location & tenants
- Location reads 63/100 on livability (#779 in IL) — a middle-class / working-renter tenant base. Strengths: crime A+, cost of living A+, housing A+; Watch: schools F, amenities F, commute F.
- Staunton CUSD 6 (town): math 22% / reading 28% proficiency, ranked #323 of 620 in IL (top 52%) — low school quality limits family demand, transient renter base, plan for 1-2y turnover.
- Market conditions: 6 active listings in the ZIP; 336 units permitted in Madison County in 2024 (0 in 5+ unit buildings).
Forward outlook
- In year one you build about $4k of equity ($415 loan paydown + $4k appreciation (6.7% local appreciation)).
- Madison County population projected at -18% by 2050 — secular population decline; favor cash flow + early exit over multi-decade hold.
- At projected returns (6.7% appreciation + 3.0% rent growth), your $17k cash investment doubles in ~2 years — after that, you're playing with house money.
- By year 8, paydown + projected appreciation supports a ~$35k cash-out refi (75% LTV) — recoverable capital for the next deal without selling this one.
Negotiation context
- It's been on market 59 days — a 3% lower offer ($58k) is reasonable based on typical stale-listing flexibility.
Questions for the listing agent
- It's been on market 59 days. Have you received any prior offers? Is the seller open to a 3% concession, seller financing, or rate buy-down credit?
- Built in 1972 — when were the roof, HVAC, electrical panel, plumbing, and water heater last replaced?
- Is there a deadline driving the sale (1031 exchange, divorce, estate, relocation)? That informs how much negotiation room exists.
- Schools are F-rated, which usually means shorter tenancies and higher turnover. Who's the typical renter profile here, and what's been the actual vacancy rate?
- What's the average days-on-market for RENTAL listings here right now (not sales)? A rising rental-DOM trend means longer vacancies and softer asking-rent achievability than the comps imply.
- What's the recent tenant-quality profile in this submarket — average credit score on applications, eviction rate, late-payment / NSF rate, and stable-employment percentage? A property-management company in the area should have these aggregated.
- How much new for-sale + rental construction is in the pipeline within 1–3 miles? Heavy new supply typically softens prices + rents 12–24 months out; constrained supply supports both.
Investment metrics
- 1% rule
- 1.77% ✓
- Cap rate
- 14.74%
- Cash-on-cash
- 30.16%
- DSCR
- 2.34
- GRM
- 4.7
CMA / ARV
- ARV (median comp)
- $61,917
- List price
- $60,000
- Delta
- -3.10%
- Verdict
- FAIR
- Comps
- 1 within 2.0 mi
Show comp detail 6 sales within ~0.75 mi
| Address | Dist | Beds/Ba | Sqft | Sold | Price | $/sf | Match |
|---|---|---|---|---|---|---|---|
| 512 Nicholls St | 0.27mi | 2/1.0 | 1,144 (-11%) | 3mo | $119,900 | $105 | 62 |
| 246 N 3rd St | 0.06mi | 3/1.0 (+1) | 1,223 (-5%) | 21mo | $17,000 | $14 | 62 |
| 336 Mullen St | 0.15mi | 3/1.5 (+1) | 1,188 (-8%) | 17mo | $132,000 | $111 | 59 |
| 670 Livingston Ave | 0.46mi | 2/1.0 | 1,319 (+2%) | 16mo | $169,900 | $129 | 57 |
| 528 Sarah St | 0.32mi | 3/1.0 (+1) | 1,355 (+5%) | 23mo | $24,900 | $18 | 48 |
| 695 Elm St | 0.51mi | 3/1.0 (+1) | 1,181 (-8%) | 14mo | $115,000 | $97 | 42 |
Match score weights: distance 35% · size 25% · config 20% · recency 20%. Top-matched comps best support the ARV.
Projected returns pro-forma
6.74% appreciation · 3.0% rent growth · sell at horizon
- IRR
- 42.2%
- Equity multiple
- 3.79×
- Total profit
- $46,912
- Equity at exit
- $40,571
- IRR
- 38.7%
- Equity multiple
- 7.93×
- Total profit
- $116,380
- Equity at exit
- $76,171
Cash invested: $16,800 (down + closing). Projections, not guarantees.
Landlord ↔ Tenant lean methodology
- Overall (STATE)
- 43 Moderately Tenant-Leaning
- State Illinois
- 43 Moderately Tenant-Leaning · D+7
- County
- — inherits STATE
- City
- — inherits STATE
ZIP-level market 62058
- Home prices YoY
- 3.9%
- Active inventory
- 6
- Price-to-rent
- 4.7×
Monthly cashflow live
- Estimated rent
- $1,059 medium interval (Pro) →
- Mortgage (P&I)
- −$315
- Tax est. 1.5%
- −$75 /mo · $900/yr
- Insurance
- −$25
- HOA
- −$0
- Vacancy / Maint / Mgmt
- −$222
- Net cashflow
- $422
Break-even live
Sensitivity live
| Price | -10% $464 | -5% $443 | +0% $422 | +5% $401 | +10% $381 |
|---|---|---|---|---|---|
| Rent | -10% $339 | -5% $380 | +0% $422 | +5% $464 | +10% $506 |
| Rate | -1.0pp $452 | -0.5pp $437 | base $422 | +0.5pp $407 | +1.0pp $391 |
UW: 25.0% down · 7.5% · 30yr · 1.5% tax · 5.0% vac · 8.0% maint · 8.0% mgmt
Financing live
Cash to close
- Down payment
- $15,000
- Closing costs
- $1,800
- Reserves months
- —
- Total cash needed
- —
Loan-product check · same deal, 3 products live
Conventional
25% down · 7.5% · 30yr
- Down + closing
- —
- Monthly P&I
- —
- Monthly cashflow
- —
- DSCR
- —
- Eligible?
- —
Personal DTI + credit; lowest rate.
DSCR
20% down · 8.5% · 30yr
- Down + closing
- —
- Monthly P&I
- —
- Monthly cashflow
- —
- DSCR
- —
- Eligible?
- —
No personal income docs; deal must DSCR.
Hard money
10% down · 12.0% · 12mo
- Down + closing
- —
- Monthly P&I
- —
- Monthly cashflow
- —
- DSCR
- —
- Eligible?
- —
Short-term bridge; refi at stabilization.
Listing history 14 events
-
2026-06-16status $60,000 Pending 59 DOM
-
2026-06-15days on market $60,000 Active 59 DOM
-
2026-06-13days on market $60,000 Active 57 DOM
-
2026-06-12days on market $60,000 Active 56 DOM
-
2026-06-09days on market $60,000 Active 53 DOM
-
2026-06-08days on market $60,000 Active 52 DOM
-
2026-06-07days on market $60,000 Active 51 DOM
-
2026-06-07days on market $60,000 Active 50 DOM
-
2026-06-04days on market $60,000 Active 47 DOM
-
2026-06-02days on market $60,000 Active 46 DOM
-
2026-06-01days on market $60,000 Active 45 DOM
-
2026-05-31days on market $60,000 Active 44 DOM
-
2026-05-31days on market $60,000 Active 43 DOM
-
2026-04-17$75,000 Active 609-char remark
Show marketing remark (609 chars)
Come take a look at this 3 bedroom home. It features a huge living room, separate dining, 2 full bathrooms and a huge yard for all of your entertaining needs. Located within minutes of I55 makes it very convenient. With a little bit of TLC this will make someone a great home. For more information please visit www.hudhomestore.gov HUD case number 132-186688 INSURED WITH ESCROW. Owned by the US Department of HUD. Seller makes no representations or warranties as to the condition of property. Seller may contribute up to 3% of buyers closing costs upon buyers request. Sold AS-IS. Equal Housing Opportunity.
ⓘ Source: listings_history table (triggers on properties + properties_extension) + one-shot
backfill from property_details.listing_events for pre-trigger history.
Climate risk First Street
- Flood 1/10 Low FEMA zone X · 0% chance over 30 yrs
- Wildfire 1/10 Low
- Heat 4/10 Moderate 7 d/yr ≥106°F today · 20 d/yr by 30 yrs out
- Wind 2/10 Low 2% chance of damaging wind over 30 yrs
- Air quality 2/10 Low 1 unhealthy d/yr today · 1 by 30 yrs out
Nearby sold comps map
Loading sold comps map…
Walkable amenities ~0.75 mi
Loading nearby amenities…
Taxation est. · year 1
- Rental income
- $12,712
- − Mortgage interest
- −$3,361
- − Property taxes
- −$900
- − Insurance
- −$300
- − Repairs & maintenance
- −$1,017
- − Management
- −$1,017
- − Depreciation
- −$1,745
- Taxable income
- $4,372
- Est. tax owed @ 24.0%
- −$1,049
- After-tax cash flow
- $4,017/yr
For passive investors: Depreciation is non-cash, so a rental often shows a tax loss while cash-flowing — sheltering income. Rental losses are passive: they offset passive income freely, and up to $25,000/yr can offset ordinary (W-2) income if you actively participate and your MAGI is under $100k (phasing out to $0 by $150k); unused losses carry forward. On sale, claimed depreciation is recaptured at up to 25%, and gains may owe capital-gains tax (a 1031 exchange can defer both). Figures are a year-1 estimate at your 24.0% rate — not tax advice; consult a CPA.
Schools (NCES district)
- District
- Staunton CUSD 6
- NCES district ID
- 1737590
- Math proficiency
- 22% ▬ 0.00%
- Reading proficiency
- 28% ▼ -2.00%
- Median HH income
- $49,408
- Composite
- 21.98/100
- National rank
- #8211
- State rank
- #323 of 620 in IL
Livability — Livingston
- Score
- 63/100
- State rank
- #779
- US rank
- #15547
Category grades
Schools grade is shown separately in the Schools card above.
Census & demographics
- Census place
- Livingston, IL
- City population
- 791
- Population (ZIP)
- 791
Population outlook (Madison County) Hauer SSP2
- Today (2025)
- 258,371 people
- By 2030
- 251,523 · -2.7%
- By 2040
- 233,640 · -9.6%
- By 2050
- 213,042 · -17.5%
- By 2075
- 165,255 · -36.0%
- By 2100
- 123,953 · -52.0%
Race, ethnicity, and origin ACS 2023
- Neighborhood character
- Predominantly White (84%)
- Race & ethnicity
- White 84% Two or more races 14% Hispanic / Latino 1%
- Common ancestry
- Lithuanian 6% Romanian 3% American 2%
- Foreign-born
- 0% · South Korea
- Languages at home
- 99% English-only · Spanish 1%
Political lean MEDSL · Madison
- 2024 margin
- R (+13.3) · D 42.5% · R 55.8% · Other 1.8%
- 2008→2024 swing
- -22.5pp toward R · 2008: 9.2pp · 2024: -13.3pp
- All cycles
- 2024: R+13.3 2020: R+13.2 2016: R+15.6 2012: R+1.4 2008: D+9.2
Not yet ingested
- Civics
- —
Market trends
- HPI YoY
- ▲ 6.74%
- Current HPI
- 181.8157
- Rent YoY
- —
- Metro
- —
- State GDP YoY
- ▲ 1.59%
- F500 in state
- 60
Industry mix (Fortune 500 HQ in IL)
| Industry | F500 HQs | Revenue |
|---|---|---|
| Insurance | 4 | $201B |
|
||
| Consumer Goods | 4 | $87B |
|
||
| Industrial Machinery | 3 | $64B |
|
||
| Healthcare | 2 | $55B |
|
||
| Retail / Pharmacy | 1 | $148B |
|
||
| Agriculture / Food | 1 | $86B |
|
||
Price history
1 event — show timeline
- 2026-04-17 Listed $75,000 MARIS as Distributed by MLS Grid
Cash-flow waterfall
monthlySold comps — $/sqft
last 12 mo · ≤1 miLoading sold comps…