301 W 110th St Unit 8J · New York, NY
Flood risk 1/10 · Minimal
- FEMA flood zone
- X (unshaded)
- Chance of flooding over 30 yrs
- 0.0%
- Est. flood insurance / yr
- $507 – $1,088
Fire risk 1/10 · Minimal
- Est. fire insurance / yr
- $691 – $1,283
Heat risk 6/10 · Moderate
- Hot days now (above 99°F)
- 7 days/yr
- Hot days in 30 yrs
- 15 days/yr
Wind risk 6/10 · Moderate
- Chance of severe wind over 30 yrs
- 27.0%
Air-quality risk 4/10 · Minor
- Unhealthy air days now
- 5 days/yr
- Unhealthy air days in 30 yrs
- 6 days/yr
Risk factors via First Street. Map © Google.
Why this score? — see what drove the F grade
The composite is a weighted blend of 9 inputs, each scored 0–100. Each bar is that input's sub-score; the figure is the points it added to the 100-point composite (weight × sub-score).
- Appreciation +7.6/10.0
- ARV discount +7.5/15.0
- Schools +5.0/10.0
- Livability +3.8/5.0
- Rent growth +3.1/5.0
- Condition / age +2.5/5.0
- Cash flow +2.3/30.0
- 1% rule +0.3/10.0
- DSCR +0.0/10.0
$780,000
🖨 Deal sheet 📄 Offer letter ✓ Due diligence
Listing remarks
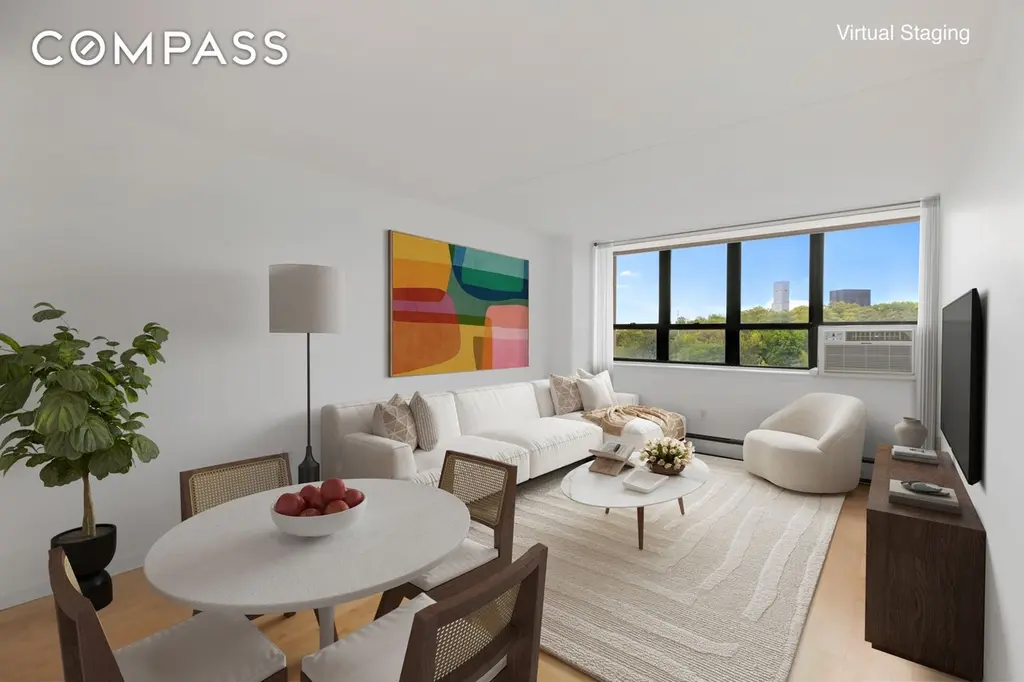
Opportunity beckons with this sun filled eighth-floor two-bedroom condo at the northwest corner of Central Park. South-facing exposures bring natural light into the living room and both bedrooms throughout the day, with open views stretching across the park. The apartment is move-in ready. The kitchen has been fully renovated with new stainless steel appliances, the bathroom has been refreshed, and both bedrooms feature new floors. Fresh paint throughout and an abundance of closet space make this an immediate home for the new owners. Towers on the Park is a full service building which has a 24-hour doorman and concierge, an on-site parking garage, a private garden, bike room, community ro
Key facts
- $680 HOA
- Garage
- Built 1987
Property features AI
Finance
- Other: Building contains 257 total units
- HOA & community: Monthly association fee of $680; Building allows cats and dogs (building notes indicate cats allowed, no dogs in some comments)
Exterior
- Parking: Garage parking available
- Security: On-site security guard
- Home design: High-rise building with 20 stories; Building name: Towers on the Park; Entry level: 8; South-facing exposure; Has a view
- Exterior features: Building garden; Bike storage
Interior
- Bedrooms: Entry level: 8
- Bathrooms: 1 full bathroom
- Interior features: Unfurnished; Common lounge; Elevator access; South-facing exposure; Has a view
- Laundry & utility: Common on-floor laundry; Common area laundry
Neighborhood map
What this means for you Summary
Snapshot
- This is a 2-bed/1.0-bath condo listed at $780k.
Deal economics
- At list price, monthly cash flow is $-3k ($-33k/yr) — negative.
- To cash-flow at today's rent, offer at most $289k (62.9% below list).
- To meet the 1% rule (rent ≥ 1% of price), the offer needs to be $414k (47.0% below list).
- Recommended offer: $289k (62.9% below list) — sets the bar for cash-flow.
- Cap rate 2.0% vs local median 2.6% in New York — below-typical yield; the buyer is paying a premium for something (appreciation thesis, condition, location) that the cap rate doesn't capture.
Location & tenants
- Location reads 75/100 on livability (#268 in NY, #4,188 nationally) — a middle-class / working-renter tenant base. Strengths: amenities A+, commute A+, health & safety A; Watch: crime F, cost of living F.
- Market conditions: Rents rising (+2.5%/yr); 96 active listings in the ZIP; 28 comparable units currently listed for rent nearby; rentals leasing fast (median 5d on market — plan ~1-2 weeks tenant-placement turnaround); solid renter incomes; 4,467 units permitted in New York County in 2024 (4,463 in 5+ unit buildings).
- At $4,137/mo this rent would consume 61% of the median local household income ($81k/yr) (locally 2685% of renters already pay >50% of income on rent) — very limited rent-growth headroom before tenants either downsize or default.
Forward outlook
- In year one you build about $46k of equity ($5k loan paydown + $41k appreciation (5.3% local appreciation)).
- New York County population projected at +21% by 2050 — long-run rental-demand tailwind backs the buy-and-hold thesis.
- By year 2, paydown + projected appreciation supports a ~$74k cash-out refi (75% LTV) — recoverable capital for the next deal without selling this one.
Negotiation context
- It's been on market 25 days — a 2% lower offer ($768k) is reasonable based on typical stale-listing flexibility.
- Current owner paid $615k; 27% above their basis — modest negotiation headroom, anchor on the comps not their cost.
Risks & watch-outs
- Climate carrying-cost: major wind risk, 27% chance of damaging wind over 30y; extreme-heat days projected 7→15/yr by 2055 (HVAC capex compounding) — expect insurance premiums to compound above CPI over the hold.
Questions for the listing agent
- What do current leases actually rent for vs. the listed asking? Can we see a recent rent roll and the last 12 months of T-12 income?
- What does the HOA fee cover, when was the last increase, and are there any pending special assessments or reserve-fund shortfalls?
- Any open or pending special assessments — roof, HVAC, plumbing, elevator, façade? What's the per-unit balance and payoff schedule, and is the seller paying it off at close or rolling it to the buyer?
- Is there a deadline driving the sale (1031 exchange, divorce, estate, relocation)? That informs how much negotiation room exists.
- Schools are B-rated — typically a magnet for longer-tenancy family renters. What's the average tenant stay here, and is there a school-zone premium baked into asking?
- Crime grade is F in this area — have there been break-ins, vandalism, or insurance claims at this property in the last 3 years? What carrier currently insures it and at what premium?
- The area grade is low — what's the realistic commute time and amenity access for the typical tenant pool here? Any planned neighborhood developments (good or bad) we should know about?
- What's the average days-on-market for RENTAL listings here right now (not sales)? A rising rental-DOM trend means longer vacancies and softer asking-rent achievability than the comps imply.
- What's the recent tenant-quality profile in this submarket — average credit score on applications, eviction rate, late-payment / NSF rate, and stable-employment percentage? A property-management company in the area should have these aggregated.
- How much new apartment / multifamily construction is in the pipeline within 1–3 miles? Heavy new supply (>2% of stock underway) typically softens rents 12–24 months out; light construction supports rent growth.
Investment metrics
- 1% rule
- 0.53% ✗
- Cap rate
- 2.02%
- Cash-on-cash
- -15.26%
- DSCR
- 0.32
- GRM
- 15.7
CMA / ARV
No comps found within radius.
Projected returns pro-forma
5.26% appreciation · 2.46% rent growth · sell at horizon
- IRR
- 0.9%
- Equity multiple
- 1.06×
- Total profit
- $12,664
- Equity at exit
- $454,297
- IRR
- 4.3%
- Equity multiple
- 1.84×
- Total profit
- $182,751
- Equity at exit
- $794,403
Cash invested: $218,400 (down + closing). Projections, not guarantees.
Landlord ↔ Tenant lean methodology
- Overall (CITY)
- 0 Strongly Tenant-Friendly
- State New York
- 15 Strongly Tenant-Friendly · D+10
- County
- — inherits STATE
- City New York
- 0 Strongly Tenant-Friendly · D+34
ZIP-level market 10026
- Home prices YoY
- 1.6%
- Rents YoY
- 2.5%
- Active inventory
- 96
- Price-to-rent
- 15.7×
Monthly cashflow live
- Estimated rent
- $4,137 medium interval (Pro) →
- Mortgage (P&I)
- −$4,090
- Tax from tax record
- −$950 /mo · $11,406/yr
- Insurance
- −$325
- HOA
- −$680
- Vacancy / Maint / Mgmt
- −$869
- Net cashflow
- $-2,777
Break-even live
UW: 25.0% down · 7.5% · 30yr · 1.5% tax · 5.0% vac · 8.0% maint · 8.0% mgmt
Financing live
Cash to close
- Down payment
- $195,000
- Closing costs
- $23,400
- Reserves months
- —
- Total cash needed
- —
Loan-product check · same deal, 3 products live
Conventional
25% down · 7.5% · 30yr
- Down + closing
- —
- Monthly P&I
- —
- Monthly cashflow
- —
- DSCR
- —
- Eligible?
- —
Personal DTI + credit; lowest rate.
DSCR
20% down · 8.5% · 30yr
- Down + closing
- —
- Monthly P&I
- —
- Monthly cashflow
- —
- DSCR
- —
- Eligible?
- —
No personal income docs; deal must DSCR.
Hard money
10% down · 12.0% · 12mo
- Down + closing
- —
- Monthly P&I
- —
- Monthly cashflow
- —
- DSCR
- —
- Eligible?
- —
Short-term bridge; refi at stabilization.
Rent comps 28 comps
| Address | Beds | Baths | Sqft | Rent | $/sqft | DOM | Units | Dist |
|---|---|---|---|---|---|---|---|---|
| 1 Morningside Dr New York, NY | 3.0 | 1.0–2.0 | 1655 | $8,145 | $4.92 | 1d | 1 | 0.17mi |
| 30 Morningside Dr #2096 New York, NY | 1.0–2.0 | 1.0–2.0 | 780 | $9,000 | $11.53 | 3d | 2 | 0.25mi |
| 202 W 102nd St Unit 1053014P New York, NY | 2.0 | 2.0 | 538 | $10,000 | $18.59 | 21d | 1 | 0.52mi |
| 308 W 107th St Unit 1239985P New York, NY | 1.0 | 1.0 | 559 | $8,500 | $15.21 | 21d | 1 | 0.53mi |
| 915 W End Ave #1020 New York, NY | 1.0–3.0 | 1.0–2.0 | 851 | $7,375 | $8.67 | 1d | 2 | 0.55mi |
| 814 Amsterdam Ave #1019 New York, NY | 1.0–2.0 | 1.0–2.0 | 800 | $5,270 | $6.59 | 24d | 2 | 0.60mi |
| 808 Columbus Ave New York, NY | 2.0 | 1.0–2.0 | 773 | $9,876 | $12.78 | 1d | 31 | 0.60mi |
| 788 Columbus Ave #1323 New York, NY | 1.0–3.0 | 1.0–1.5 | 900 | $6,320 | $7.02 | 24d | 2 | 0.62mi |
| 70 W 95th St New York, NY | 1.0–4.0 | 1.0–2.0 | 1095 | $13,166 | $12.02 | 16d | 1 | 0.78mi |
| 266 W 96th St #2030 New York, NY | 1.0 | 1.0 | 512 | $5,800 | $11.33 | 6d | 1 | 0.83mi |
| 255 W 94th St #686 New York, NY | 1.0–2.0 | 1.0–2.0 | 750 | $8,690 | $11.59 | 1d | 2 | 0.88mi |
| 122 E 102nd St Unit 1021896P New York, NY | 2.0 | 1.0 | 742 | $5,429 | $7.32 | 15d | 1 | 0.95mi |
| 212 W 91st St New York, NY | 1.0–2.0 | 1.0–2.0 | 825 | $9,650 | $11.70 | 2d | 3 | 1.03mi |
| 212 W 91st St New York, NY | 1.0–2.0 | 1.0–2.0 | 825 | $9,650 | $11.70 | 3d | 4 | 1.03mi |
| 212 W 91st St #416 New York, NY | 1.0–2.0 | 1.0–2.0 | 825 | $9,630 | $11.67 | 6d | 2 | 1.03mi |
| 189 W 89th St New York, NY | 2.0 | 1.0–2.0 | 716 | $8,623 | $12.03 | 1d | 13 | 1.06mi |
| 1501 Lexington Ave #932 New York, NY | 1.0 | 1.0 | 583 | $5,580 | $9.56 | 3d | 2 | 1.11mi |
| 210 W 89th St #165 New York, NY | 1.0 | 1.0 | 675 | $7,520 | $11.14 | 1d | 2 | 1.12mi |
| 175 E 96th St Unit 1251683P New York, NY | 2.0 | 1.0 | 600 | $6,380 | $10.63 | 2d | 2 | 1.17mi |
| 132 W 134th St New York, NY | 2.0 | 1.0 | 750 | $4,500 | $6.00 | 24d | 1 | 1.22mi |
| 215 E 96th St Unit 688 New York, NY | 1.0 | 1.0 | 717 | $7,960 | $11.10 | 2d | 1 | 1.23mi |
| 43 W 85th St Unit 1470323P New York, NY | 1.0 | 1.0 | 699 | $6,466 | $9.25 | 5d | 1 | 1.25mi |
| 215 E 95th St #1293 New York, NY | 1.0–2.0 | 1.0–1.5 | 740 | $6,100 | $8.24 | 1d | 2 | 1.27mi |
| 118 E 91st St Unit 1022052P New York, NY | 3.0 | 1.0 | 592 | $6,180 | $10.44 | 7d | 1 | 1.28mi |
| 160 E 88th St #1332 New York, NY | 1.0 | 1.0 | 560 | $5,670 | $10.12 | 6d | 1 | 1.44mi |
| 45 W 81st St Unit 2011 New York, NY | 1.0 | 1.0 | 450 | $4,710 | $10.47 | 24d | 1 | 1.45mi |
| 200 E 89th St Unit 12G New York, NY | 1.0 | 1.0 | 650 | $5,000 | $7.69 | 17d | 1 | 1.46mi |
| 345 E 94th St #1470 New York, NY | 2.0 | 1.0–2.0 | 710 | $7,570 | $10.65 | 3d | 3 | 1.46mi |
HOA detail condo
- Monthly dues
- $680 · $8,160/yr
- Likely covers
- doorman
- Assessments
- None detected in remarks — confirm with the listing agent.
Listing history 7 events
-
2026-06-01days on market $780,000 Active 25 DOM
-
2026-05-31days on market $780,000 Active 24 DOM
-
2026-05-07$780,000 Active
-
2011-06-24soldstatus $615,000
-
2004-02-04soldstatus $375,000
-
1997-04-23soldstatus $93,000
-
1988-07-13soldstatus $93,500
ⓘ Source: listings_history table (triggers on properties + properties_extension) + one-shot
backfill from property_details.listing_events for pre-trigger history.
Tax reassessment forecast NY · Partial reset (capped growth)
- Current annual tax
- $11,406 · $950/mo
- Projected year-2 tax
- $12,294 · $1,024/mo
- Expected delta
- +$888/yr (+$74/mo · 7.8%)
ⓘ Screening estimate from a state-policy table — verify with the county assessor before closing.
Climate risk First Street
- Flood 1/10 Low FEMA zone X (unshaded) · 0% chance over 30 yrs
- Wildfire 1/10 Low
- Heat 6/10 Major 7 d/yr ≥99°F today · 15 d/yr by 30 yrs out
- Wind 6/10 Major 27% chance of damaging wind over 30 yrs
- Air quality 4/10 Moderate 5 unhealthy d/yr today · 6 by 30 yrs out
Nearby sold comps map
Loading sold comps map…
Walkable amenities ~0.75 mi
Loading nearby amenities…
Taxation est. · year 1
- Rental income
- $49,649
- − Mortgage interest
- −$43,692
- − Property taxes
- −$11,406
- − Insurance
- −$3,900
- − Repairs & maintenance
- −$3,972
- − Management
- −$3,972
- − HOA
- −$8,160
- − Depreciation
- −$22,691
- Taxable loss
- −$48,144
- Est. tax savings @ 24.0%
- +$11,554
- After-tax cash flow
- $-21,773/yr
For passive investors: Depreciation is non-cash, so a rental often shows a tax loss while cash-flowing — sheltering income. Rental losses are passive: they offset passive income freely, and up to $25,000/yr can offset ordinary (W-2) income if you actively participate and your MAGI is under $100k (phasing out to $0 by $150k); unused losses carry forward. On sale, claimed depreciation is recaptured at up to 25%, and gains may owe capital-gains tax (a 1031 exchange can defer both). Figures are a year-1 estimate at your 24.0% rate — not tax advice; consult a CPA.
Schools (NCES district)
No district data.
Livability — New York
- Score
- 75/100
- State rank
- #268
- US rank
- #4188
Category grades
Schools grade is shown separately in the Schools card above.
Census & demographics
- Census place
- New York, NY
- County
- New York County · 1,599,927 people
- City population
- 7,731,280
- Metro
- New York-Newark-Jersey City, NY-NJ-PA
- Population (ZIP)
- 37,123
- Household income
- $81,244
- Rent vs Own
- Severe rent burden
- 2685.0
Population outlook (New York County) Hauer SSP2
- Today (2025)
- 1,825,725 people
- By 2030
- 1,904,611 · +4.3%
- By 2040
- 2,052,719 · +12.4%
- By 2050
- 2,206,601 · +20.9%
- By 2075
- 2,509,427 · +37.4%
- By 2100
- 2,702,933 · +48.0%
Race, ethnicity, and origin ACS 2023
- Neighborhood character
- Diverse neighborhood (Simpson 0.69)
- Race & ethnicity
- Black 45% White 25% Hispanic / Latino 18% Two or more races 11% Asian 6%
- Hispanic origin (detail)
- Mexican 1% Puerto Rican 4% Dominican 8%
- Common ancestry
- Lithuanian 2% Hispanic 2% Scotch-Irish 1%
- Foreign-born
- 27% · Canada, China, Vietnam
- Languages at home
- 67% English-only · Spanish 14% French/Haitian/Cajun 8% Other Indo-European 2%
Political lean MEDSL · New York
- 2024 margin
- Solid D (+64.8) · D 82.4% · R 17.6%
- 2008→2024 swing
- -7.4pp toward R · 2008: 72.2pp · 2024: 64.8pp
- All cycles
- 2024: D+64.8 2020: D+74.5 2016: D+77.2 2012: D+69.6 2008: D+72.2
Not yet ingested
- Civics
- —
Market trends
- HPI YoY
- ▲ 5.26%
- Current HPI
- 330.628
- Rent YoY
- ▲ 2.46%
- Metro
- New York-Newark-Jersey City, NY-NJ-PA
- State GDP YoY
- ▲ 2.60%
- F500 in state
- 92
Industry mix (Fortune 500 HQ in NY)
| Industry | F500 HQs | Revenue |
|---|---|---|
| Financial Services | 10 | $950B |
|
||
| Consumer Goods | 9 | $162B |
|
||
| Insurance | 4 | $225B |
|
||
| Telecommunications | 2 | $144B |
|
||
| Pharmaceuticals | 2 | $112B |
|
||
| Media / Entertainment | 2 | $69B |
|
||
Price history
+734.2% since first listed5 events — show timeline
- 2026-05-07 Listed $780,000 RLS at REBNY
- 2011-06-24 Sold (Public Records) $615,000 Public Records
- 2004-02-04 Sold (Public Records) $375,000 Public Records
- 1997-04-23 Sold (Public Records) $93,000 Public Records
- 1988-07-13 Sold (Public Records) $93,500 Public Records
Property tax history
+2.6%/yrLatest (2025): $11,406 · +1.5% YoY. Source: county tax records.
Cash-flow waterfall
monthlySold comps — $/sqft
last 12 mo · ≤1 miLoading sold comps…