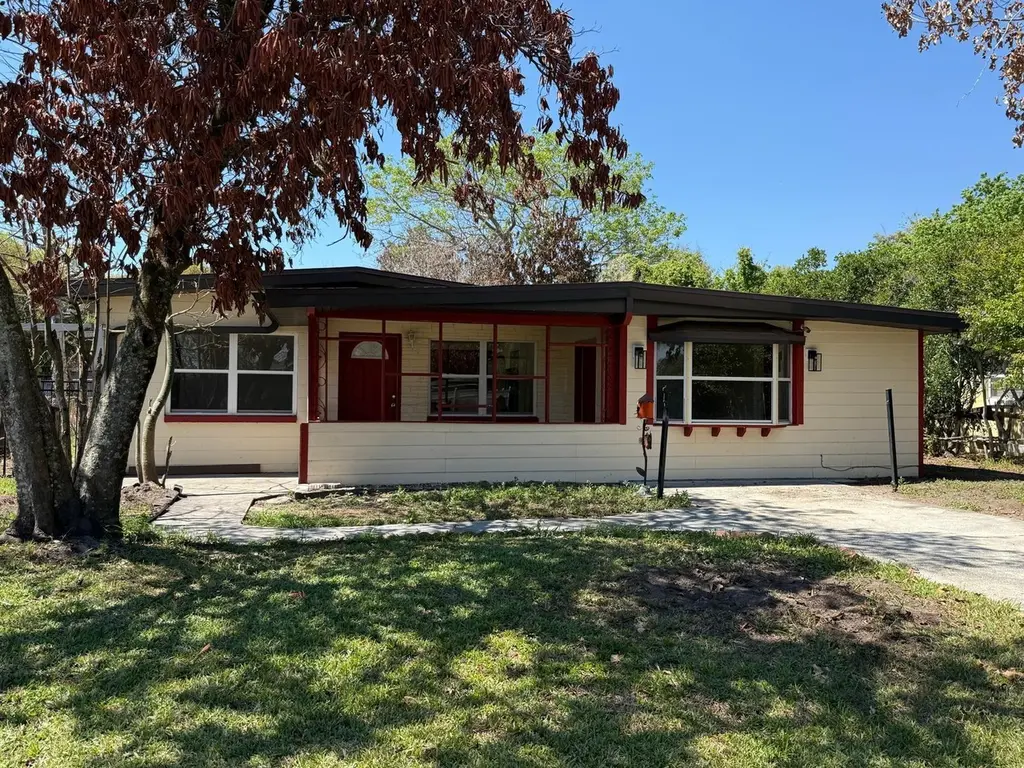
7644 Arlene Ave · Belle Isle, FL
Flood risk 1/10 · Minimal
- FEMA flood zone
- X (unshaded)
- Chance of flooding over 30 yrs
- 0.0%
- Est. flood insurance / yr
- $507 – $1,088
Fire risk 1/10 · Minimal
- Est. fire insurance / yr
- $947 – $1,759
Heat risk 9/10 · Severe
- Hot days now (above 108°F)
- 7 days/yr
- Hot days in 30 yrs
- 24 days/yr
Wind risk 9/10 · Severe
- Chance of severe wind over 30 yrs
- 99.0%
Air-quality risk 2/10 · Minimal
- Unhealthy air days now
- 1 days/yr
- Unhealthy air days in 30 yrs
- 1 days/yr
Risk factors via First Street. Map © Google.
Why this score? — see what drove the D grade
The composite is a weighted blend of 9 inputs, each scored 0–100. Each bar is that input's sub-score; the figure is the points it added to the 100-point composite (weight × sub-score).
- Cash flow +14.8/30.0
- ARV discount +9.3/15.0
- DSCR +4.5/10.0
- Schools +4.1/10.0
- Livability +3.8/5.0
- 1% rule +2.8/10.0
- Condition / age +2.5/5.0
- Rent growth +2.0/5.0
- Appreciation +0.0/10.0
$335,000
🖨 Deal sheet 📄 Offer letter ✓ Due diligence
Listing remarks
Excelent Oportunity. NEW PRICE !This single family home with 4 bedrooms and 2 bathrooms, is just five minutes from the Airport, great location in Orlando, a spacious yard and no HOA fees. It features an independent suite with private bath. In July 2025 the AC, paint and septic system were all updated. A prime investment oportunity in a strategically positioned area. The sellerv is motived.
Key facts
- Spacious yard
- Updated ac
- Private bath
Tags
Property features AI
Finance
- Other: Homestead exemption applied; Unfurnished; No lease restrictions; Universal property ID available
- HOA & community: No secondary association indicated
Exterior
- Parking: Directions: From highway 528 East - take Jetport Exit, left onto Jetport Dr, left onto Daetwyler Dr, right onto Rampart Dr, left onto Arlene Ave; property is on the left
- Utilities: Public water; Septic tank sewer; Public utilities
- Home design: Single family residence; One level; Faces east
- Construction: Block and concrete construction; Shingle roof; Slab foundation; Built on 1 story
- Exterior features: Asphalt road access; 0.19 acre lot
Interior
- Kitchen: Microwave; Range; Refrigerator; Dishwasher
- Bedrooms: 4 bedrooms
- Flooring: Other flooring
- Bathrooms: 2 full bathrooms
- Heating & cooling: Central heating; Central air conditioning
- Interior features: Ceiling fans; Walk-in closets; 9 total rooms
- Laundry & utility: Inside laundry; Washer; Dryer
Neighborhood map
What this means for you Summary
Snapshot
- This is a 4-bed/2.0-bath single-family listed at $335k.
Deal economics
- At list price, monthly cash flow is $92 ($1k/yr) — positive.
- The deal already cash-flows at list — no discount required.
- To meet the 1% rule (rent ≥ 1% of price), the offer needs to be $261k (22.1% below list).
- Recommended offer: $261k (22.1% below list) — sets the bar for 1% rule.
Location & tenants
- Location reads 76/100 on livability (#218 in FL, #3,414 nationally) — a middle-class / working-renter tenant base. Strengths: crime A+, employment A+, housing A+; Watch: commute D, cost of living D, amenities F.
- Orange (suburban): math 46% / reading 51% proficiency, ranked #43 of 73 in FL (top 59%) — families likely to look elsewhere, expect single-tenant / working-renter base with shorter leases.
- Market conditions: Rents soft (-2.0%/yr); 214 active listings in the ZIP; 7 comparable units currently listed for rent nearby; rentals leasing fast (median 11d on market — plan ~1-2 weeks tenant-placement turnaround); 8,053 units permitted in Orange County in 2024 (3,133 in 5+ unit buildings).
- This rent runs 43% of the median local income ($73k/yr) — at the standard rent-burdened threshold; future hikes will face affordability resistance.
Forward outlook
- Local home prices are declining (-3.0%/yr); year-one equity from $2k of loan paydown is wiped out by about $10k of value loss. Plan a longer hold.
- Orange County population projected at +52% by 2050 — long-run rental-demand tailwind backs the buy-and-hold thesis.
Negotiation context
- It's been on market 64 days — a 6% lower offer ($315k) is reasonable based on typical stale-listing flexibility.
- 2 sale attempts with the ask held roughly flat each time — persistent listings suggest the price (not the market) is what's stuck; bring a comps-based counter.
- Current owner paid $111k; list at $335k implies a 202% gain — meaningful room to come down on a strong offer.
Risks & watch-outs
- Watch-outs: built in 1958 — expect roof / HVAC / electrical / plumbing capex.
- Climate carrying-cost: severe wind risk, 99% chance of damaging wind over 30y; extreme-heat days projected 7→24/yr by 2055 (HVAC capex compounding) — expect insurance premiums to compound above CPI over the hold.
Questions for the listing agent
- It's been on market 64 days. Have you received any prior offers? Is the seller open to a 22% concession, seller financing, or rate buy-down credit?
- Built in 1958 — when were the roof, HVAC, electrical panel, plumbing, and water heater last replaced?
- Why hasn't it sold? Are there any deal-killer items the seller is aware of (foundation, flood, title, zoning, code violations)?
- Is there a deadline driving the sale (1031 exchange, divorce, estate, relocation)? That informs how much negotiation room exists.
- Schools are B-rated — typically a magnet for longer-tenancy family renters. What's the average tenant stay here, and is there a school-zone premium baked into asking?
- The area grade is low — what's the realistic commute time and amenity access for the typical tenant pool here? Any planned neighborhood developments (good or bad) we should know about?
- What's the average days-on-market for RENTAL listings here right now (not sales)? A rising rental-DOM trend means longer vacancies and softer asking-rent achievability than the comps imply.
- What's the recent tenant-quality profile in this submarket — average credit score on applications, eviction rate, late-payment / NSF rate, and stable-employment percentage? A property-management company in the area should have these aggregated.
- How much new for-sale + rental construction is in the pipeline within 1–3 miles? Heavy new supply typically softens prices + rents 12–24 months out; constrained supply supports both.
Investment metrics
- 1% rule
- 0.78% ✗
- Cap rate
- 6.62%
- Cash-on-cash
- 1.18%
- DSCR
- 1.05
- GRM
- 10.7
CMA / ARV
- ARV (on-the-fly)
- $349,296
- Comps found
- 1
Show comp detail 1 sale within ~0.75 mi
| Address | Dist | Beds/Ba | Sqft | Sold | Price | $/sf | Match |
|---|---|---|---|---|---|---|---|
| 7621 Daetwyler Dr | 0.16mi | 3/2.0 (-1) | 1,491 (-3%) | 4mo | $339,900 | $228 | 80 |
Match score weights: distance 35% · size 25% · config 20% · recency 20%. Top-matched comps best support the ARV.
Projected returns pro-forma
-3.0% appreciation · 0.0% rent growth · sell at horizon
- IRR
- -17.4%
- Equity multiple
- 0.40×
- Total profit
- $-56,224
- Equity at exit
- $49,950
- IRR
- -15.3%
- Equity multiple
- 0.24×
- Total profit
- $-71,644
- Equity at exit
- $28,965
Cash invested: $93,800 (down + closing). Projections, not guarantees.
Landlord ↔ Tenant lean methodology
- Overall (STATE)
- 87 Strongly Landlord-Friendly
- State Florida
- 87 Strongly Landlord-Friendly · R+3
- County
- — inherits STATE
- City
- — inherits STATE
ZIP-level market 32812
- Rents YoY
- -2.0%
- Active inventory
- 214
- Price-to-rent
- 10.7×
Monthly cashflow live
- Estimated rent
- $2,609 high interval (Pro) →
- Mortgage (P&I)
- −$1,757
- Tax from tax record
- −$73 /mo · $872/yr
- Insurance
- −$140
- HOA
- −$0
- Vacancy / Maint / Mgmt
- −$548
- Net cashflow
- $92
Break-even live
UW: 25.0% down · 7.5% · 30yr · 1.5% tax · 5.0% vac · 8.0% maint · 8.0% mgmt
Financing live
Cash to close
- Down payment
- $83,750
- Closing costs
- $10,050
- Reserves months
- —
- Total cash needed
- —
Loan-product check · same deal, 3 products live
Conventional
25% down · 7.5% · 30yr
- Down + closing
- —
- Monthly P&I
- —
- Monthly cashflow
- —
- DSCR
- —
- Eligible?
- —
Personal DTI + credit; lowest rate.
DSCR
20% down · 8.5% · 30yr
- Down + closing
- —
- Monthly P&I
- —
- Monthly cashflow
- —
- DSCR
- —
- Eligible?
- —
No personal income docs; deal must DSCR.
Hard money
10% down · 12.0% · 12mo
- Down + closing
- —
- Monthly P&I
- —
- Monthly cashflow
- —
- DSCR
- —
- Eligible?
- —
Short-term bridge; refi at stabilization.
Rent comps 7 comps
| Address | Beds | Baths | Sqft | Rent | $/sqft | DOM | Units | Dist |
|---|---|---|---|---|---|---|---|---|
| 3733 Brighton Park Cir Orlando, FL | 3.0 | 2.5 | 1610 | $2,500 | $1.55 | 17d | 1 | 0.24mi |
| 3749 Brighton Park Cir Orlando, FL | 3.0 | 2.5 | 1674 | $2,650 | $1.58 | 24d | 1 | 0.25mi |
| 7824 Holiday Isle Dr #203 Orlando, FL | 3.0 | 2.0 | 1701 | $2,995 | $1.76 | 2d | 1 | 0.25mi |
| 3211 San Pedro Ln Orlando, FL | 3.0 | 2.0 | 1571 | $2,400 | $1.53 | 16d | 1 | 0.84mi |
| 3211 San Pedro Ln Orlando, FL | 3.0 | 2.0 | 1571 | $2,295 | $1.46 | 11d | 1 | 0.84mi |
| 2323 McCoy Rd Belle Isle, FL | 2.0–3.0 | 2.0 | 1025 | $1,700 | $1.66 | 2d | 1 | 1.02mi |
| 7200 N Frontage Rd Orlando, FL | 1.0–3.0 | 1.0–2.0 | 999 | $2,526 | $2.53 | 2d | 27 | 1.40mi |
Listing history 9 events
-
2026-04-15price $335,000
-
2026-03-25$345,000 Active
-
2026-02-27status Pending
-
2026-02-24historical
-
2026-01-27price $345,000
-
2025-11-06price $359,999
-
2025-09-25$365,000 Active
-
2004-06-18soldstatus $111,000
-
1971-06-01soldstatus $12,600
ⓘ Source: listings_history table (triggers on properties + properties_extension) + one-shot
backfill from property_details.listing_events for pre-trigger history.
Tax reassessment forecast FL · Resets to sale price
- Current annual tax
- $872 · $73/mo
- Projected year-2 tax
- $2,780 · $232/mo
- Expected delta
- +$1,908/yr (+$159/mo · 218.8%)
ⓘ Screening estimate from a state-policy table — verify with the county assessor before closing.
Climate risk First Street
- Flood 1/10 Low FEMA zone X (unshaded) · 0% chance over 30 yrs
- Wildfire 1/10 Low
- Heat 9/10 Extreme 7 d/yr ≥108°F today · 24 d/yr by 30 yrs out
- Wind 9/10 Extreme 99% chance of damaging wind over 30 yrs
- Air quality 2/10 Low 1 unhealthy d/yr today · 1 by 30 yrs out
Nearby sold comps map
Loading sold comps map…
Walkable amenities ~0.75 mi
Loading nearby amenities…
Taxation est. · year 1
- Rental income
- $31,312
- − Mortgage interest
- −$18,765
- − Property taxes
- −$872
- − Insurance
- −$1,675
- − Repairs & maintenance
- −$2,505
- − Management
- −$2,505
- − Depreciation
- −$9,745
- Taxable loss
- −$4,756
- Est. tax savings @ 24.0%
- +$1,141
- After-tax cash flow
- $2,249/yr
For passive investors: Depreciation is non-cash, so a rental often shows a tax loss while cash-flowing — sheltering income. Rental losses are passive: they offset passive income freely, and up to $25,000/yr can offset ordinary (W-2) income if you actively participate and your MAGI is under $100k (phasing out to $0 by $150k); unused losses carry forward. On sale, claimed depreciation is recaptured at up to 25%, and gains may owe capital-gains tax (a 1031 exchange can defer both). Figures are a year-1 estimate at your 24.0% rate — not tax advice; consult a CPA.
Schools (NCES district)
- District
- Orange
- NCES district ID
- 1201440
- Math proficiency
- 46% ▼ -9.00%
- Reading proficiency
- 51% ▼ -2.00%
- Median HH income
- $49,350
- Composite
- 41.47/100
- National rank
- #3461
- State rank
- #43 of 73 in FL
Livability — Belle Isle
- Score
- 76/100
- State rank
- #218
- US rank
- #3414
Category grades
Schools grade is shown separately in the Schools card above.
Census & demographics
- County
- Orange County · 1,471,359 people
- Metro
- Orlando-Kissimmee-Sanford, FL
- Population (ZIP)
- 34,686
- Household income
- $73,149
- Rent vs Own
- Severe rent burden
- 1653.0
Population outlook (Orange County) Hauer SSP2
- Today (2025)
- 1,618,226 people
- By 2030
- 1,787,404 · +10.5%
- By 2040
- 2,125,621 · +31.4%
- By 2050
- 2,454,016 · +51.6%
- By 2075
- 3,173,711 · +96.1%
- By 2100
- 3,607,781 · +122.9%
Race, ethnicity, and origin ACS 2023
- Neighborhood character
- Diverse neighborhood (Simpson 0.63)
- Race & ethnicity
- White 49% Hispanic / Latino 34% Two or more races 18% Black 8% Asian 4%
- Hispanic origin (detail)
- Mexican 3% Puerto Rican 18% Cuban 3% Dominican 2%
- Common ancestry
- Romanian 3% Slovak 2% Iranian 2%
- Foreign-born
- 13% · Canada, Jamaica, Vietnam
- Languages at home
- 66% English-only · Spanish 28% Chinese 2% Other Indo-European 1%
Political lean MEDSL · Orange
- 2024 margin
- D (+13.6) · D 56.1% · R 42.5% · Other 1.3%
- 2008→2024 swing
- -5.0pp toward R · 2008: 18.6pp · 2024: 13.6pp
- All cycles
- 2024: D+13.6 2020: D+23.1 2016: D+24.6 2012: D+18.2 2008: D+18.6
Not yet ingested
- Civics
- —
Market trends
- HPI YoY
- ▼ -202.16%
- Current HPI
- 352.6841
- Rent YoY
- ▼ -2.00%
- Metro
- Orlando-Kissimmee-Sanford, FL
- State GDP YoY
- ▲ 3.28%
- F500 in state
- 36
Industry mix (Fortune 500 HQ in FL)
| Industry | F500 HQs | Revenue |
|---|---|---|
| Industrial Technology | 2 | $29B |
|
||
| Insurance | 2 | $17B |
|
||
| Retail | 1 | $60B |
|
||
| Technology Distribution | 1 | $58B |
|
||
| Homebuilding | 1 | $35B |
|
||
| Technology Manufacturing | 1 | $35B |
|
||
Price history
+2558.7% since first listed9 events — show timeline
- 2026-04-15 Price Changed $335,000 Stellar MLS as Distributed by MLS Grid
- 2026-03-25 Listed $345,000 Stellar MLS as Distributed by MLS Grid
- 2026-02-27 Pending — Stellar MLS as Distributed by MLS Grid
- 2026-02-24 Listing Removed — Stellar MLS as Distributed by MLS Grid
- 2026-01-27 Price Changed $345,000 Stellar MLS as Distributed by MLS Grid
- 2025-11-06 Price Changed $359,999 Stellar MLS as Distributed by MLS Grid
- 2025-09-25 Listed $365,000 Stellar MLS as Distributed by MLS Grid
- 2004-06-18 Sold (Public Records) $111,000 Public Records
- 1971-06-01 Sold (Public Records) $12,600 Public Records
Property tax history
+2.5%/yrLatest (2025): $872 · +14.3% YoY. Source: county tax records.
Cash-flow waterfall
monthlySold comps — $/sqft
last 12 mo · ≤1 miLoading sold comps…