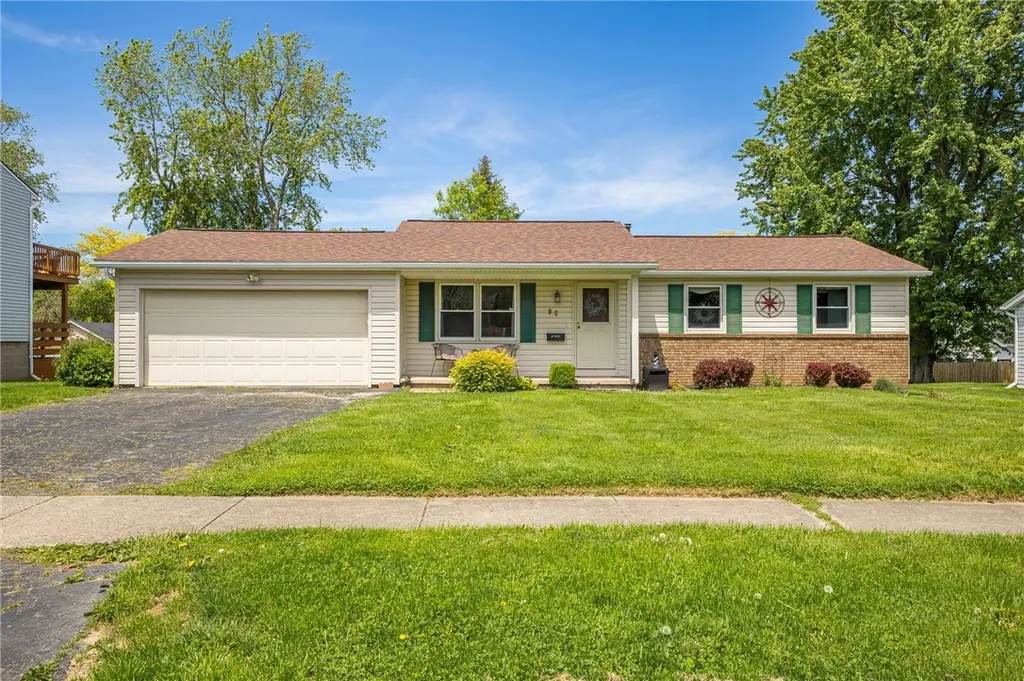
96 Grandview Ln · Greece, NY
Flood risk 1/10 · Minimal
- FEMA flood zone
- X (unshaded)
- Chance of flooding over 30 yrs
- 0.0%
- Est. flood insurance / yr
- $473 – $860
Fire risk 1/10 · Minimal
- Est. fire insurance / yr
- $691 – $1,283
Heat risk 2/10 · Minimal
- Hot days now (above 94°F)
- 7 days/yr
- Hot days in 30 yrs
- 16 days/yr
Wind risk 1/10 · Minimal
- Chance of severe wind over 30 yrs
- 1.0%
Air-quality risk 2/10 · Minimal
- Unhealthy air days now
- 1 days/yr
- Unhealthy air days in 30 yrs
- 1 days/yr
Risk factors via First Street. Map © Google.
Why this score? — see what drove the C+ grade
The composite is a weighted blend of 9 inputs, each scored 0–100. Each bar is that input's sub-score; the figure is the points it added to the 100-point composite (weight × sub-score).
- Cash flow +20.0/30.0
- ARV discount +15.0/15.0
- DSCR +6.4/10.0
- 1% rule +6.1/10.0
- Schools +5.3/10.0
- Livability +4.0/5.0
- Rent growth +3.8/5.0
- Condition / age +2.5/5.0
- Appreciation +0.0/10.0
$199,900
🖨 Deal sheet (PDF) 📄 Offer letter ✓ Due diligence
Listing remarks
Welcome to this well-maintained 4-bedroom, 2 full bath ranch located in the highly desirable Hilton Central School District! Just seconds from Lake Ontario with water access nearby, this home offers the perfect blend of comfort, space, and location. The main floor features 3 bedrooms and a functional layout filled with natural light, along with a spacious 3-season room perfect for relaxing or entertaining. The partially finished basement adds valuable extra living space, a 4th bedroom option, full bathroom and plenty of storage, complete with an egress window for peace of mind. Extra storage for all your outdoor equipment and toys with a large shed in the backyard. Whether you’re look
Key facts
- 3 season room
- Peaceful setting
- Large shed
Tags
Property features AI
Exterior
- Parking: Attached garage; 2-car garage
- Utilities: Public water connected; Sewer connected
- Home design: Single-story home; Existing (resale) property
- Construction: Vinyl siding; Asphalt roof; Block foundation; Built previously (existing)
- Exterior features: Blacktop driveway; Rectangular residential lot; Beach access nearby; Lake nearby; City street frontage; Lot approx. 65 x 130
Interior
- Kitchen: Gas oven and gas range; Microwave; Dishwasher; Disposal; Refrigerator; Eat-in kitchen
- Bedrooms: 3 main-level bedrooms
- Flooring: Hardwood; Carpet; Varies
- Bathrooms: 2 full bathrooms; 1 main-level bathroom
- Heating & cooling: Gas forced-air heating
- Interior features: Eat-in kitchen; Bedroom on main level; Main-level primary suite; Primary suite; 7 total rooms; Full, partially finished basement
- Laundry & utility: Washer and dryer; Laundry in basement; Gas water heater
Neighborhood map
What this means for you Summary
Snapshot
- This is a 3-bed/2.0-bath single-family listed at $200k.
Deal economics
- At list price, monthly cash flow is $246 ($3k/yr) — positive.
- The deal already cash-flows at list — no discount required.
- Meets the 1% rule at list price ($2k rent vs $200k).
- Cap rate 7.8% vs local median 3.7% in Greece — top-decile yield for the area; either an underpriced asset or a hidden risk that comps aren't pricing in. Stress-test before assuming the spread holds.
Location & tenants
- Location reads 79/100 on livability (#145 in NY, #2,223 nationally) — a middle-class / working-renter tenant base. Strengths: commute A+, housing A+, health & safety A+; Watch: schools D-, crime D-.
- Hilton Central School District (suburban): math 53% / reading 67% proficiency, ranked #219 of 590 in NY (top 37%) — acceptable for families but not a draw, mixed tenant base, ~2y average lease; only 16% free/reduced lunch — higher-income household profile.
- Market conditions: Rents rising fast (+5.4%/yr); 129 active listings in the ZIP; 2 comparable units currently listed for rent nearby; solid renter incomes; 1,169 units permitted in Monroe County in 2024 (591 in 5+ unit buildings).
- This rent runs 32% of the median local income ($83k/yr) — at the standard rent-burdened threshold; future hikes will face affordability resistance.
Forward outlook
- Local home prices are declining (-3.0%/yr); year-one equity from $1k of loan paydown is wiped out by about $6k of value loss. Plan a longer hold.
- Monroe County population projected to shrink 6% by 2050 — rents likely to lag national; underwrite the cash flow, not the appreciation.
Negotiation context
- Only 8 days on market — expect competitive offers; lowballing is unlikely to land.
- 2 sale attempts since 16y ago with the ask held roughly flat each time — persistent listings suggest the price (not the market) is what's stuck; bring a comps-based counter.
- Current owner paid $118k; list at $200k implies a 69% gain — meaningful room to come down on a strong offer.
Questions for the listing agent
- Is there a deadline driving the sale (1031 exchange, divorce, estate, relocation)? That informs how much negotiation room exists.
- Schools are D-rated, which usually means shorter tenancies and higher turnover. Who's the typical renter profile here, and what's been the actual vacancy rate?
- Crime grade is D in this area — have there been break-ins, vandalism, or insurance claims at this property in the last 3 years? What carrier currently insures it and at what premium?
- What's the average days-on-market for RENTAL listings here right now (not sales)? A rising rental-DOM trend means longer vacancies and softer asking-rent achievability than the comps imply.
- What's the recent tenant-quality profile in this submarket — average credit score on applications, eviction rate, late-payment / NSF rate, and stable-employment percentage? A property-management company in the area should have these aggregated.
- How much new for-sale + rental construction is in the pipeline within 1–3 miles? Heavy new supply typically softens prices + rents 12–24 months out; constrained supply supports both.
Investment metrics
- 1% rule
- 1.11% ✓
- Cap rate
- 7.77%
- Cash-on-cash
- 5.28%
- DSCR
- 1.24
- GRM
- 7.5
CMA / ARV
- ARV (on-the-fly)
- $258,834
- Comps found
- 7
Show comp detail 7 sales within ~0.75 mi
| Address | Dist | Beds/Ba | Sqft | Sold | Price | $/sf | Match |
|---|---|---|---|---|---|---|---|
| 192 Lowden Point Rd | 0.27mi | 3/1.0 | 1,108 (+3%) | 4mo | $154,900 | $140 | 74 |
| 295 Lowden Point Rd | 0.16mi | 2/1.0 (-1) | 936 (-13%) | 9mo | $201,000 | $215 | 55 |
| 45 Shoreway Dr | 0.47mi | 3/2.0 | 1,098 (+2%) | 24mo | $405,000 | $369 | 54 |
| 3065 Edgemere Dr | 0.53mi | 2/1.0 (-1) | 1,152 (+7%) | 9mo | $278,000 | $241 | 46 |
| 141 North Dr | 0.22mi | 2/1.0 (-1) | 916 (-15%) | 12mo | $255,000 | $278 | 46 |
| 2700 Edgemere Dr | 0.48mi | 3/1.0 | 1,203 (+12%) | 19mo | $369,900 | $307 | 38 |
| 3267 Edgemere Dr | 0.70mi | 2/1.0 (-1) | 1,068 (-1%) | 24mo | $202,000 | $189 | 38 |
Match score weights: distance 35% · size 25% · config 20% · recency 20%. Top-matched comps best support the ARV.
Projected returns pro-forma
-3.0% appreciation · 5.37% rent growth · sell at horizon
- IRR
- -5.2%
- Equity multiple
- 0.80×
- Total profit
- $-11,183
- Equity at exit
- $29,806
- IRR
- 7.3%
- Equity multiple
- 1.61×
- Total profit
- $34,211
- Equity at exit
- $17,284
Cash invested: $55,972 (down + closing). Projections, not guarantees.
Landlord ↔ Tenant lean methodology
- Overall (STATE)
- 15 Strongly Tenant-Friendly
- State New York
- 15 Strongly Tenant-Friendly · D+10
- County
- — inherits STATE
- City
- — inherits STATE
ZIP-level market 14612
- Home prices YoY
- -33.0%
- Rents YoY
- 5.4%
- Active inventory
- 129
- Price-to-rent
- 7.5×
Monthly cashflow live
- Estimated rent
- $2,216 medium interval (Pro) →
- Mortgage (P&I)
- −$1,048
- Tax from tax record
- −$373 /mo · $4,473/yr
- Insurance
- −$83
- HOA
- −$0
- Vacancy / Maint / Mgmt
- −$465
- Net cashflow
- $246
Break-even live
Sensitivity live
| Price | -10% $360 | -5% $303 | +0% $246 | +5% $190 | +10% $133 |
|---|---|---|---|---|---|
| Rent | -10% $71 | -5% $159 | +0% $246 | +5% $334 | +10% $421 |
| Rate | -1.0pp $347 | -0.5pp $297 | base $246 | +0.5pp $195 | +1.0pp $142 |
UW: 25.0% down · 7.5% · 30yr · 1.5% tax · 5.0% vac · 8.0% maint · 8.0% mgmt
Financing live
Cash to close
- Down payment
- $49,975
- Closing costs
- $5,997
- Reserves months
- —
- Total cash needed
- —
Loan-product check · same deal, 3 products live
Conventional
25% down · 7.5% · 30yr
- Down + closing
- —
- Monthly P&I
- —
- Monthly cashflow
- —
- DSCR
- —
- Eligible?
- —
Personal DTI + credit; lowest rate.
DSCR
20% down · 8.5% · 30yr
- Down + closing
- —
- Monthly P&I
- —
- Monthly cashflow
- —
- DSCR
- —
- Eligible?
- —
No personal income docs; deal must DSCR.
Hard money
10% down · 12.0% · 12mo
- Down + closing
- —
- Monthly P&I
- —
- Monthly cashflow
- —
- DSCR
- —
- Eligible?
- —
Short-term bridge; refi at stabilization.
Rent comps 2 comps
| Address | Beds | Baths | Sqft | Rent | $/sqft | DOM | Units | Dist |
|---|---|---|---|---|---|---|---|---|
| 2898 Edgemere Dr Rochester, NY | 3.0 | 2.0 | 1440 | $3,600 | $2.50 | 3d | 1 | 0.43mi |
| 3055 Edgemere Dr Rochester, NY | 2.0 | 1.0 | 1255 | $1,900 | $1.51 | 44d | 1 | 0.51mi |
Listing history 9 events
-
2026-06-05statusdays on market $199,900 Pending 8 DOM
-
2026-06-03days on market $199,900 Active 7 DOM
-
2026-06-03days on market $199,900 Active 6 DOM
-
2026-06-01days on market $199,900 Active 5 DOM
-
2026-05-31days on market $199,900 Active 4 DOM
-
2026-05-27$199,900 Active
-
2010-04-09soldstatus $118,500
-
2010-04-09soldstatus $118,500
-
2010-02-21$119,900
ⓘ Source: listings_history table (triggers on properties + properties_extension) + one-shot
backfill from property_details.listing_events for pre-trigger history.
Tax reassessment forecast NY · Partial reset (capped growth)
- Current annual tax
- $4,473 · $373/mo
- Projected year-2 tax
- $4,473 · $373/mo
- Expected delta
- $0/yr ($0/mo · 0.0%)
ⓘ Screening estimate from a state-policy table — verify with the county assessor before closing.
Climate risk First Street
- Flood 1/10 Low FEMA zone X (unshaded) · 0% chance over 30 yrs
- Wildfire 1/10 Low
- Heat 2/10 Low 7 d/yr ≥94°F today · 16 d/yr by 30 yrs out
- Wind 1/10 Low 100% chance of damaging wind over 30 yrs
- Air quality 2/10 Low 1 unhealthy d/yr today · 1 by 30 yrs out
Nearby sold comps map
Loading sold comps map…
Walkable amenities ~0.75 mi
Loading nearby amenities…
Taxation est. · year 1
- Rental income
- $26,593
- − Mortgage interest
- −$11,198
- − Property taxes
- −$4,473
- − Insurance
- −$1,000
- − Repairs & maintenance
- −$2,127
- − Management
- −$2,127
- − Depreciation
- −$5,815
- Taxable loss
- −$147
- Est. tax savings @ 24.0%
- +$35
- After-tax cash flow
- $2,992/yr
For passive investors: Depreciation is non-cash, so a rental often shows a tax loss while cash-flowing — sheltering income. Rental losses are passive: they offset passive income freely, and up to $25,000/yr can offset ordinary (W-2) income if you actively participate and your MAGI is under $100k (phasing out to $0 by $150k); unused losses carry forward. On sale, claimed depreciation is recaptured at up to 25%, and gains may owe capital-gains tax (a 1031 exchange can defer both). Figures are a year-1 estimate at your 24.0% rate — not tax advice; consult a CPA.
Schools (NCES district)
- District
- Hilton Central School District
- NCES district ID
- 3614460
- Math proficiency
- 53% ▼ -11.00%
- Reading proficiency
- 67% ▲ 9.00%
- Median HH income
- $68,270
- Composite
- 52.77/100
- National rank
- #1544
- State rank
- #219 of 590 in NY
Livability — Greece
- Score
- 79/100
- State rank
- #145
- US rank
- #2223
Category grades
Schools grade is shown separately in the Schools card above.
Census & demographics
- County
- Monroe County · 674,131 people
- City population
- 29,210
- Metro
- Rochester, NY
- Population (ZIP)
- 35,152
- Household income
- $82,800
- Rent vs Own
- Severe rent burden
- 1063.0
Population outlook (Monroe County) Hauer SSP2
- Today (2025)
- 759,460 people
- By 2030
- 757,154 · -0.3%
- By 2040
- 740,644 · -2.5%
- By 2050
- 714,443 · -5.9%
- By 2075
- 645,883 · -15.0%
- By 2100
- 547,084 · -28.0%
Race, ethnicity, and origin ACS 2023
- Neighborhood character
- Predominantly White (78%)
- Race & ethnicity
- White 78% Black 9% Hispanic / Latino 7% Two or more races 6%
- Hispanic origin (detail)
- Puerto Rican 5%
- Common ancestry
- Romanian 4% Lithuanian 3% Slovak 2%
- Foreign-born
- 5% · Canada
- Languages at home
- 93% English-only · Spanish 4% Other Indo-European 1% Russian/Polish/Slavic 1%
Political lean MEDSL · Monroe
- 2024 margin
- D (+19.1) · D 59.5% · R 40.5%
- 2008→2024 swing
- +1.4pp toward D · 2008: 17.7pp · 2024: 19.1pp
- All cycles
- 2024: D+19.1 2020: D+21.0 2016: D+14.1 2012: D+17.4 2008: D+17.7
Not yet ingested
- Civics
- —
Market trends
- HPI YoY
- ▼ -124.89%
- Current HPI
- 254.157
- Rent YoY
- ▲ 5.37%
- Metro
- Rochester, NY
- State GDP YoY
- ▲ 2.60%
- F500 in state
- 92
Industry mix (Fortune 500 HQ in NY)
| Industry | F500 HQs | Revenue |
|---|---|---|
| Financial Services | 10 | $950B |
|
||
| Consumer Goods | 9 | $162B |
|
||
| Insurance | 4 | $225B |
|
||
| Telecommunications | 2 | $144B |
|
||
| Pharmaceuticals | 2 | $112B |
|
||
| Media / Entertainment | 2 | $69B |
|
||
Price history
+66.7% since first listed4 events — show timeline
- 2026-05-27 Listed $199,900 UNYREIS
- 2010-04-09 Sold (Public Records) $118,500 Public Records
- 2010-04-09 Sold (MLS) $118,500 UNYREIS
- 2010-02-21 Listed $119,900 UNYREIS
Property tax history
+0.3%/yrLatest (2025): $4,473 · +144.9% YoY. Source: county tax records.
Cash-flow waterfall
monthlySold comps — $/sqft
last 12 mo · ≤1 miLoading sold comps…