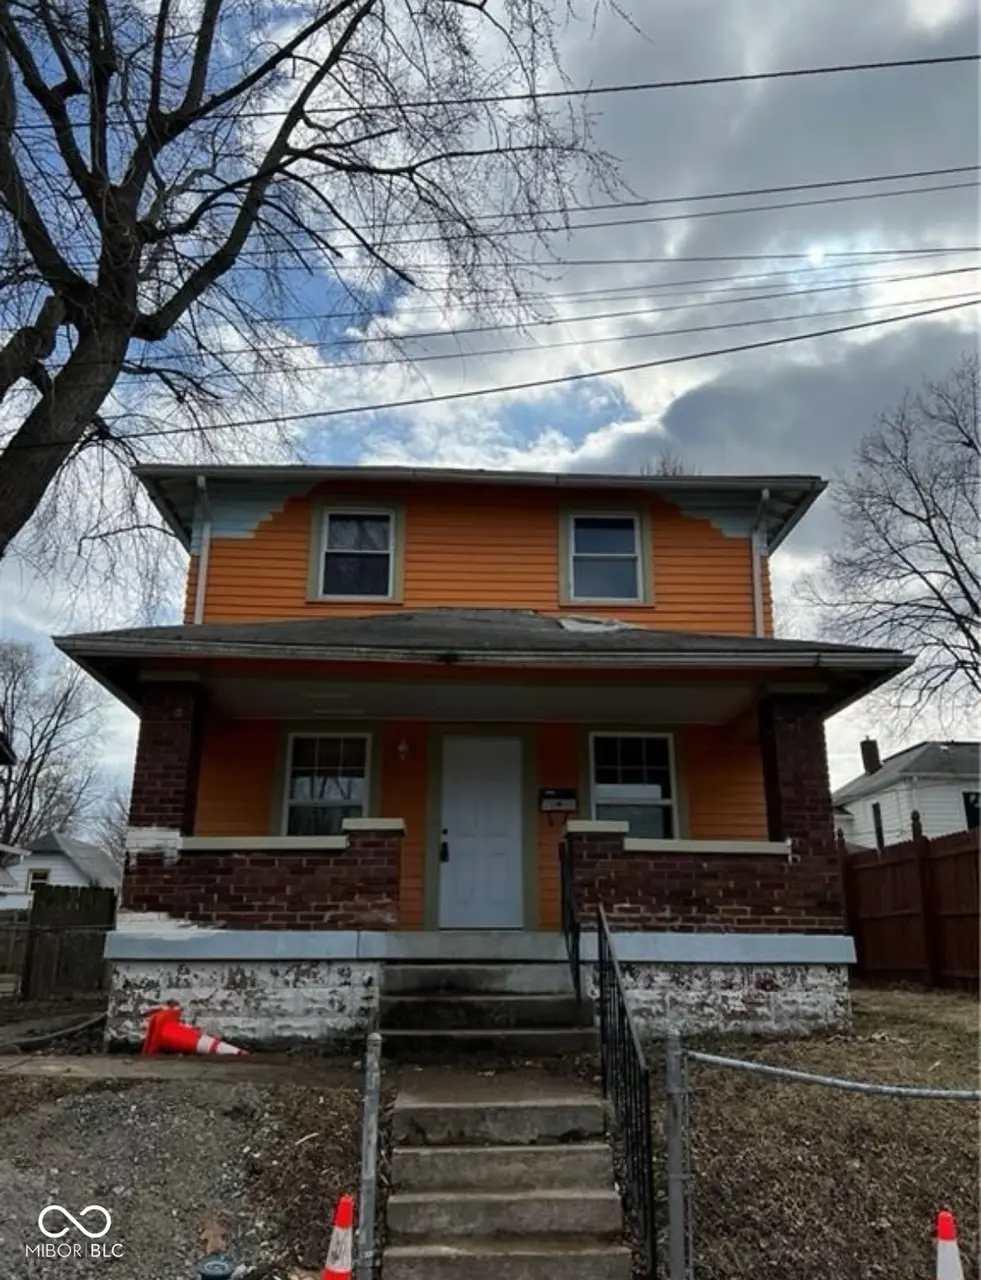
2607 E 12th St · Indianapolis city (balance), IN
Flood risk 1/10 · Minimal
- FEMA flood zone
- X (unshaded)
- Chance of flooding over 30 yrs
- 0.0%
- Est. flood insurance / yr
- $473 – $860
Fire risk 1/10 · Minimal
- Est. fire insurance / yr
- $717 – $1,331
Heat risk 3/10 · Minor
- Hot days now (above 102°F)
- 7 days/yr
- Hot days in 30 yrs
- 19 days/yr
Wind risk 2/10 · Minimal
- Chance of severe wind over 30 yrs
- 0.0%
Air-quality risk 4/10 · Minor
- Unhealthy air days now
- 5 days/yr
- Unhealthy air days in 30 yrs
- 7 days/yr
Risk factors via First Street. Map © Google.
Why this score? — see what drove the C- grade
The composite is a weighted blend of 9 inputs, each scored 0–100. Each bar is that input's sub-score; the figure is the points it added to the 100-point composite (weight × sub-score).
- Cash flow +16.0/30.0
- ARV discount +15.0/15.0
- DSCR +4.9/10.0
- 1% rule +4.8/10.0
- Rent growth +4.3/5.0
- Livability +2.5/5.0
- Condition / age +2.5/5.0
- Schools +1.4/10.0
- Appreciation +0.0/10.0
$144,500
🖨 Deal sheet 📄 Offer letter ✓ Due diligence
Listing remarks MLS
Don't miss this incredible flipping and renovation opportunity located in Vajens Springdale, quiet and safe neighborhood. This property offers endless potential to create your dream home or maximize your investment. Featuring a convenient basement-accessible door and ample space for creative redesign, this is your chance to add value and transform this diamond in the rough. Bring your tools, design vision, and get ready to turn this property into a showstopper!
Key facts
- 3,006 sq ft lot
- Built 1924
- Listed 494 days
Tags
Neighborhood map
What this means for you Summary
Snapshot
- This is a 3-bed/1.0-bath single-family listed at $144k.
Deal economics
- At list price, monthly cash flow is $70 ($843/yr) — positive.
- The deal already cash-flows at list — no discount required.
- To meet the 1% rule (rent ≥ 1% of price), the offer needs to be $141k (2.3% below list).
- Recommended offer: $127k (12.0% below list) — sets the bar for market timing.
- Cap rate 6.9% vs local median 4.4% in Indianapolis city (balance) — top-decile yield for the area; either an underpriced asset or a hidden risk that comps aren't pricing in. Stress-test before assuming the spread holds.
Location & tenants
- Location reads: area grade C — affects rentability + tenant quality, not the cash-flow math above.
- Indianapolis Public Schools (urban): math 14% / reading 20% proficiency, ranked #286 of 301 in IN (top 95%) — low school quality limits family demand, transient renter base, plan for 1-2y turnover; 77% free/reduced lunch — lower-income household profile, screen leases tightly.
- Market conditions: Rents rising fast (+7.3%/yr); 480 active listings in the ZIP; 40 comparable units currently listed for rent nearby; rentals at typical pace (median 24d on market — plan ~3-4 weeks tenant-placement turnaround); 1,906 units permitted in Marion County in 2024 (621 in 5+ unit buildings).
- This rent runs 34% of the median local income ($49k/yr) — at the standard rent-burdened threshold; future hikes will face affordability resistance.
Forward outlook
- Local home prices are declining (-3.0%/yr); year-one equity from $999 of loan paydown is wiped out by about $4k of value loss. Plan a longer hold.
- Marion County population projected at +18% by 2050 — long-run rental-demand tailwind backs the buy-and-hold thesis.
Negotiation context
- It's been on market 494 days — a 12% lower offer ($127k) is reasonable based on typical stale-listing flexibility.
- 4 sale attempts since 4y ago; this cycle's ask has dropped $15k (9%) from the opening price — seller is motivated, your offer sets the floor, not the list.
- Current owner paid $110k; 31% above their basis — modest negotiation headroom, anchor on the comps not their cost.
Risks & watch-outs
- Watch-outs: built in 1924 — expect roof / HVAC / electrical / plumbing capex.
Questions for the listing agent
- It's been on market 494 days. Have you received any prior offers? Is the seller open to a 12% concession, seller financing, or rate buy-down credit?
- Built in 1924 — when were the roof, HVAC, electrical panel, plumbing, and water heater last replaced?
- Why hasn't it sold? Are there any deal-killer items the seller is aware of (foundation, flood, title, zoning, code violations)?
- Is there a deadline driving the sale (1031 exchange, divorce, estate, relocation)? That informs how much negotiation room exists.
- What's the average days-on-market for RENTAL listings here right now (not sales)? A rising rental-DOM trend means longer vacancies and softer asking-rent achievability than the comps imply.
- What's the recent tenant-quality profile in this submarket — average credit score on applications, eviction rate, late-payment / NSF rate, and stable-employment percentage? A property-management company in the area should have these aggregated.
- How much new for-sale + rental construction is in the pipeline within 1–3 miles? Heavy new supply typically softens prices + rents 12–24 months out; constrained supply supports both.
Investment metrics
- 1% rule
- 0.98% ✗
- Cap rate
- 6.88%
- Cash-on-cash
- 2.08%
- DSCR
- 1.09
- GRM
- 8.5
CMA / ARV
- ARV (median comp)
- $195,402
- List price
- $144,500
- Delta
- -26.05%
- Verdict
- UNDERPRICED
- Comps
- 20 within 1.0 mi
Show comp detail 12 sales within ~0.75 mi
| Address | Dist | Beds/Ba | Sqft | Sold | Price | $/sf | Match |
|---|---|---|---|---|---|---|---|
| 1223 N Temple Ave | 0.06mi | 3/2.0 | 1,234 (+0%) | 3mo | $190,000 | $154 | 91 |
| 2430 E 16th St | 0.35mi | 2/1.0 (-1) | 1,287 (+4%) | 0mo | $77,000 | $60 | 71 |
| 1109 N Olney St | 0.58mi | 3/2.0 | 1,202 (-2%) | 8mo | $169,000 | $141 | 58 |
| 2729 Massachusetts Ave | 0.69mi | 3/2.0 | 1,260 (+2%) | 3mo | $178,000 | $141 | 58 |
| 2624 E 17th St | 0.43mi | 2/1.0 (-1) | 1,192 (-3%) | 14mo | $135,000 | $113 | 58 |
| 815 Tecumseh St | 0.55mi | 2/1.5 (-1) | 1,356 (+10%) | 1mo | $225,000 | $166 | 50 |
| 3109 E St Joseph St | 0.40mi | 3/2.0 | 1,078 (-12%) | 10mo | $108,000 | $100 | 48 |
| 2909 E Michigan St | 0.66mi | 2/2.0 (-1) | 1,260 (+2%) | 11mo | $215,000 | $171 | 47 |
| 1129 Larch St | 0.53mi | 2/2.0 (-1) | 1,365 (+11%) | 7mo | $318,500 | $233 | 43 |
| 1130 N Hamilton Ave | 0.42mi | 2/2.0 (-1) | 1,402 (+14%) | 7mo | $175,000 | $125 | 43 |
| 401 Eastern Ave | 0.73mi | 2/1.0 (-1) | 1,332 (+8%) | 8mo | $32,000 | $24 | 40 |
| 805 N Tuxedo St | 0.65mi | 2/2.0 (-1) | 1,347 (+9%) | 11mo | $178,000 | $132 | 36 |
Match score weights: distance 35% · size 25% · config 20% · recency 20%. Top-matched comps best support the ARV.
Projected returns pro-forma
-3.0% appreciation · 7.31% rent growth · sell at horizon
- IRR
- -8.0%
- Equity multiple
- 0.69×
- Total profit
- $-12,499
- Equity at exit
- $21,545
- IRR
- 6.5%
- Equity multiple
- 1.59×
- Total profit
- $23,744
- Equity at exit
- $12,494
Cash invested: $40,460 (down + closing). Projections, not guarantees.
Landlord ↔ Tenant lean methodology
- Overall (STATE)
- 90 Strongly Landlord-Friendly
- State Indiana
- 90 Strongly Landlord-Friendly · R+11
- County
- — inherits STATE
- City
- — inherits STATE
ZIP-level market 46201
- Home prices YoY
- -33.9%
- Rents YoY
- 7.3%
- Active inventory
- 480
- Price-to-rent
- 8.5×
Monthly cashflow live
- Estimated rent
- $1,412 high interval (Pro) →
- Mortgage (P&I)
- −$758
- Tax from tax record
- −$227 /mo · $2,728/yr
- Insurance
- −$60
- HOA
- −$0
- Vacancy / Maint / Mgmt
- −$297
- Net cashflow
- $70
Break-even live
UW: 25.0% down · 7.5% · 30yr · 1.5% tax · 5.0% vac · 8.0% maint · 8.0% mgmt
Financing live
Cash to close
- Down payment
- $36,125
- Closing costs
- $4,335
- Reserves months
- —
- Total cash needed
- —
Loan-product check · same deal, 3 products live
Conventional
25% down · 7.5% · 30yr
- Down + closing
- —
- Monthly P&I
- —
- Monthly cashflow
- —
- DSCR
- —
- Eligible?
- —
Personal DTI + credit; lowest rate.
DSCR
20% down · 8.5% · 30yr
- Down + closing
- —
- Monthly P&I
- —
- Monthly cashflow
- —
- DSCR
- —
- Eligible?
- —
No personal income docs; deal must DSCR.
Hard money
10% down · 12.0% · 12mo
- Down + closing
- —
- Monthly P&I
- —
- Monthly cashflow
- —
- DSCR
- —
- Eligible?
- —
Short-term bridge; refi at stabilization.
Rent comps 40 comps
| Address | Beds | Baths | Sqft | Rent | $/sqft | DOM | Units | Dist |
|---|---|---|---|---|---|---|---|---|
| 1112 N Rural St Unit 1110 Indianapolis, IN | 2.0 | 1.5 | 1204 | $1,150 | $0.96 | 23d | 1 | 0.10mi |
| 1113 N Oxford St Indianapolis, IN | 3.0 | 2.0 | 1100 | $1,495 | $1.36 | 7d | 1 | 0.18mi |
| 2310 E 12th St Indianapolis, IN | 2.0 | 1.0 | 900 | $1,200 | $1.33 | 43d | 1 | 0.22mi |
| 1036 N Parker Ave Indianapolis, IN | 4.0 | 2.0 | 1342 | $1,745 | $1.30 | 4d | 1 | 0.24mi |
| 1038 N Parker Ave Indianapolis, IN | 4.0 | 2.0 | 1342 | $1,745 | $1.30 | 4d | 1 | 0.24mi |
| 1214 N Oakland Ave Indianapolis, IN | 3.0 | 2.0 | 1464 | $1,350 | $0.92 | 13d | 1 | 0.28mi |
| 1216 N Oakland Ave Indianapolis, IN | 3.0 | 2.0 | 1464 | $1,550 | $1.06 | 13d | 1 | 0.29mi |
| 1550 N Rural St Indianapolis, IN | 3.0 | 1.0 | 1388 | $1,600 | $1.15 | 43d | 1 | 0.30mi |
| 2405 E 16th St Indianapolis, IN | 3.0 | 1.0 | 1120 | $1,450 | $1.29 | 14d | 1 | 0.30mi |
| 3030 E 10th St Indianapolis, IN | 2.0 | 1.0 | 950 | $900 | $0.95 | 21d | 1 | 0.31mi |
| 2407 E 16th St Indianapolis, IN | 3.0 | 1.0 | 1212 | $1,450 | $1.20 | 23d | 1 | 0.31mi |
| 3101 E 10th St #301 Indianapolis, IN | 2.0 | 1.0 | 921 | $1,195 | $1.30 | 43d | 1 | 0.33mi |
| 929 N Beville Ave Indianapolis, IN | 3.0 | 1.0 | 1328 | $1,395 | $1.05 | 23d | 1 | 0.34mi |
| 851 N Rural St Indianapolis, IN | 3.0 | 2.5 | 1300 | $1,700 | $1.31 | 23d | 1 | 0.34mi |
| 849 N Rural St Unit 849 Indianapolis, IN | 3.0 | 2.5 | 1300 | $2,000 | $1.54 | 43d | 1 | 0.34mi |
| 2330 E 16th St Indianapolis, IN | 3.0 | 1.5 | 1378 | $1,450 | $1.05 | 4d | 1 | 0.35mi |
| 1623 N Rural St Indianapolis, IN | 2.0 | 1.0 | 1452 | $875 | $0.60 | 43d | 1 | 0.38mi |
| 1119 N Dearborn St Indianapolis, IN | 3.0 | 1.5 | 1200 | $1,249 | $1.04 | 43d | 1 | 0.38mi |
| 940 Jefferson Ave Unit 1 Indianapolis, IN | 3.0 | 1.5 | 1500 | $1,400 | $0.93 | 21d | 1 | 0.39mi |
| 826 N Beville Ave Indianapolis, IN | 3.0 | 1.0 | 1472 | $1,295 | $0.88 | 2d | 1 | 0.44mi |
| 826 N Beville Ave Indianapolis, IN | 3.0 | 1.0 | 1472 | $1,295 | $0.88 | 4d | 1 | 0.44mi |
| 645 N Oxford St Indianapolis, IN | 4.0 | 1.5 | 1344 | $1,500 | $1.12 | 23d | 1 | 0.47mi |
| 818 N Oakland Ave Unit 46201 Indianapolis, IN | 3.0 | 1.5 | 1332 | $1,550 | $1.16 | 43d | 1 | 0.47mi |
| 639 N Rural St Indianapolis, IN | 3.0 | 1.0 | 1000 | $1,675 | $1.68 | 17d | 1 | 0.47mi |
| 627 N Tacoma Ave Indianapolis, IN | 3.0 | 1.0 | 1160 | $1,350 | $1.16 | 10d | 1 | 0.47mi |
| 933 N Dearborn St Indianapolis, IN | 3.0 | 1.5 | 1204 | $1,500 | $1.25 | 43d | 1 | 0.48mi |
| 625 N Tacoma Ave Indianapolis, IN | 3.0 | 1.0 | 1160 | $1,350 | $1.16 | 10d | 1 | 0.48mi |
| 2827 E 18th St Indianapolis, IN | 2.0 | 1.0 | 726 | $1,300 | $1.79 | 23d | 1 | 0.50mi |
| 619 N Rural St Indianapolis, IN | 3.0 | 2.0 | 1300 | $1,600 | $1.23 | 23d | 1 | 0.51mi |
| 1018 N Tuxedo St Unit 1016 Indianapolis, IN | 3.0 | 1.5 | 1250 | $1,099 | $0.88 | 43d | 1 | 0.52mi |
| 835 Tecumseh St Indianapolis, IN | 3.0 | 2.0 | 1100 | $1,550 | $1.41 | 4d | 1 | 0.53mi |
| 632 N Gray St Indianapolis, IN | 3.0 | 1.0 | 960 | $1,800 | $1.88 | 43d | 1 | 0.56mi |
| 840 N Lasalle St Indianapolis, IN | 3.0 | 1.0 | 1215 | $1,100 | $0.91 | 23d | 1 | 0.57mi |
| 639 N Gray St Indianapolis, IN | 3.0 | 1.5 | 1120 | $1,220 | $1.09 | 43d | 1 | 0.57mi |
| 637 N Gray St Indianapolis, IN | 3.0 | 1.5 | 1120 | $1,150 | $1.03 | 44d | 1 | 0.57mi |
| 953 N Tuxedo St Indianapolis, IN | 3.0 | 1.0 | 1200 | $950 | $0.79 | 23d | 1 | 0.57mi |
| 2841 E 19th St Indianapolis, IN | 2.0 | 1.0 | 812 | $850 | $1.05 | 4d | 1 | 0.58mi |
| 1505 N Tuxedo St Unit 1507 Indianapolis, IN | 2.0 | 1.0 | 1000 | $1,100 | $1.10 | 43d | 1 | 0.59mi |
| 2822 E 19th St Indianapolis, IN | 3.0 | 2.0 | 1130 | $1,300 | $1.15 | 43d | 1 | 0.59mi |
| 1301 N Olney St Unit 1303 Indianapolis, IN | 2.0 | 1.0 | 750 | $1,100 | $1.47 | 43d | 1 | 0.60mi |
Listing history 23 events
-
2026-06-18days on market $144,500 Active 494 DOM
-
2026-06-17days on market $144,500 Active 493 DOM
-
2026-06-16days on market $144,500 Active 492 DOM
-
2026-06-15days on market $144,500 Active 491 DOM
-
2026-06-13days on market $144,500 Active 489 DOM
-
2026-06-13days on market $144,500 Active 488 DOM
-
2026-06-09days on market $144,500 Active 485 DOM
-
2026-06-08days on market $144,500 Active 484 DOM
-
2026-06-07days on market $144,500 Active 483 DOM
-
2026-06-03days on market $144,500 Active 479 DOM
-
2026-06-02days on market $144,500 Active 478 DOM
-
2026-06-01days on market $144,500 Active 477 DOM
-
2026-05-31days on market $144,500 Active 476 DOM
-
2026-05-07status Active 465-char remark
Show marketing remark (465 chars)
Don't miss this incredible flipping and renovation opportunity located in Vajens Springdale, quiet and safe neighborhood. This property offers endless potential to create your dream home or maximize your investment. Featuring a convenient basement-accessible door and ample space for creative redesign, this is your chance to add value and transform this diamond in the rough. Bring your tools, design vision, and get ready to turn this property into a showstopper!
-
2026-04-30historical 465-char remark
Show marketing remark (465 chars)
Don't miss this incredible flipping and renovation opportunity located in Vajens Springdale, quiet and safe neighborhood. This property offers endless potential to create your dream home or maximize your investment. Featuring a convenient basement-accessible door and ample space for creative redesign, this is your chance to add value and transform this diamond in the rough. Bring your tools, design vision, and get ready to turn this property into a showstopper!
-
2025-07-28status Active 465-char remark
Show marketing remark (465 chars)
Don't miss this incredible flipping and renovation opportunity located in Vajens Springdale, quiet and safe neighborhood. This property offers endless potential to create your dream home or maximize your investment. Featuring a convenient basement-accessible door and ample space for creative redesign, this is your chance to add value and transform this diamond in the rough. Bring your tools, design vision, and get ready to turn this property into a showstopper!
-
2025-07-10historical 465-char remark
Show marketing remark (465 chars)
Don't miss this incredible flipping and renovation opportunity located in Vajens Springdale, quiet and safe neighborhood. This property offers endless potential to create your dream home or maximize your investment. Featuring a convenient basement-accessible door and ample space for creative redesign, this is your chance to add value and transform this diamond in the rough. Bring your tools, design vision, and get ready to turn this property into a showstopper!
-
2025-04-10price $144,500 465-char remark
Show marketing remark (465 chars)
Don't miss this incredible flipping and renovation opportunity located in Vajens Springdale, quiet and safe neighborhood. This property offers endless potential to create your dream home or maximize your investment. Featuring a convenient basement-accessible door and ample space for creative redesign, this is your chance to add value and transform this diamond in the rough. Bring your tools, design vision, and get ready to turn this property into a showstopper!
-
2025-03-06price $154,500 465-char remark
Show marketing remark (465 chars)
Don't miss this incredible flipping and renovation opportunity located in Vajens Springdale, quiet and safe neighborhood. This property offers endless potential to create your dream home or maximize your investment. Featuring a convenient basement-accessible door and ample space for creative redesign, this is your chance to add value and transform this diamond in the rough. Bring your tools, design vision, and get ready to turn this property into a showstopper!
-
2025-01-15$159,500 Active 465-char remark
Show marketing remark (465 chars)
Don't miss this incredible flipping and renovation opportunity located in Vajens Springdale, quiet and safe neighborhood. This property offers endless potential to create your dream home or maximize your investment. Featuring a convenient basement-accessible door and ample space for creative redesign, this is your chance to add value and transform this diamond in the rough. Bring your tools, design vision, and get ready to turn this property into a showstopper!
-
2022-03-07soldstatus $110,000 Closed 345-char remark
Show marketing remark (345 chars)
Great investment opportunity in Vajens Springdale. Minutes from downtown and surrounded by renovated properties this home is a great opportunity for any investor or family looking to rehab a home. Windows, front door, HVAC, and water heater all newer and were previously well maintained. Don't miss this opportunity, schedule your showing TODAY!
-
2022-02-24status Pending 345-char remark
Show marketing remark (345 chars)
Great investment opportunity in Vajens Springdale. Minutes from downtown and surrounded by renovated properties this home is a great opportunity for any investor or family looking to rehab a home. Windows, front door, HVAC, and water heater all newer and were previously well maintained. Don't miss this opportunity, schedule your showing TODAY!
-
2022-02-23$84,900 Active 345-char remark
Show marketing remark (345 chars)
Great investment opportunity in Vajens Springdale. Minutes from downtown and surrounded by renovated properties this home is a great opportunity for any investor or family looking to rehab a home. Windows, front door, HVAC, and water heater all newer and were previously well maintained. Don't miss this opportunity, schedule your showing TODAY!
ⓘ Source: listings_history table (triggers on properties + properties_extension) + one-shot
backfill from property_details.listing_events for pre-trigger history.
Tax reassessment forecast IN · Partial reset (capped growth)
- Current annual tax
- $2,728 · $227/mo
- Projected year-2 tax
- $2,728 · $227/mo
- Expected delta
- $0/yr ($0/mo · 0.0%)
ⓘ Screening estimate from a state-policy table — verify with the county assessor before closing.
Climate risk First Street
- Flood 1/10 Low FEMA zone X (unshaded) · 0% chance over 30 yrs
- Wildfire 1/10 Low
- Heat 3/10 Moderate 7 d/yr ≥102°F today · 19 d/yr by 30 yrs out
- Wind 2/10 Low 0% chance of damaging wind over 30 yrs
- Air quality 4/10 Moderate 5 unhealthy d/yr today · 7 by 30 yrs out
Nearby sold comps map
Loading sold comps map…
Walkable amenities ~0.75 mi
Loading nearby amenities…
Taxation est. · year 1
- Rental income
- $16,946
- − Mortgage interest
- −$8,094
- − Property taxes
- −$2,728
- − Insurance
- −$722
- − Repairs & maintenance
- −$1,356
- − Management
- −$1,356
- − Depreciation
- −$4,204
- Taxable loss
- −$1,514
- Est. tax savings @ 24.0%
- +$363
- After-tax cash flow
- $1,207/yr
For passive investors: Depreciation is non-cash, so a rental often shows a tax loss while cash-flowing — sheltering income. Rental losses are passive: they offset passive income freely, and up to $25,000/yr can offset ordinary (W-2) income if you actively participate and your MAGI is under $100k (phasing out to $0 by $150k); unused losses carry forward. On sale, claimed depreciation is recaptured at up to 25%, and gains may owe capital-gains tax (a 1031 exchange can defer both). Figures are a year-1 estimate at your 24.0% rate — not tax advice; consult a CPA.
Schools (NCES district)
- District
- Indianapolis Public Schools
- NCES district ID
- 1804770
- Math proficiency
- 14% ▼ -7.00%
- Reading proficiency
- 20% ▼ -3.00%
- Median HH income
- $32,034
- Composite
- 13.69/100
- National rank
- #9499
- State rank
- #286 of 301 in IN
Livability — Indianapolis city (balance)
No livability data for this city. (Only ~50 U.S. cities are tracked.)
Census & demographics
- Census place
- Indianapolis city (balance), IN
- County
- Marion County · 998,460 people
- City population
- 881,119
- Metro
- Indianapolis-Carmel-Anderson, IN
- Population (ZIP)
- 30,335
- Household income
- $49,195
- Rent vs Own
- Severe rent burden
- 1906.0
Population outlook (Marion County) Hauer SSP2
- Today (2025)
- 1,025,572 people
- By 2030
- 1,065,727 · +3.9%
- By 2040
- 1,141,577 · +11.3%
- By 2050
- 1,208,920 · +17.9%
- By 2075
- 1,367,288 · +33.3%
- By 2100
- 1,438,201 · +40.2%
Race, ethnicity, and origin ACS 2023
- Neighborhood character
- Diverse neighborhood (Simpson 0.63)
- Race & ethnicity
- White 53% Hispanic / Latino 23% Black 18% Two or more races 9%
- Hispanic origin (detail)
- Mexican 14% Puerto Rican 2%
- Common ancestry
- Slovak 2% Lithuanian 2% Italian 1%
- Foreign-born
- 9% · Canada
- Languages at home
- 81% English-only · Spanish 17%
Political lean MEDSL · Marion
- 2024 margin
- Strong D (+27.7) · D 63.0% · R 35.3% · Other 1.7%
- 2008→2024 swing
- -0.7pp no change · 2008: 28.4pp · 2024: 27.7pp
- All cycles
- 2024: D+27.7 2020: D+29.1 2016: D+22.8 2012: D+22.2 2008: D+28.4
Not yet ingested
- Civics
- —
Market trends
- HPI YoY
- ▼ -192.51%
- Current HPI
- 375.0969
- Rent YoY
- ▲ 7.31%
- Metro
- Indianapolis-Carmel-Anderson, IN
- State GDP YoY
- ▲ 2.90%
- F500 in state
- 18
Industry mix (Fortune 500 HQ in IN)
| Industry | F500 HQs | Revenue |
|---|---|---|
| Industrial Machinery | 2 | $37B |
|
||
| Healthcare | 1 | $177B |
|
||
| Pharmaceuticals | 1 | $45B |
|
||
| Metals / Steel | 1 | $18B |
|
||
| Agriculture | 1 | $17B |
|
||
| Packaging | 1 | $12B |
|
||
Price history
+70.2% since first listed10 events — show timeline
- 2026-05-07 Relisted — MIBOR as Distributed by MLS Grid
- 2026-04-30 Listing Removed — MIBOR as Distributed by MLS Grid
- 2025-07-28 Relisted — MIBOR as Distributed by MLS Grid
- 2025-07-10 Listing Removed — MIBOR as Distributed by MLS Grid
- 2025-04-10 Price Changed $144,500 MIBOR as Distributed by MLS Grid
- 2025-03-06 Price Changed $154,500 MIBOR as Distributed by MLS Grid
- 2025-01-15 Listed $159,500 MIBOR as Distributed by MLS Grid
- 2022-03-07 Sold (MLS) $110,000 MIBOR as Distributed by MLS Grid
- 2022-02-24 Pending — MIBOR as Distributed by MLS Grid
- 2022-02-23 Listed $84,900 MIBOR as Distributed by MLS Grid
Property tax history
+21.5%/yrLatest (2025): $2,728 · -13.8% YoY. Source: county tax records.
Cash-flow waterfall
monthlySold comps — $/sqft
last 12 mo · ≤1 miLoading sold comps…