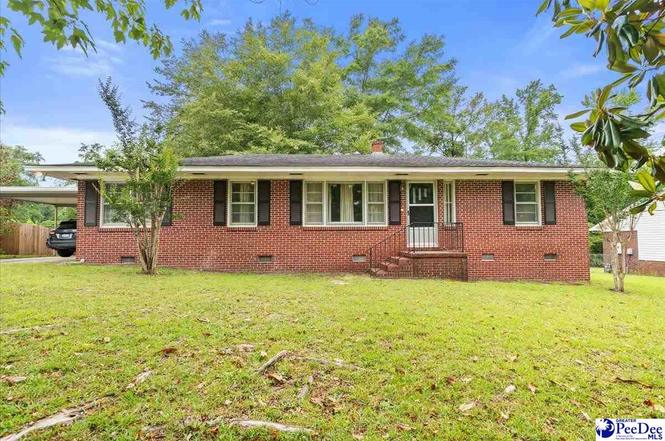
1309 Virginia Acres · Florence, SC
Flood risk 1/10 · Minimal
- FEMA flood zone
- X (unshaded)
- Chance of flooding over 30 yrs
- 0.0%
- Est. flood insurance / yr
- $473 – $860
Fire risk 4/10 · Minor
- Est. fire insurance / yr
- $783 – $1,453
Heat risk 7/10 · Major
- Hot days now (above 108°F)
- 7 days/yr
- Hot days in 30 yrs
- 15 days/yr
Wind risk 8/10 · Major
- Chance of severe wind over 30 yrs
- 80.0%
Air-quality risk 1/10 · Minimal
- Unhealthy air days now
- 0 days/yr
- Unhealthy air days in 30 yrs
- 0 days/yr
Risk factors via First Street. Map © Google.
Why this score? — see what drove the B grade
The composite is a weighted blend of 9 inputs, each scored 0–100. Each bar is that input's sub-score; the figure is the points it added to the 100-point composite (weight × sub-score).
- Cash flow +26.8/30.0
- ARV discount +15.0/15.0
- DSCR +9.2/10.0
- 1% rule +6.1/10.0
- Rent growth +4.2/5.0
- Schools +3.2/10.0
- Livability +3.1/5.0
- Condition / age +2.5/5.0
- Appreciation +0.0/10.0
$159,900
🖨 Deal sheet (PDF) 📄 Offer letter ✓ Due diligence
Listing remarks MLS
Great well kept home with gas water heater, heat pump (2007), well insulated attic, basement, roof (2000), double carport, great back yard, excellent condition, quiet street, conenient to schools, shopping, refrigerator to remain, utility room in basement, fenced yard, nice deck.
Key facts
- Dead end street
- Brick home
- Fenced in back yard
Tags
Property features AI
Exterior
- Utilities: Public water; Public sewer
- Home design: Single-family residence; Residential property; Located in Virginia Acres subdivision
- Construction: Brick veneer construction; Shingle roof; Crawl space foundation; Built area above grade: 1,474
- Exterior features: Deck; Fenced yard
Interior
- Kitchen: Oven; Refrigerator
- Flooring: Carpet; Vinyl; Wood; Hardwood
- Bathrooms: 2 full bathrooms
- Heating & cooling: Central heating; Central air; Ceiling fans
- Interior features: Fireplace (1)
Neighborhood map
What this means for you Summary
Snapshot
- This is a 3-bed/2.0-bath single-family listed at $160k.
Deal economics
- At list price, monthly cash flow is $440 ($5k/yr) — positive.
- The deal already cash-flows at list — no discount required.
- Meets the 1% rule at list price ($2k rent vs $160k).
- Cap rate 9.6% vs local median 3.5% in Florence — top-decile yield for the area; either an underpriced asset or a hidden risk that comps aren't pricing in. Stress-test before assuming the spread holds.
Location & tenants
- Location reads 62/100 on livability (#196 in SC) — a middle-class / working-renter tenant base. Strengths: cost of living A+, housing A+, health & safety B+; Watch: employment C-, crime F, amenities F.
- Florence 01 (urban): math 29% / reading 47% proficiency, ranked #34 of 80 in SC (top 42%) — families likely to look elsewhere, expect single-tenant / working-renter base with shorter leases.
- Zoned schools: Briggs Elementary (math 37% / reading 48%, grade F, #252 of 597 statewide, top 43%, 434 students, 73% FRL); Henry L. Sneed Middle (math 16% / reading 35%, grade F, #162 of 229 statewide, top 71%, 693 students, 94% FRL); South Florence High (math 58% / reading 86%, grade B+, #48 of 196 statewide, top 26%, 1,643 students, 77% FRL) — zoned schools average 81% FRL vs 57% district-wide (24 pts higher); higher-poverty schools than district average — tighter screening recommended.
- Market conditions: Rents rising fast (+7.0%/yr); 183 active listings in the ZIP; 657 units permitted in Florence County in 2024 (40 in 5+ unit buildings).
- This rent runs 32% of the median local income ($67k/yr) — at the standard rent-burdened threshold; future hikes will face affordability resistance.
Forward outlook
- Local home prices are declining (-3.0%/yr); year-one equity from $1k of loan paydown is wiped out by about $5k of value loss. Plan a longer hold.
- At projected returns (-3.0% appreciation + 7.0% rent growth), your $45k cash investment doubles in ~8 years — after that, you're playing with house money.
Negotiation context
- Only 4 days on market — expect competitive offers; lowballing is unlikely to land.
- 2 sale attempts since 13y ago with the ask held roughly flat each time — persistent listings suggest the price (not the market) is what's stuck; bring a comps-based counter.
Risks & watch-outs
- Watch-outs: built in 1955 — expect roof / HVAC / electrical / plumbing capex.
- Climate carrying-cost: severe wind risk, 80% chance of damaging wind over 30y; extreme-heat days projected 7→15/yr by 2055 (HVAC capex compounding) — expect insurance premiums to compound above CPI over the hold.
Questions for the listing agent
- Built in 1955 — when were the roof, HVAC, electrical panel, plumbing, and water heater last replaced?
- Is there a deadline driving the sale (1031 exchange, divorce, estate, relocation)? That informs how much negotiation room exists.
- Crime grade is F in this area — have there been break-ins, vandalism, or insurance claims at this property in the last 3 years? What carrier currently insures it and at what premium?
- What's the average days-on-market for RENTAL listings here right now (not sales)? A rising rental-DOM trend means longer vacancies and softer asking-rent achievability than the comps imply.
- What's the recent tenant-quality profile in this submarket — average credit score on applications, eviction rate, late-payment / NSF rate, and stable-employment percentage? A property-management company in the area should have these aggregated.
- How much new for-sale + rental construction is in the pipeline within 1–3 miles? Heavy new supply typically softens prices + rents 12–24 months out; constrained supply supports both.
Investment metrics
- 1% rule
- 1.11% ✓
- Cap rate
- 9.59%
- Cash-on-cash
- 11.79%
- DSCR
- 1.52
- GRM
- 7.5
CMA / ARV
- ARV (on-the-fly)
- $195,888
- Comps found
- 12
Show comp detail 12 sales within ~0.75 mi
| Address | Dist | Beds/Ba | Sqft | Sold | Price | $/sf | Match |
|---|---|---|---|---|---|---|---|
| 1505 Damon Dr | 0.37mi | 3/2.0 | 1,508 (+2%) | 2mo | $169,900 | $113 | 78 |
| 1400 Marion Ave | 0.13mi | 3/2.0 | 1,396 (-6%) | 14mo | $217,900 | $156 | 73 |
| 1407 Marion Ave | 0.07mi | 3/2.0 | 1,612 (+9%) | 18mo | $185,000 | $115 | 67 |
| 1155 Pinckney Ave | 0.52mi | 3/2.0 | 1,504 (+1%) | 11mo | $186,250 | $124 | 64 |
| 1212 Melrose Ave | 0.31mi | 3/2.0 | 1,616 (+9%) | 8mo | $232,900 | $144 | 64 |
| 711 Manchester | 0.43mi | 3/2.0 | 1,581 (+6%) | 12mo | $212,500 | $134 | 59 |
| 1162 Pinckney Ave | 0.57mi | 3/2.0 | 1,633 (+10%) | 1mo | $242,900 | $149 | 56 |
| 1175 Berkeley Ave | 0.47mi | 3/1.5 | 1,627 (+10%) | 7mo | $180,000 | $111 | 54 |
| 1117 Second Loop Rd | 0.25mi | 3/2.0 | 1,701 (+15%) | 14mo | $225,000 | $132 | 52 |
| 1124 Rutledge Ave | 0.38mi | 3/2.0 | 1,323 (-11%) | 18mo | $225,000 | $170 | 49 |
| 1555 Damon Dr | 0.43mi | 3/2.0 | 1,664 (+12%) | 18mo | $190,000 | $114 | 45 |
| 1224 Pinckney Ave | 0.67mi | 3/2.5 | 1,659 (+12%) | 15mo | $200,000 | $121 | 34 |
Match score weights: distance 35% · size 25% · config 20% · recency 20%. Top-matched comps best support the ARV.
Projected returns pro-forma
-3.0% appreciation · 6.97% rent growth · sell at horizon
- IRR
- 5.2%
- Equity multiple
- 1.21×
- Total profit
- $9,385
- Equity at exit
- $23,842
- IRR
- 17.7%
- Equity multiple
- 2.71×
- Total profit
- $76,714
- Equity at exit
- $13,825
Cash invested: $44,772 (down + closing). Projections, not guarantees.
Landlord ↔ Tenant lean methodology
- Overall (STATE)
- 90 Strongly Landlord-Friendly
- State South Carolina
- 90 Strongly Landlord-Friendly · R+6
- County
- — inherits STATE
- City
- — inherits STATE
ZIP-level market 29505
- Rents YoY
- 7.0%
- Active inventory
- 183
- Price-to-rent
- 7.5×
Monthly cashflow live
- Estimated rent
- $1,769 medium interval (Pro) →
- Mortgage (P&I)
- −$839
- Tax from tax record
- −$53 /mo · $634/yr
- Insurance
- −$67
- HOA
- −$0
- Lot rent
- −$0
- Vacancy / Maint / Mgmt
- −$372
- Net cashflow
- $440
Break-even live
Sensitivity live
| Price | -10% $530 | -5% $485 | +0% $440 | +5% $395 | +10% $349 |
|---|---|---|---|---|---|
| Rent | -10% $300 | -5% $370 | +0% $440 | +5% $510 | +10% $580 |
| Rate | -1.0pp $520 | -0.5pp $480 | base $440 | +0.5pp $398 | +1.0pp $356 |
UW: 25.0% down · 7.5% · 30yr · 1.5% tax · 5.0% vac · 8.0% maint · 8.0% mgmt
Financing live
Cash to close
- Down payment
- $39,975
- Closing costs
- $4,797
- Reserves months
- —
- Total cash needed
- —
Loan-product check · same deal, 3 products live
Conventional
25% down · 7.5% · 30yr
- Down + closing
- —
- Monthly P&I
- —
- Monthly cashflow
- —
- DSCR
- —
- Eligible?
- —
Personal DTI + credit; lowest rate.
DSCR
20% down · 8.5% · 30yr
- Down + closing
- —
- Monthly P&I
- —
- Monthly cashflow
- —
- DSCR
- —
- Eligible?
- —
No personal income docs; deal must DSCR.
Hard money
10% down · 12.0% · 12mo
- Down + closing
- —
- Monthly P&I
- —
- Monthly cashflow
- —
- DSCR
- —
- Eligible?
- —
Short-term bridge; refi at stabilization.
Listing history 4 events
-
2026-06-23days on market $159,900 Active 4 DOM
-
2026-06-22days on market $159,900 Active 3 DOM
-
2026-06-19remarks 195-char remark
-
2026-06-19$159,900 Active 1 DOM
ⓘ Source: listings_history table (triggers on properties + properties_extension) + one-shot
backfill from property_details.listing_events for pre-trigger history.
Tax reassessment forecast SC · Resets to sale price
- Current annual tax
- $634 · $53/mo
- Projected year-2 tax
- $911 · $76/mo
- Expected delta
- +$277/yr (+$23/mo · 43.6%)
ⓘ Screening estimate from a state-policy table — verify with the county assessor before closing.
Climate risk First Street
- Flood 1/10 Low FEMA zone X (unshaded) · 0% chance over 30 yrs
- Wildfire 4/10 Moderate
- Heat 7/10 Severe 7 d/yr ≥108°F today · 15 d/yr by 30 yrs out
- Wind 8/10 Severe 80% chance of damaging wind over 30 yrs
- Air quality 1/10 Low 0 unhealthy d/yr today · 0 by 30 yrs out
Nearby sold comps map
Loading sold comps map…
Walkable amenities ~0.75 mi
Loading nearby amenities…
Taxation est. · year 1
- Rental income
- $21,233
- − Mortgage interest
- −$8,957
- − Property taxes
- −$634
- − Insurance
- −$800
- − Repairs & maintenance
- −$1,699
- − Management
- −$1,699
- − Depreciation
- −$4,652
- Taxable income
- $2,793
- Est. tax owed @ 24.0%
- −$670
- After-tax cash flow
- $4,607/yr
For passive investors: Depreciation is non-cash, so a rental often shows a tax loss while cash-flowing — sheltering income. Rental losses are passive: they offset passive income freely, and up to $25,000/yr can offset ordinary (W-2) income if you actively participate and your MAGI is under $100k (phasing out to $0 by $150k); unused losses carry forward. On sale, claimed depreciation is recaptured at up to 25%, and gains may owe capital-gains tax (a 1031 exchange can defer both). Figures are a year-1 estimate at your 24.0% rate — not tax advice; consult a CPA.
Schools (NCES district)
- District
- Florence 01
- NCES district ID
- 4502130
- Math proficiency
- 29% ▼ -10.00%
- Reading proficiency
- 47% ▬ 0.00%
- Median HH income
- $45,782
- Composite
- 32.36/100
- National rank
- #5737
- State rank
- #34 of 80 in SC
Livability — Florence
- Score
- 62/100
- State rank
- #196
- US rank
- #17076
Category grades
Schools grade is shown separately in the Schools card above.
Census & demographics
- Census place
- Florence, SC
- County
- Florence County · 93,345 people
- City population
- 93,345
- Metro
- Florence, SC
- Population (ZIP)
- 23,895
- Household income
- $67,343
- Rent vs Own
- Severe rent burden
- 559.0
Population outlook (Florence County) Hauer SSP2
- Today (2025)
- 141,714 people
- By 2030
- 142,121 · +0.3%
- By 2040
- 141,344 · -0.3%
- By 2050
- 139,478 · -1.6%
- By 2075
- 132,275 · -6.7%
- By 2100
- 118,374 · -16.5%
Race, ethnicity, and origin ACS 2023
- Neighborhood character
- Diverse neighborhood (Simpson 0.57)
- Race & ethnicity
- White 53% Black 38% Hispanic / Latino 5% Two or more races 3% Asian 1%
- Common ancestry
- Slovak 2% Lithuanian 1% Serbian 1%
- Foreign-born
- 3% · Canada, China
- Languages at home
- 96% English-only · Spanish 2% Other Indo-European 1%
Political lean MEDSL · Florence
- 2024 margin
- Lean R (+8.0) · D 45.3% · R 53.3% · Other 1.3%
- 2008→2024 swing
- -4.8pp toward R · 2008: -3.2pp · 2024: -8.0pp
- All cycles
- 2024: R+8.0 2020: R+2.3 2016: R+5.0 2012: R+0.5 2008: R+3.2
Not yet ingested
- Civics
- —
Market trends
- HPI YoY
- ▼ -138.13%
- Current HPI
- 177.9352
- Rent YoY
- ▲ 6.97%
- Metro
- Florence, SC
- State GDP YoY
- ▲ 4.51%
- F500 in state
- 2
Industry mix (Fortune 500 HQ in SC)
| Industry | F500 HQs | Revenue |
|---|---|---|
| Packaging | 1 | $7B |
|
||
Price history
+60.1% since first listed3 events — show timeline
- 2026-06-19 Listed $159,900 RAGPD
- 2013-02-27 Sold (MLS) — RAGPD
- 2013-01-28 Listed $99,900 RAGPD
Property tax history
+6.7%/yrLatest (2025): $634 · +21.9% YoY. Source: county tax records.
Cash-flow waterfall
monthlySold comps — $/sqft
last 12 mo · ≤1 miLoading sold comps…