 16-Plex
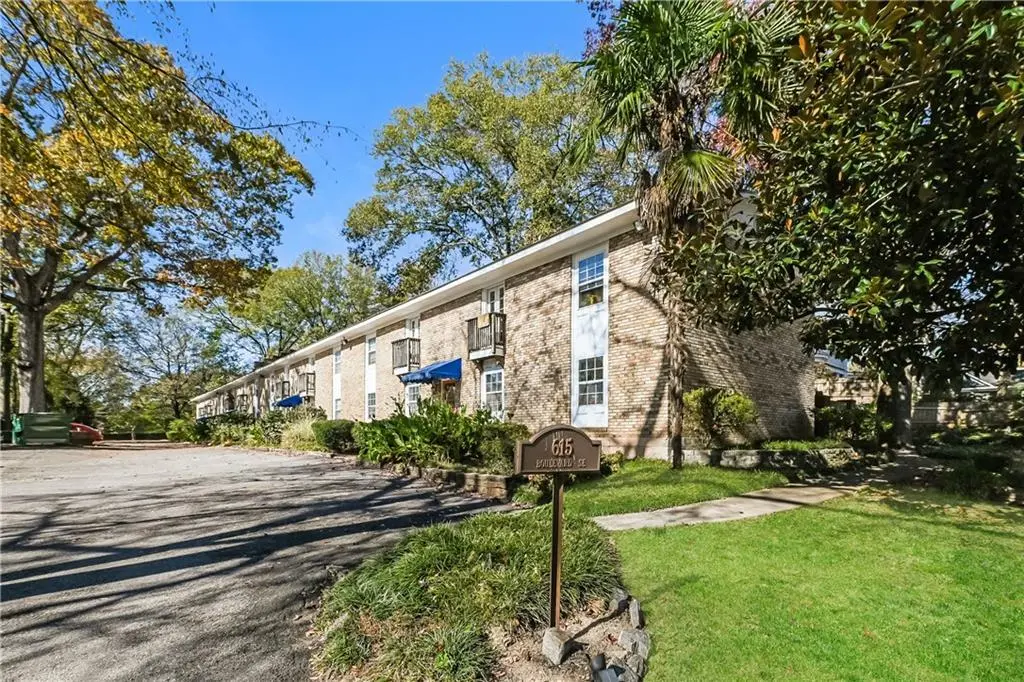
615 Boulevard SE · Atlanta, GA
Flood risk 1/10 · Minimal
- FEMA flood zone
- X (unshaded)
- Chance of flooding over 30 yrs
- 0.0%
- Est. flood insurance / yr
- $507 – $1,088
Fire risk 1/10 · Minimal
- Est. fire insurance / yr
- $963 – $1,789
Heat risk 5/10 · Moderate
- Hot days now (above 104°F)
- 7 days/yr
- Hot days in 30 yrs
- 18 days/yr
Wind risk 4/10 · Minor
- Chance of severe wind over 30 yrs
- 24.0%
Air-quality risk 4/10 · Minor
- Unhealthy air days now
- 4 days/yr
- Unhealthy air days in 30 yrs
- 6 days/yr
Risk factors via First Street. Map © Google.
Why this score? — see what drove the C grade
The composite is a weighted blend of 9 inputs, each scored 0–100. Each bar is that input's sub-score; the figure is the points it added to the 100-point composite (weight × sub-score).
- Cash flow +23.4/30.0
- DSCR +7.5/10.0
- ARV discount +7.5/15.0
- 1% rule +6.1/10.0
- Livability +4.2/5.0
- Rent growth +3.2/5.0
- Schools +2.7/10.0
- Condition / age +2.5/5.0
- Appreciation +0.0/10.0
$3,100,000
🖨 Deal sheet 📄 Offer letter ✓ Due diligence
Multi-family units
County records classify this as Multi-Family (5+ Unit). Listing-text estimate: 16 units. confirmed
5+ unit building — per-unit beds/baths from public records are typically unavailable; the breakdown below (if shown) is an estimate from the listing text.
Listing remarks MLS
Lacy & Associates, LLC is exclusively marketing 615 Boulevard SE, a 16-unit multifamily investment opportunity located in Atlanta’s Historic Grant Park neighborhood. The offering includes the adjacent parcel at 623 Boulevard and is being offered as a single, non-severable assemblage, with both parcels conveyed as part of one transaction. The property offers investors a compelling value-add opportunity supported by a stabilized operating base and multiple paths to future NOI growth. In addition to rent growth potential, the asset benefits from individually metered water and electric service, providing a meaningful operational advantage through improved utility control and reimbursement potential. A key differentiator within the offering is 623 Boulevard, which adds embedded land value and strategic flexibility in a highly constrained intown corridor. Currently utilized as greenspace, the parcel may offer future utility for parking enhancement, amenity expansion, or other site-related improvements, subject to buyer diligence. The opportunity should be evaluated on a combined basis, as 615 and 623 convey together and will not be sold separately. The property is well positioned within one of Atlanta’s most desirable in-town neighborhoods, with convenient access to Grant Park, Zoo Atlanta, neighborhood retail and dining, Downtown Atlanta, and the BeltLine network, including the Southeast BeltLine Trail. The surrounding area is further supported by proximity to major employment, education, and entertainment destinations, helping underpin long-term renter demand and occupancy durability.
Key facts
- Greenspace
- Parking enhancement
- Convenient access
Tags
Neighborhood map
What this means for you Summary
Snapshot
- This is a 16 × 2-bed/1.0-bath units multifamily listed at $3.10M.
Deal economics
- At list price, monthly cash flow is $6k ($69k/yr) — positive. Per door: $359/mo.
- The deal already cash-flows at list — no discount required.
- Meets the 1% rule at list price ($34k rent vs $3.10M).
- Recommended offer: $3.01M (3.0% below list) — sets the bar for market timing.
- Cap rate 8.5% vs local median 3.1% in Atlanta — top-decile yield for the area; either an underpriced asset or a hidden risk that comps aren't pricing in. Stress-test before assuming the spread holds.
Location & tenants
- Location reads 83/100 on livability (#6 in GA, #919 nationally) — a professional / high-income tenant draw. Strengths: amenities A+, commute A+, housing A+; Watch: schools C-, cost of living C-.
- Atlanta Public Schools (urban): math 28% / reading 35% proficiency, ranked #80 of 174 in GA (top 46%) — families likely to look elsewhere, expect single-tenant / working-renter base with shorter leases; 71% free/reduced lunch — lower-income household profile, screen leases tightly.
- Market conditions: Rents rising (+2.8%/yr); 237 active listings in the ZIP; solid renter incomes; 11,565 units permitted in Fulton County in 2024 (8,159 in 5+ unit buildings).
- At $34,498/mo this rent would consume 500% of the median local household income ($83k/yr) (locally 2010% of renters already pay >50% of income on rent) — very limited rent-growth headroom before tenants either downsize or default.
Forward outlook
- Local home prices are declining (-3.0%/yr); year-one equity from $21k of loan paydown is wiped out by about $93k of value loss. Plan a longer hold.
- Fulton County population projected at +38% by 2050 — long-run rental-demand tailwind backs the buy-and-hold thesis.
Negotiation context
- It's been on market 42 days — a 3% lower offer ($3.01M) is reasonable based on typical stale-listing flexibility.
- 25 sale attempts since 2y ago; this cycle's ask is 200029% above the opening price — seller raised mid-cycle; expect resistance to lowballs.
Risks & watch-outs
- Climate carrying-cost: extreme-heat days projected 7→18/yr by 2055 (HVAC capex compounding) — expect insurance premiums to compound above CPI over the hold.
Questions for the listing agent
- It's been on market 42 days. Have you received any prior offers? Is the seller open to a 3% concession, seller financing, or rate buy-down credit?
- Can we see the unit-by-unit rent roll, current vacancy, and any below-market leases? What's the average tenancy length?
- What capital expenditures (roof, boiler, parking lot, exteriors) have been made in the last 5 years, and what's planned in the next 2?
- Built in 1963 — when were the roof, HVAC, electrical panel, plumbing, and water heater last replaced?
- Is there a deadline driving the sale (1031 exchange, divorce, estate, relocation)? That informs how much negotiation room exists.
- What's the average days-on-market for RENTAL listings here right now (not sales)? A rising rental-DOM trend means longer vacancies and softer asking-rent achievability than the comps imply.
- What's the recent tenant-quality profile in this submarket — average credit score on applications, eviction rate, late-payment / NSF rate, and stable-employment percentage? A property-management company in the area should have these aggregated.
- How much new apartment / multifamily construction is in the pipeline within 1–3 miles? Heavy new supply (>2% of stock underway) typically softens rents 12–24 months out; light construction supports rent growth.
Investment metrics
- 1% rule
- 1.11% ✓
- Cap rate
- 8.52%
- Cash-on-cash
- 7.94%
- DSCR
- 1.35
- GRM
- 7.5
CMA / ARV
No comps found within radius.
Projected returns pro-forma
-3.0% appreciation · 2.84% rent growth · sell at horizon
- IRR
- -4.4%
- Equity multiple
- 0.84×
- Total profit
- $-141,685
- Equity at exit
- $462,220
- IRR
- 5.1%
- Equity multiple
- 1.38×
- Total profit
- $327,071
- Equity at exit
- $268,031
Cash invested: $868,000 (down + closing). Projections, not guarantees.
Landlord ↔ Tenant lean methodology
- Overall (STATE)
- 90 Strongly Landlord-Friendly
- State Georgia
- 90 Strongly Landlord-Friendly · R+3
- County
- — inherits STATE
- City
- — inherits STATE
ZIP-level market 30312
- Rents YoY
- 2.8%
- Active inventory
- 237
- Price-to-rent
- 119.8×
Monthly cashflow live
- Estimated rent
- $34,498 high interval (Pro) →
- Mortgage (P&I)
- −$16,257
- Tax from tax record
- −$3,964 /mo · $47,574/yr
- Insurance
- −$1,292
- HOA
- −$0
- Vacancy / Maint / Mgmt
- −$7,245
- Net cashflow
- $5,741
Break-even live
16-unit breakdown (identical units grouped — click to expand)
| Units | Beds | Baths | Est. rent |
|---|---|---|---|
| 16× units | 2 | 1 | $34,496 |
| #1 | 2 | 1 | $2,156 |
| #2 | 2 | 1 | $2,156 |
| #3 | 2 | 1 | $2,156 |
| #4 | 2 | 1 | $2,156 |
| #5 | 2 | 1 | $2,156 |
| #6 | 2 | 1 | $2,156 |
| #7 | 2 | 1 | $2,156 |
| #8 | 2 | 1 | $2,156 |
| #9 | 2 | 1 | $2,156 |
| #10 | 2 | 1 | $2,156 |
| #11 | 2 | 1 | $2,156 |
| #12 | 2 | 1 | $2,156 |
| #13 | 2 | 1 | $2,156 |
| #14 | 2 | 1 | $2,156 |
| #15 | 2 | 1 | $2,156 |
| #16 | 2 | 1 | $2,156 |
| Total (16 units) | $34,498 | ||
UW: 25.0% down · 7.5% · 30yr · 1.5% tax · 5.0% vac · 8.0% maint · 8.0% mgmt
Financing live
Cash to close
- Down payment
- $775,000
- Closing costs
- $93,000
- Reserves months
- —
- Total cash needed
- —
Loan-product check · same deal, 3 products live
Conventional
25% down · 7.5% · 30yr
- Down + closing
- —
- Monthly P&I
- —
- Monthly cashflow
- —
- DSCR
- —
- Eligible?
- —
Personal DTI + credit; lowest rate.
DSCR
20% down · 8.5% · 30yr
- Down + closing
- —
- Monthly P&I
- —
- Monthly cashflow
- —
- DSCR
- —
- Eligible?
- —
No personal income docs; deal must DSCR.
Hard money
10% down · 12.0% · 12mo
- Down + closing
- —
- Monthly P&I
- —
- Monthly cashflow
- —
- DSCR
- —
- Eligible?
- —
Short-term bridge; refi at stabilization.
Listing history 50 events
-
2026-06-18days on market $3,100,000 Active 42 DOM
-
2026-06-17days on market $3,100,000 Active 41 DOM
-
2026-06-16days on market $3,100,000 Active 40 DOM
-
2026-06-15days on market $3,100,000 Active 39 DOM
-
2026-06-13days on market $3,100,000 Active 37 DOM
-
2026-06-13days on market $3,100,000 Active 36 DOM
-
2026-06-09days on market $3,100,000 Active 33 DOM
-
2026-06-08days on market $3,100,000 Active 32 DOM
-
2026-06-07days on market $3,100,000 Active 31 DOM
-
2026-06-04days on market $3,100,000 Active 28 DOM
-
2026-06-03days on market $3,100,000 Active 27 DOM
-
2026-06-02days on market $3,100,000 Active 26 DOM
-
2026-06-01days on market $3,100,000 Active 25 DOM
-
2026-05-31days on market $3,100,000 Active 24 DOM
-
2026-05-20price $1,299
-
2026-05-17$1,549
-
2026-05-16historical $1,349
-
2026-05-13price $1,349
-
2026-05-13price $1,525
-
2026-05-09price $1,399
-
2026-05-07$3,100,000 Active 1632-char remark
Show marketing remark (1632 chars)
Lacy & Associates, LLC is exclusively marketing 615 Boulevard SE, a 16-unit multifamily investment opportunity located in Atlanta’s Historic Grant Park neighborhood. The offering includes the adjacent parcel at 623 Boulevard and is being offered as a single, non-severable assemblage, with both parcels conveyed as part of one transaction. The property offers investors a compelling value-add opportunity supported by a stabilized operating base and multiple paths to future NOI growth. In addition to rent growth potential, the asset benefits from individually metered water and electric service, providing a meaningful operational advantage through improved utility control and reimbursement potential. A key differentiator within the offering is 623 Boulevard, which adds embedded land value and strategic flexibility in a highly constrained intown corridor. Currently utilized as greenspace, the parcel may offer future utility for parking enhancement, amenity expansion, or other site-related improvements, subject to buyer diligence. The opportunity should be evaluated on a combined basis, as 615 and 623 convey together and will not be sold separately. The property is well positioned within one of Atlanta’s most desirable in-town neighborhoods, with convenient access to Grant Park, Zoo Atlanta, neighborhood retail and dining, Downtown Atlanta, and the BeltLine network, including the Southeast BeltLine Trail. The surrounding area is further supported by proximity to major employment, education, and entertainment destinations, helping underpin long-term renter demand and occupancy durability.
-
2026-04-24$1,549
-
2026-04-18price $1,425
-
2026-04-15price $1,499
-
2026-04-14$1,525
-
2026-04-13historical $1,599
-
2026-04-03$1,599
-
2025-06-21historical $1,395
-
2025-06-06$1,395
-
2025-06-06historical $1,395
-
2025-06-02$1,395
-
2025-06-02historical $1,395
-
2025-05-27$1,395
-
2024-12-17historical $1,595
-
2024-11-28$1,595
-
2024-11-28historical $1,595
-
2024-11-27$1,595
-
2024-11-17historical $1,595
-
2024-11-08$1,595
-
2024-11-05historical $1,595
-
2024-11-02$1,595
-
2024-11-01historical $1,595
-
2024-10-28$1,595
-
2024-10-28historical $1,595
-
2024-10-27price $1,595
-
2024-10-17historical $1,650
-
2024-10-15$1,650
-
2024-10-10historical $1,650
-
2024-10-06$1,650
-
2024-09-26historical $1,650
ⓘ Source: listings_history table (triggers on properties + properties_extension) + one-shot
backfill from property_details.listing_events for pre-trigger history.
Tax reassessment forecast GA · Resets to sale price
- Current annual tax
- $47,574 · $3,964/mo
- Projected year-2 tax
- $47,574 · $3,964/mo
- Expected delta
- $0/yr ($0/mo · 0.0%)
ⓘ Screening estimate from a state-policy table — verify with the county assessor before closing.
Climate risk First Street
- Flood 1/10 Low FEMA zone X (unshaded) · 0% chance over 30 yrs
- Wildfire 1/10 Low
- Heat 5/10 Major 7 d/yr ≥104°F today · 18 d/yr by 30 yrs out
- Wind 4/10 Moderate 24% chance of damaging wind over 30 yrs
- Air quality 4/10 Moderate 4 unhealthy d/yr today · 6 by 30 yrs out
Nearby sold comps map
Loading sold comps map…
Walkable amenities ~0.75 mi
Loading nearby amenities…
Taxation est. · year 1
- Rental income
- $413,976
- − Mortgage interest
- −$173,648
- − Property taxes
- −$47,574
- − Insurance
- −$15,500
- − Repairs & maintenance
- −$33,118
- − Management
- −$33,118
- − Depreciation
- −$90,182
- Taxable income
- $20,836
- Est. tax owed @ 24.0%
- −$5,001
- After-tax cash flow
- $63,886/yr
For passive investors: Depreciation is non-cash, so a rental often shows a tax loss while cash-flowing — sheltering income. Rental losses are passive: they offset passive income freely, and up to $25,000/yr can offset ordinary (W-2) income if you actively participate and your MAGI is under $100k (phasing out to $0 by $150k); unused losses carry forward. On sale, claimed depreciation is recaptured at up to 25%, and gains may owe capital-gains tax (a 1031 exchange can defer both). Figures are a year-1 estimate at your 24.0% rate — not tax advice; consult a CPA.
Schools (NCES district)
- District
- Atlanta Public Schools
- NCES district ID
- 1300120
- Math proficiency
- 28% ▼ -6.00%
- Reading proficiency
- 35% ▼ -2.00%
- Median HH income
- $48,306
- Composite
- 27.27/100
- National rank
- #7006
- State rank
- #80 of 174 in GA
Livability — Atlanta
- Score
- 83/100
- State rank
- #6
- US rank
- #919
Category grades
Schools grade is shown separately in the Schools card above.
Census & demographics
- Census place
- Atlanta, GA
- County
- Fulton County · 1,094,430 people
- City population
- 629,525
- Metro
- Atlanta-Sandy Springs-Alpharetta, GA
- Population (ZIP)
- 26,942
- Household income
- $82,779
- Rent vs Own
- Severe rent burden
- 2010.0
Population outlook (Fulton County) Hauer SSP2
- Today (2025)
- 1,203,707 people
- By 2030
- 1,299,706 · +8.0%
- By 2040
- 1,488,256 · +23.6%
- By 2050
- 1,664,580 · +38.3%
- By 2075
- 2,036,072 · +69.2%
- By 2100
- 2,222,402 · +84.6%
Race, ethnicity, and origin ACS 2023
- Neighborhood character
- Diverse neighborhood (Simpson 0.62)
- Race & ethnicity
- Black 46% White 41% Hispanic / Latino 6% Two or more races 5% Asian 4%
- Hispanic origin (detail)
- Mexican 2%
- Common ancestry
- Romanian 2% Lithuanian 1% Slovak 1%
- Foreign-born
- 9% · Canada
- Languages at home
- 88% English-only · Spanish 5% Other Indo-European 1% Chinese 1%
Political lean MEDSL · Fulton
- 2024 margin
- Solid D (+44.9) · D 71.9% · R 27.0% · Other 1.1%
- 2008→2024 swing
- +9.8pp toward D · 2008: 35.0pp · 2024: 44.9pp
- All cycles
- 2024: D+44.9 2020: D+46.4 2016: D+42.1 2012: D+29.6 2008: D+35.0
Not yet ingested
- Civics
- —
Market trends
- HPI YoY
- ▼ -507.19%
- Current HPI
- 240.8692
- Rent YoY
- ▲ 2.84%
- Metro
- Atlanta-Sandy Springs-Alpharetta, GA
- State GDP YoY
- ▲ 2.66%
- F500 in state
- 28
Industry mix (Fortune 500 HQ in GA)
| Industry | F500 HQs | Revenue |
|---|---|---|
| Paper / Packaging | 2 | $29B |
|
||
| Retail | 1 | $160B |
|
||
| Transportation / Logistics | 1 | $91B |
|
||
| Airlines | 1 | $62B |
|
||
| Consumer Goods | 1 | $47B |
|
||
| Utilities | 1 | $25B |
|
||
Price history
-99.1% since first listed58 events — show timeline
- 2026-05-20 Price Changed $1,299 TENANTTURNER2
- 2026-05-17 Listed for Rent $1,549 TENANTTURNER2
- 2026-05-16 Rental Removed $1,349 TENANTTURNER2
- 2026-05-13 Price Changed $1,349 TENANTTURNER2
- 2026-05-13 Price Changed $1,525 TENANTTURNER2
- 2026-05-09 Price Changed $1,399 TENANTTURNER2
- 2026-05-07 Listed $3,100,000 FMLS
- 2026-04-24 Listed for Rent $1,549 TENANTTURNER2
- 2026-04-18 Price Changed $1,425 TENANTTURNER2
- 2026-04-15 Price Changed $1,499 TENANTTURNER2
- 2026-04-14 Listed for Rent $1,525 TENANTTURNER2
- 2026-04-13 Rental Removed $1,599 TENANTTURNER2
- 2026-04-03 Listed for Rent $1,599 TENANTTURNER2
- 2025-06-21 Rental Removed $1,395 TENANTTURNER2
- 2025-06-06 Listed for Rent $1,395 TENANTTURNER2
- 2025-06-06 Rental Removed $1,395 TENANTTURNER2
- 2025-06-02 Listed for Rent $1,395 TENANTTURNER2
- 2025-06-02 Rental Removed $1,395 TENANTTURNER2
- 2025-05-27 Listed for Rent $1,395 TENANTTURNER2
- 2024-12-17 Rental Removed $1,595 RENTALBEAST
- 2024-11-28 Listed for Rent $1,595 RENTALBEAST
- 2024-11-28 Rental Removed $1,595 RENTALBEAST
- 2024-11-27 Listed for Rent $1,595 RENTALBEAST
- 2024-11-17 Rental Removed $1,595 RENTALBEAST
- 2024-11-08 Listed for Rent $1,595 RENTALBEAST
- 2024-11-05 Rental Removed $1,595 RENTALBEAST
- 2024-11-02 Listed for Rent $1,595 RENTALBEAST
- 2024-11-01 Rental Removed $1,595 BUILDIUM
- 2024-10-28 Listed for Rent $1,595 BUILDIUM
- 2024-10-28 Rental Removed $1,595 RENTALBEAST
- 2024-10-27 Price Changed $1,595 RENTALBEAST
- 2024-10-17 Rental Removed $1,650 BUILDIUM
- 2024-10-15 Listed for Rent $1,650 BUILDIUM
- 2024-10-10 Rental Removed $1,650 BUILDIUM
- 2024-10-06 Listed for Rent $1,650 BUILDIUM
- 2024-09-26 Rental Removed $1,650 BUILDIUM
- 2024-09-24 Listed for Rent $1,650 BUILDIUM
- 2024-09-05 Listed for Rent $1,650 RENTALBEAST
- 2024-08-23 Rental Removed $1,650 RENTALBEAST
- 2024-08-23 Listed for Rent $1,650 RENTALBEAST
- 2024-08-22 Rental Removed $1,650 BUILDIUM
- 2024-08-20 Listed for Rent $1,650 BUILDIUM
- 2024-08-20 Rental Removed $1,650 BUILDIUM
- 2024-08-18 Listed for Rent $1,650 BUILDIUM
- 2024-08-18 Rental Removed $1,650 RENTALBEAST
- 2024-08-13 Listed for Rent $1,650 RENTALBEAST
- 2024-08-13 Rental Removed $1,650 RENTALBEAST
- 2024-08-06 Listed for Rent $1,650 RENTALBEAST
- 2024-08-05 Rental Removed $1,650 RENTALBEAST
- 2024-08-01 Listed for Rent $1,650 RENTALBEAST
- 2024-07-31 Rental Removed $1,650 BUILDIUM
- 2024-07-25 Listed for Rent $1,650 BUILDIUM
- 2024-07-25 Rental Removed $1,650 RENTALBEAST
- 2024-07-24 Listed for Rent $1,650 RENTALBEAST
- 2023-09-29 Sold (Public Records) $3,350,000 Public Records
- 2023-09-29 Sold (Public Records) $3,350,000 Public Records
- 1998-06-24 Sold (Public Records) $468,000 Public Records
- 1980-08-11 Sold (Public Records) $150,000 Public Records
Property tax history
+7.6%/yrLatest (2025): $47,574 · +25.3% YoY. Source: county tax records.
Cash-flow waterfall
monthlySold comps — $/sqft
last 12 mo · ≤1 miLoading sold comps…