 🏷️ Likely Rental
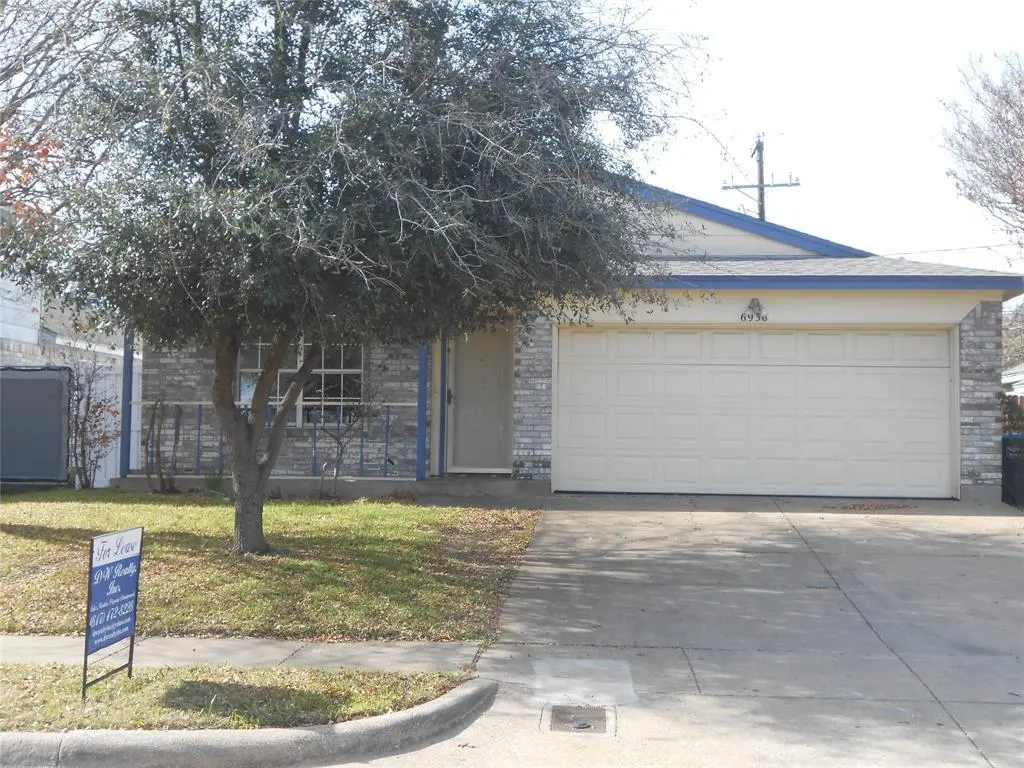
6936 Laurelhill Ct N · Fort Worth, TX
Flood risk 1/10 · Minimal
- FEMA flood zone
- X (unshaded)
- Chance of flooding over 30 yrs
- 0.0%
- Est. flood insurance / yr
- $507 – $1,088
Fire risk 1/10 · Minimal
- Est. fire insurance / yr
- $1,222 – $2,270
Heat risk 7/10 · Major
- Hot days now (above 108°F)
- 7 days/yr
- Hot days in 30 yrs
- 24 days/yr
Wind risk 4/10 · Minor
- Chance of severe wind over 30 yrs
- 24.0%
Air-quality risk 3/10 · Minor
- Unhealthy air days now
- 2 days/yr
- Unhealthy air days in 30 yrs
- 3 days/yr
Risk factors via First Street. Map © Google.
Why this score? — see what drove the D grade
The composite is a weighted blend of 9 inputs, each scored 0–100. Each bar is that input's sub-score; the figure is the points it added to the 100-point composite (weight × sub-score).
- Cash flow +15.0/30.0
- ARV discount +7.5/15.0
- 1% rule +5.0/10.0
- DSCR +5.0/10.0
- Livability +4.0/5.0
- Rent growth +2.5/5.0
- Schools +2.5/10.0
- Condition / age +2.5/5.0
- Appreciation +0.0/10.0
$1,995
🖨 Deal sheet 📄 Offer letter ✓ Due diligence
Listing remarks
Your greatest memories can be found in this three bedroom home which offers three bedrooms, two full baths, living area with a built in fireplace, large eat in kitchen, separate utility room fenced backyard and a two car garage. Located in a nice neighborhood and is in the Crowley School District. Tenant should verify the schools. Close to shopping as well as easy freeway access. Landlord says no pets of any kind .
Key facts
- Large eat in kitchen
- Built in fireplace
- Easy freeway access
Tags
Property features AI
Finance
- Other: Lot is less than 0.5 acre (approx. 0.115 acre); Subdivision: South Meadow Add; Possession: 30-60 days
- HOA & community: No association
Exterior
- Parking: Attached 2-car garage with garage door opener; 2 covered/carport spaces; Concrete driveway; Garage includes storage; Garage dimensions approximately 18' wide by 20' long
- Security: Smoke detector(s)
- Utilities: City water; City sewer; Cable available; Not in a municipal utility district
- Home design: Single family residence; One story; Residential property; No attached units; Restrictions: No pets, No smoking, No sublease
- Construction: Brick construction; Composition roof; Slab foundation; Built in 1989
- Exterior features: Covered porch(es); Back yard with wood fencing
Interior
- Kitchen: Electric range; Dishwasher; Disposal; Built-in cabinets; Eat-in kitchen
- Bedrooms: 3 bedrooms (all on the main level); Primary bedroom with walk-in closet
- Flooring: Laminate flooring
- Bathrooms: 2 full bathrooms
- Interior features: Cable TV available; One living area; One dining area; 6 total rooms
- Laundry & utility: Main-level laundry with built-in cabinets
Neighborhood map
What this means for you Summary
Snapshot
- This is a 3-bed/2.0-bath single-family listed at $2k.
Deal economics
- At list price, monthly cash flow is $1k ($16k/yr) — positive.
- The deal already cash-flows at list — no discount required.
- Meets the 1% rule at list price ($2k rent vs $2k).
- Cap rate 831.0% vs local median 3.9% in Fort Worth — top-decile yield for the area; either an underpriced asset or a hidden risk that comps aren't pricing in. Stress-test before assuming the spread holds.
Location & tenants
- Location reads 80/100 on livability (#49 in TX, #1,954 nationally) — a professional / high-income tenant draw. Strengths: amenities A+, cost of living A+, housing A+; Watch: crime F.
- Crowley ISD (urban): math 23% / reading 32% proficiency, ranked #643 of 826 in TX (top 78%) — low school quality limits family demand, transient renter base, plan for 1-2y turnover.
- Zoned schools: Meadowcreek El (math 21% / reading 23%, grade F, #3,333 of 4,322 statewide, top 80%, 534 students, 86% FRL) — zoned schools average 86% FRL vs 52% district-wide (35 pts higher); higher-poverty schools than district average — tighter screening recommended.
- Market conditions: Rents soft (-0.2%/yr); 205 active listings in the ZIP; 40 comparable units currently listed for rent nearby; rentals at typical pace (median 15d on market — plan ~3-4 weeks tenant-placement turnaround); solid renter incomes; 18,938 units permitted in Tarrant County in 2024 (8,336 in 5+ unit buildings).
Forward outlook
- Local home prices are declining (-3.0%/yr); year-one equity from $14 of loan paydown is wiped out by about $60 of value loss. Plan a longer hold.
- Tarrant County population projected at +41% by 2050 — long-run rental-demand tailwind backs the buy-and-hold thesis.
- At projected returns (-3.0% appreciation + 0.0% rent growth), your $559 cash investment doubles in ~1 year — after that, you're playing with house money.
Negotiation context
- Only 4 days on market — expect competitive offers; lowballing is unlikely to land.
- 2 sale attempts since 3y ago with the ask held roughly flat each time — persistent listings suggest the price (not the market) is what's stuck; bring a comps-based counter.
Risks & watch-outs
- Climate carrying-cost: extreme-heat days projected 7→24/yr by 2055 (HVAC capex compounding) — expect insurance premiums to compound above CPI over the hold.
Questions for the listing agent
- Is there a deadline driving the sale (1031 exchange, divorce, estate, relocation)? That informs how much negotiation room exists.
- Schools are D-rated, which usually means shorter tenancies and higher turnover. Who's the typical renter profile here, and what's been the actual vacancy rate?
- Crime grade is F in this area — have there been break-ins, vandalism, or insurance claims at this property in the last 3 years? What carrier currently insures it and at what premium?
- The area grade is low — what's the realistic commute time and amenity access for the typical tenant pool here? Any planned neighborhood developments (good or bad) we should know about?
- What's the average days-on-market for RENTAL listings here right now (not sales)? A rising rental-DOM trend means longer vacancies and softer asking-rent achievability than the comps imply.
- What's the recent tenant-quality profile in this submarket — average credit score on applications, eviction rate, late-payment / NSF rate, and stable-employment percentage? A property-management company in the area should have these aggregated.
- How much new for-sale + rental construction is in the pipeline within 1–3 miles? Heavy new supply typically softens prices + rents 12–24 months out; constrained supply supports both.
Investment metrics
- 1% rule
- 87.87% ✓
- Cap rate
- 830.96%
- Cash-on-cash
- 2945.25%
- DSCR
- 132.05
- GRM
- 0.1
CMA / ARV
- ARV (on-the-fly)
- $228,044
- Comps found
- 12
Show comp detail 12 sales within ~0.75 mi
| Address | Dist | Beds/Ba | Sqft | Sold | Price | $/sf | Match |
|---|---|---|---|---|---|---|---|
| 6824 Brookhaven Trl | 0.15mi | 3/2.0 | 1,166 (-4%) | 5mo | $219,000 | $188 | 82 |
| 7008 Nohl Ranch Rd | 0.10mi | 3/2.0 | 1,268 (+4%) | 8mo | $249,500 | $197 | 81 |
| 7212 Ashbourne Way | 0.26mi | 3/2.0 | 1,120 (-8%) | 2mo | $220,000 | $196 | 74 |
| 7412 Ranger Way | 0.41mi | 3/2.0 | 1,245 (+3%) | 4mo | $250,000 | $201 | 73 |
| 2532 Winding Rd | 0.24mi | 3/2.0 | 1,347 (+11%) | 1mo | $224,000 | $166 | 69 |
| 6436 Brookhaven Trl | 0.55mi | 2/2.0 (-1) | 1,232 (+2%) | 3mo | $199,900 | $162 | 64 |
| 6985 Avington Way | 0.29mi | 3/2.0 | 1,365 (+12%) | 2mo | $237,500 | $174 | 64 |
| 2713 Ridge Rd N | 0.22mi | 2/2.0 (-1) | 1,057 (-13%) | 3mo | $200,000 | $189 | 61 |
| 2509 Countryside Ln | 0.41mi | 3/2.0 | 1,050 (-13%) | 3mo | $200,000 | $190 | 56 |
| 2807 Woodmont Trl | 0.69mi | 2/2.0 (-1) | 1,176 (-3%) | 6mo | $184,000 | $156 | 53 |
| 3254 Amber Ct | 0.49mi | 4/2.0 (+1) | 1,381 (+14%) | 6mo | $235,000 | $170 | 44 |
| 3120 Woodlark Dr | 0.69mi | 3/2.5 | 1,384 (+14%) | 3mo | $249,900 | $181 | 40 |
Match score weights: distance 35% · size 25% · config 20% · recency 20%. Top-matched comps best support the ARV.
Projected returns pro-forma
-3.0% appreciation · 0.0% rent growth · sell at horizon
- IRR
- —
- Equity multiple
- 147.59×
- Total profit
- $81,887
- Equity at exit
- $297
- IRR
- —
- Equity multiple
- 294.59×
- Total profit
- $163,999
- Equity at exit
- $172
Cash invested: $559 (down + closing). Projections, not guarantees.
Landlord ↔ Tenant lean methodology
- Overall (STATE)
- 87 Strongly Landlord-Friendly
- State Texas
- 87 Strongly Landlord-Friendly · R+5
- County
- — inherits STATE
- City
- — inherits STATE
ZIP-level market 76133
- Rents YoY
- -0.2%
- Active inventory
- 205
- Price-to-rent
- 0.1×
Monthly cashflow live
- Estimated rent
- $1,753 high interval (Pro) →
- Mortgage (P&I)
- −$10
- Tax est. 1.5%
- −$2 /mo · $30/yr
- Insurance
- −$1
- HOA
- −$0
- Vacancy / Maint / Mgmt
- −$368
- Net cashflow
- $1,371
Break-even live
UW: 25.0% down · 7.5% · 30yr · 1.5% tax · 5.0% vac · 8.0% maint · 8.0% mgmt
Financing live
Cash to close
- Down payment
- $499
- Closing costs
- $60
- Reserves months
- —
- Total cash needed
- —
Loan-product check · same deal, 3 products live
Conventional
25% down · 7.5% · 30yr
- Down + closing
- —
- Monthly P&I
- —
- Monthly cashflow
- —
- DSCR
- —
- Eligible?
- —
Personal DTI + credit; lowest rate.
DSCR
20% down · 8.5% · 30yr
- Down + closing
- —
- Monthly P&I
- —
- Monthly cashflow
- —
- DSCR
- —
- Eligible?
- —
No personal income docs; deal must DSCR.
Hard money
10% down · 12.0% · 12mo
- Down + closing
- —
- Monthly P&I
- —
- Monthly cashflow
- —
- DSCR
- —
- Eligible?
- —
Short-term bridge; refi at stabilization.
Rent comps 40 comps
| Address | Beds | Baths | Sqft | Rent | $/sqft | DOM | Units | Dist |
|---|---|---|---|---|---|---|---|---|
| 6936 Laurelhill Ct N Fort Worth, TX | 3.0 | 2.0 | 1213 | $1,995 | $1.64 | 17d | 1 | 0.02mi |
| 2370 Stagecoach St Fort Worth, TX | 3.0 | 2.0 | 1214 | $1,895 | $1.56 | 5d | 1 | 0.17mi |
| 7217 Ashbourne Way Fort Worth, TX | 3.0 | 2.0 | 1148 | $1,875 | $1.63 | 12d | 1 | 0.27mi |
| 6804 S Creek Dr Fort Worth, TX | 2.0 | 2.0 | 1112 | $1,500 | $1.35 | 24d | 1 | 0.29mi |
| 7320 Laurelhill Ct S Fort Worth, TX | 3.0 | 2.0 | 1480 | $1,905 | $1.29 | 1d | 1 | 0.31mi |
| 6838 S Creek Dr Fort Worth, TX | 3.0 | 2.0 | 1400 | $1,395 | $1.00 | 2d | 1 | 0.32mi |
| 7404 Glen Haven Dr Fort Worth, TX | 3.0 | 2.0 | 1350 | $1,995 | $1.48 | 14d | 1 | 0.34mi |
| 3029 Meadowmoor St Fort Worth, TX | 3.0 | 2.0 | 1376 | $1,809 | $1.31 | 4d | 1 | 0.34mi |
| 2618 Butterfield Dr Fort Worth, TX | 3.0 | 2.0 | 1312 | $1,810 | $1.38 | 43d | 1 | 0.35mi |
| 6708 S Creek Dr Fort Worth, TX | 2.0 | 1.0 | 1048 | $1,250 | $1.19 | 24d | 1 | 0.35mi |
| 6709 Ridgecrest Ct Fort Worth, TX | 2.0 | 1.0 | 1004 | $1,495 | $1.49 | 43d | 1 | 0.36mi |
| 6706 Crestmont Ct Fort Worth, TX | 3.0 | 2.0 | 1200 | $1,495 | $1.25 | 16d | 1 | 0.37mi |
| 6706 Crestmont Ct Fort Worth, TX | 3.0 | 2.0 | 1200 | $1,495 | $1.25 | 17d | 1 | 0.37mi |
| 6714 Glenbrook Ln Fort Worth, TX | 2.0 | 2.0 | 1000 | $1,550 | $1.55 | 43d | 1 | 0.39mi |
| 6719 Loma Vista Dr Fort Worth, TX | 2.0 | 1.0 | 1000 | $1,375 | $1.38 | 24d | 1 | 0.39mi |
| 7420 Meadow Creek Dr Fort Worth, TX | 3.0 | 2.0 | 1381 | $1,800 | $1.30 | 6d | 1 | 0.40mi |
| 7421 Ridge Rd W Fort Worth, TX | 3.0 | 2.0 | 1480 | $1,839 | $1.24 | 3d | 1 | 0.42mi |
| 6620 S Creek Dr Fort Worth, TX | 2.0 | 2.0 | 1095 | $1,450 | $1.32 | 6d | 1 | 0.43mi |
| 6751 Westcreek Dr Unit 6808 Fort Worth, TX | 2.0 | 2.0 | 884 | $1,150 | $1.30 | 3d | 1 | 0.44mi |
| 6508 Brookhaven Trl Fort Worth, TX | 3.0 | 2.0 | 1182 | $1,789 | $1.51 | 3d | 1 | 0.50mi |
| 6776 Westcreek Dr Unit 2121 Fort Worth, TX | 2.0 | 2.0 | 876 | $1,002 | $1.14 | 3d | 1 | 0.53mi |
| 6776 Westcreek Dr Unit 6833 Fort Worth, TX | 2.0 | 2.0 | 876 | $1,110 | $1.27 | 12d | 1 | 0.53mi |
| 6776 Westcreek Dr Unit 512 Fort Worth, TX | 2.0 | 2.0 | 876 | $1,045 | $1.19 | 4d | 1 | 0.53mi |
| 3324 Green Ridge St Fort Worth, TX | 3.0 | 2.0 | 1250 | $1,695 | $1.36 | 43d | 1 | 0.55mi |
| 6440 Woodbeach Dr Unit 6442 Fort Worth, TX | 2.0 | 2.0 | 894 | $1,400 | $1.57 | 14d | 1 | 0.59mi |
| 6776 Westcreek Dr Fort Worth, TX | 2.0 | 2.0 | 900 | $1,125 | $1.25 | 43d | 1 | 0.60mi |
| 7901 Chandra Ln Unit 611 Fort Worth, TX | 3.0 | 2.0 | 1156 | $1,131 | $0.98 | 2d | 1 | 0.61mi |
| 7901 Chandra Ln Unit 7928 Fort Worth, TX | 2.0 | 2.0 | 959 | $1,212 | $1.26 | 2d | 1 | 0.61mi |
| 7901 Chandra Ln Unit 511 Fort Worth, TX | 2.0 | 2.0 | 959 | $939 | $0.98 | 15d | 1 | 0.61mi |
| 2201 Sycamore School Rd Fort Worth, TX | 3.0 | 2.0 | 1200 | $1,750 | $1.46 | 43d | 1 | 0.63mi |
| 7617 Hollow Forest Dr Fort Worth, TX | 3.0 | 2.0 | 1400 | $1,900 | $1.36 | 3d | 1 | 0.66mi |
| 7616 Rainbow Creek Dr Fort Worth, TX | 3.0 | 2.0 | 1400 | $1,855 | $1.32 | 43d | 1 | 0.67mi |
| 6920 Misty Meadow Dr S Fort Worth, TX | 3.0 | 2.0 | 1443 | $1,775 | $1.23 | 43d | 1 | 0.73mi |
| 2201 Sycamore School Rd Unit 611 Fort Worth, TX | 3.0 | 2.0 | 1318 | $1,322 | $1.00 | 43d | 1 | 0.75mi |
| 2201 Sycamore School Rd Unit 2121 Fort Worth, TX | 2.0 | 2.0 | 1200 | $1,102 | $0.92 | 2d | 1 | 0.75mi |
| 2201 Sycamore School Rd Unit 3121 Fort Worth, TX | 3.0 | 2.0 | 1318 | $1,279 | $0.97 | 2d | 1 | 0.75mi |
| 2201 Sycamore School Rd Unit 2258 Fort Worth, TX | 2.0 | 2.0 | 1200 | $1,135 | $0.95 | 43d | 1 | 0.75mi |
| 2911 Forest Creek Dr Fort Worth, TX | 3.0 | 2.0 | 1188 | $1,800 | $1.52 | 12d | 1 | 0.75mi |
| 7664 Hollow Point Dr Fort Worth, TX | 3.0 | 2.0 | 1400 | $1,895 | $1.35 | 24d | 1 | 0.78mi |
| 2805 Galemeadow Dr Fort Worth, TX | 3.0 | 1.5 | 1285 | $2,031 | $1.58 | 4d | 1 | 0.81mi |
Listing history 7 events
-
2026-06-01days on market $1,995 Active 4 DOM
-
2026-05-31days on market $1,995 Active 3 DOM
-
2026-05-28$1,995 Active
-
2024-02-09historical $2,195
-
2023-12-19price $2,195
-
2023-12-12$2,200
-
1994-04-07soldstatus
ⓘ Source: listings_history table (triggers on properties + properties_extension) + one-shot
backfill from property_details.listing_events for pre-trigger history.
Climate risk First Street
- Flood 1/10 Low FEMA zone X (unshaded) · 0% chance over 30 yrs
- Wildfire 1/10 Low
- Heat 7/10 Severe 7 d/yr ≥108°F today · 24 d/yr by 30 yrs out
- Wind 4/10 Moderate 24% chance of damaging wind over 30 yrs
- Air quality 3/10 Moderate 2 unhealthy d/yr today · 3 by 30 yrs out
Nearby sold comps map
Loading sold comps map…
Walkable amenities ~0.75 mi
Loading nearby amenities…
Taxation est. · year 1
- Rental income
- $21,035
- − Mortgage interest
- −$112
- − Property taxes
- −$30
- − Insurance
- −$10
- − Repairs & maintenance
- −$1,683
- − Management
- −$1,683
- − Depreciation
- −$58
- Taxable income
- $17,460
- Est. tax owed @ 24.0%
- −$4,190
- After-tax cash flow
- $12,262/yr
For passive investors: Depreciation is non-cash, so a rental often shows a tax loss while cash-flowing — sheltering income. Rental losses are passive: they offset passive income freely, and up to $25,000/yr can offset ordinary (W-2) income if you actively participate and your MAGI is under $100k (phasing out to $0 by $150k); unused losses carry forward. On sale, claimed depreciation is recaptured at up to 25%, and gains may owe capital-gains tax (a 1031 exchange can defer both). Figures are a year-1 estimate at your 24.0% rate — not tax advice; consult a CPA.
Schools (NCES district)
- District
- Crowley ISD
- NCES district ID
- 4815910
- Math proficiency
- 23% ▼ -15.00%
- Reading proficiency
- 32% ▼ -6.00%
- Median HH income
- $59,810
- Composite
- 25.04/100
- National rank
- #7549
- State rank
- #643 of 826 in TX
Livability — Fort Worth
- Score
- 80/100
- State rank
- #49
- US rank
- #1954
Category grades
Schools grade is shown separately in the Schools card above.
Census & demographics
- Census place
- Fort Worth, TX
- County
- Tarrant County · 2,033,669 people
- City population
- 911,619
- Metro
- Dallas-Fort Worth-Arlington, TX
- Population (ZIP)
- 53,958
- Household income
- $75,523
- Rent vs Own
- Severe rent burden
- 2000.0
Population outlook (Tarrant County) Hauer SSP2
- Today (2025)
- 2,380,417 people
- By 2030
- 2,578,900 · +8.3%
- By 2040
- 2,974,995 · +25.0%
- By 2050
- 3,350,489 · +40.8%
- By 2075
- 4,216,909 · +77.2%
- By 2100
- 4,741,527 · +99.2%
Race, ethnicity, and origin ACS 2023
- Neighborhood character
- Diverse neighborhood (Simpson 0.69)
- Race & ethnicity
- Hispanic / Latino 39% White 34% Black 21% Two or more races 19% Asian 3% Native American 1%
- Hispanic origin (detail)
- Mexican 34%
- Common ancestry
- Italian 3% Slovak 2% Lithuanian 1%
- Foreign-born
- 15% · Canada, China, Philippines
- Languages at home
- 70% English-only · Spanish 25% Other Asian/Pacific 1% French/Haitian/Cajun 1%
Political lean MEDSL · Tarrant
- 2024 margin
- Lean R (+5.1) · D 46.7% · R 51.9% · Other 1.4%
- 2008→2024 swing
- +6.6pp toward D · 2008: -11.7pp · 2024: -5.1pp
- All cycles
- 2024: R+5.1 2020: D+0.2 2016: R+8.7 2012: R+15.7 2008: R+11.7
Not yet ingested
- Civics
- —
Market trends
- HPI YoY
- ▼ -196.95%
- Current HPI
- 293.8679
- Rent YoY
- ▼ -0.20%
- Metro
- Dallas-Fort Worth-Arlington, TX
- State GDP YoY
- ▲ 3.95%
- F500 in state
- 110
Industry mix (Fortune 500 HQ in TX)
| Industry | F500 HQs | Revenue |
|---|---|---|
| Energy | 16 | $1,198B |
|
||
| Technology | 5 | $198B |
|
||
| Engineering / Construction | 4 | $72B |
|
||
| Energy Services | 3 | $60B |
|
||
| Utilities | 3 | $41B |
|
||
| Healthcare | 2 | $330B |
|
||
Price history
-9.3% since first listed5 events — show timeline
- 2026-05-28 Listed $1,995 NTREIS
- 2024-02-09 Rental Removed $2,195 NTREIS
- 2023-12-19 Price Changed $2,195 NTREIS
- 2023-12-12 Listed for Rent $2,200 NTREIS
- 1994-04-07 Sold (Public Records) — Public Records
Property tax history
+5.8%/yrLatest (2025): $5,435 · -0.9% YoY. Source: county tax records.
Cash-flow waterfall
monthlySold comps — $/sqft
last 12 mo · ≤1 miLoading sold comps…