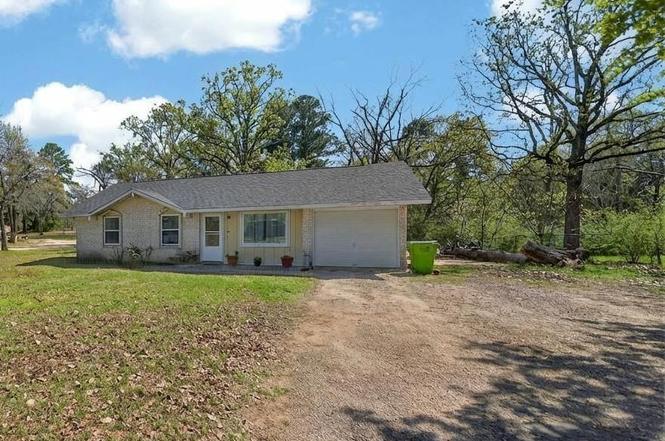
3165 Jackson Ave · New Chapel Hill, TX
Flood risk 1/10 · Minimal
- FEMA flood zone
- X (unshaded)
- Chance of flooding over 30 yrs
- 0.0%
- Est. flood insurance / yr
- $507 – $1,088
Fire risk 6/10 · Moderate
- Est. fire insurance / yr
- $1,222 – $2,270
Heat risk 6/10 · Moderate
- Hot days now (above 109°F)
- 7 days/yr
- Hot days in 30 yrs
- 25 days/yr
Wind risk 6/10 · Moderate
- Chance of severe wind over 30 yrs
- 59.0%
Air-quality risk 2/10 · Minimal
- Unhealthy air days now
- 0 days/yr
- Unhealthy air days in 30 yrs
- 1 days/yr
Risk factors via First Street. Map © Google.
Why this score? — see what drove the C grade
The composite is a weighted blend of 9 inputs, each scored 0–100. Each bar is that input's sub-score; the figure is the points it added to the 100-point composite (weight × sub-score).
- Cash flow +22.6/30.0
- ARV discount +7.5/15.0
- DSCR +7.3/10.0
- Appreciation +5.5/10.0
- 1% rule +5.3/10.0
- Livability +2.9/5.0
- Rent growth +2.5/5.0
- Schools +2.5/10.0
- Condition / age +2.5/5.0
$145,000
🖨 Deal sheet (PDF) 📄 Offer letter ✓ Due diligence
Listing remarks
Charming Home with Great Potential – Don’t Miss This Opportunity!!! Great opportunity for first time home buyers looking to enter the market and build equity; or investors looking for a value-add property. This home offers a functional layout and the potential for updates to increase value. With the right improvements, this property could make an excellent rental, flip, or long-term hold. The home features comfortable and cozy living spaces, a practical kitchen, and a yard with room for outdoor enjoyment. With a little TLC and personal updates, this home has the potential to truly shine while allowing buyers to add their own style over time. Whether you're a first-time buyer, so
Key facts
- Garage
- Built 1975
- Listed 93 days
Property features AI
Exterior
- Parking: 1-car garage with garage door opener
- Security: Smoke detector(s)
- Utilities: Cable available; Septic tank
- Home design: Single family residence (detached); One story
- Construction: Brick and wood siding exterior; Composition roof
- Exterior features: Patio; Storm door(s)
Interior
- Kitchen: Microwave
- Flooring: Laminate flooring
- Bathrooms: 1 full bathroom; 1 half bathroom
- Heating & cooling: Central heating (natural gas); Central air; Ceiling fan(s)
- Interior features: Microwave; Gas water heater; Smoke detector(s)
Neighborhood map
What this means for you Summary
Snapshot
- This is a 3-bed/1.0-bath single-family listed at $145k.
Deal economics
- At list price, monthly cash flow is $248 ($3k/yr) — positive.
- The deal already cash-flows at list — no discount required.
- Meets the 1% rule at list price ($2k rent vs $145k).
- Recommended offer: $132k (9.0% below list) — sets the bar for market timing.
Location & tenants
- Location reads 57/100 on livability (#1,275 in TX) — a working-class tenant base; expect higher turnover. Strengths: cost of living A+; Watch: employment D, crime D-, amenities F.
- Chapel Hill ISD (rural): math 25% / reading 33% proficiency, ranked #650 of 826 in TX (top 79%) — low school quality limits family demand, transient renter base, plan for 1-2y turnover; 64% free/reduced lunch — lower-income household profile, screen leases tightly.
- Zoned schools: Jackson El (math 17% / reading 22%, grade F, #3,583 of 4,322 statewide, top 86%, 417 students, 92% FRL); Chapel Hill J H (math 27% / reading 35%, grade F, #1,015 of 1,662 statewide, top 62%, 502 students, 77% FRL); Chapel Hill H S (math 21% / reading 35%, grade F, #1,170 of 1,632 statewide, top 72%, 1,063 students, 75% FRL) — zoned schools average 81% FRL vs 64% district-wide (18 pts higher); higher-poverty schools than district average — tighter screening recommended.
- Market conditions: 29 active listings in the ZIP; 1 comparable units currently listed for rent nearby; 595 units permitted in Smith County in 2024 (45 in 5+ unit buildings).
Forward outlook
- In year one you build about $2k of equity ($1k loan paydown + $1k appreciation (1.0% local appreciation)).
- Smith County population projected at +24% by 2050 — long-run rental-demand tailwind backs the buy-and-hold thesis.
- At projected returns (1.0% appreciation + 3.0% rent growth), your $41k cash investment doubles in ~7 years — after that, you're playing with house money.
Negotiation context
- It's been on market 93 days — a 9% lower offer ($132k) is reasonable based on typical stale-listing flexibility.
- 2 sale attempts; this cycle's ask has dropped $20k (12%) from the opening price — seller is motivated, your offer sets the floor, not the list.
Risks & watch-outs
- Climate carrying-cost: major wind risk, 59% chance of damaging wind over 30y; major wildfire risk; extreme-heat days projected 7→25/yr by 2055 (HVAC capex compounding) — expect insurance premiums to compound above CPI over the hold.
Questions for the listing agent
- It's been on market 93 days. Have you received any prior offers? Is the seller open to a 9% concession, seller financing, or rate buy-down credit?
- Built in 1975 — when were the roof, HVAC, electrical panel, plumbing, and water heater last replaced?
- Why hasn't it sold? Are there any deal-killer items the seller is aware of (foundation, flood, title, zoning, code violations)?
- Is there a deadline driving the sale (1031 exchange, divorce, estate, relocation)? That informs how much negotiation room exists.
- Schools are F-rated, which usually means shorter tenancies and higher turnover. Who's the typical renter profile here, and what's been the actual vacancy rate?
- Crime grade is D in this area — have there been break-ins, vandalism, or insurance claims at this property in the last 3 years? What carrier currently insures it and at what premium?
- What's the average days-on-market for RENTAL listings here right now (not sales)? A rising rental-DOM trend means longer vacancies and softer asking-rent achievability than the comps imply.
- What's the recent tenant-quality profile in this submarket — average credit score on applications, eviction rate, late-payment / NSF rate, and stable-employment percentage? A property-management company in the area should have these aggregated.
- How much new for-sale + rental construction is in the pipeline within 1–3 miles? Heavy new supply typically softens prices + rents 12–24 months out; constrained supply supports both.
Investment metrics
- 1% rule
- 1.03% ✓
- Cap rate
- 8.34%
- Cash-on-cash
- 7.32%
- DSCR
- 1.33
- GRM
- 8.1
CMA / ARV
No comps found within radius.
Projected returns pro-forma
0.98% appreciation · 3.0% rent growth · sell at horizon
- IRR
- 8.9%
- Equity multiple
- 1.45×
- Total profit
- $18,321
- Equity at exit
- $49,351
- IRR
- 12.9%
- Equity multiple
- 2.56×
- Total profit
- $63,242
- Equity at exit
- $65,469
Cash invested: $40,600 (down + closing). Projections, not guarantees.
Landlord ↔ Tenant lean methodology
- Overall (STATE)
- 87 Strongly Landlord-Friendly
- State Texas
- 87 Strongly Landlord-Friendly · R+5
- County
- — inherits STATE
- City
- — inherits STATE
ZIP-level market 75705
- Home prices YoY
- 0.7%
- Active inventory
- 29
- Price-to-rent
- 8.1×
Monthly cashflow live
- Estimated rent
- $1,500 medium interval (Pro) →
- Mortgage (P&I)
- −$760
- Tax from tax record
- −$117 /mo · $1,400/yr
- Insurance
- −$60
- HOA
- −$0
- Vacancy / Maint / Mgmt
- −$315
- Net cashflow
- $248
Break-even live
Sensitivity live
| Price | -10% $330 | -5% $289 | +0% $248 | +5% $207 | +10% $165 |
|---|---|---|---|---|---|
| Rent | -10% $129 | -5% $188 | +0% $248 | +5% $307 | +10% $366 |
| Rate | -1.0pp $321 | -0.5pp $284 | base $248 | +0.5pp $210 | +1.0pp $172 |
UW: 25.0% down · 7.5% · 30yr · 1.5% tax · 5.0% vac · 8.0% maint · 8.0% mgmt
Financing live
Cash to close
- Down payment
- $36,250
- Closing costs
- $4,350
- Reserves months
- —
- Total cash needed
- —
Loan-product check · same deal, 3 products live
Conventional
25% down · 7.5% · 30yr
- Down + closing
- —
- Monthly P&I
- —
- Monthly cashflow
- —
- DSCR
- —
- Eligible?
- —
Personal DTI + credit; lowest rate.
DSCR
20% down · 8.5% · 30yr
- Down + closing
- —
- Monthly P&I
- —
- Monthly cashflow
- —
- DSCR
- —
- Eligible?
- —
No personal income docs; deal must DSCR.
Hard money
10% down · 12.0% · 12mo
- Down + closing
- —
- Monthly P&I
- —
- Monthly cashflow
- —
- DSCR
- —
- Eligible?
- —
Short-term bridge; refi at stabilization.
Rent comps 1 comps
| Address | Beds | Baths | Sqft | Rent | $/sqft | DOM | Units | Dist |
|---|---|---|---|---|---|---|---|---|
| 3153 Roosevelt Dr Tyler, TX | 3.0 | 1.0 | 1200 | $1,500 | $1.25 | 15d | 1 | 0.11mi |
Listing history 26 events
-
2026-06-21days on market $145,000 Active 93 DOM
-
2026-06-19days on market $145,000 Active 91 DOM
-
2026-06-18days on market $145,000 Active 90 DOM
-
2026-06-17days on market $145,000 Active 89 DOM
-
2026-06-16price $145,000 Active 88 DOM
-
2026-06-16days on market $155,000 Active 88 DOM
-
2026-06-15days on market $155,000 Active 87 DOM
-
2026-06-14days on market $155,000 Active 85 DOM
-
2026-06-13days on market $155,000 Active 84 DOM
-
2026-06-10days on market $155,000 Active 82 DOM
-
2026-06-09days on market $155,000 Active 81 DOM
-
2026-06-08days on market $155,000 Active 80 DOM
-
2026-06-07days on market $155,000 Active 79 DOM
-
2026-06-02days on market $155,000 Active 74 DOM
-
2026-06-01days on market $155,000 Active 73 DOM
-
2026-05-31days on market $155,000 Active 72 DOM
-
2026-05-30days on market $155,000 Active 71 DOM
-
2026-05-09status Active
-
2026-05-03status Pending
-
2026-04-25price $155,000
-
2026-03-14$165,500 Active
-
2018-10-01soldstatus
-
2016-12-14soldstatus
-
2007-01-04soldstatus
-
2005-11-02soldstatus
-
1987-10-21soldstatus
ⓘ Source: listings_history table (triggers on properties + properties_extension) + one-shot
backfill from property_details.listing_events for pre-trigger history.
Tax reassessment forecast TX · Resets to sale price
- Current annual tax
- $1,400 · $117/mo
- Projected year-2 tax
- $2,654 · $221/mo
- Expected delta
- +$1,254/yr (+$104/mo · 89.6%)
ⓘ Screening estimate from a state-policy table — verify with the county assessor before closing.
Climate risk First Street
- Flood 1/10 Low FEMA zone X (unshaded) · 0% chance over 30 yrs
- Wildfire 6/10 Major
- Heat 6/10 Major 7 d/yr ≥109°F today · 25 d/yr by 30 yrs out
- Wind 6/10 Major 59% chance of damaging wind over 30 yrs
- Air quality 2/10 Low 0 unhealthy d/yr today · 1 by 30 yrs out
Nearby sold comps map
Loading sold comps map…
Walkable amenities ~0.75 mi
Loading nearby amenities…
Taxation est. · year 1
- Rental income
- $18,000
- − Mortgage interest
- −$8,122
- − Property taxes
- −$1,400
- − Insurance
- −$725
- − Repairs & maintenance
- −$1,440
- − Management
- −$1,440
- − Depreciation
- −$4,218
- Taxable income
- $655
- Est. tax owed @ 24.0%
- −$157
- After-tax cash flow
- $2,813/yr
For passive investors: Depreciation is non-cash, so a rental often shows a tax loss while cash-flowing — sheltering income. Rental losses are passive: they offset passive income freely, and up to $25,000/yr can offset ordinary (W-2) income if you actively participate and your MAGI is under $100k (phasing out to $0 by $150k); unused losses carry forward. On sale, claimed depreciation is recaptured at up to 25%, and gains may owe capital-gains tax (a 1031 exchange can defer both). Figures are a year-1 estimate at your 24.0% rate — not tax advice; consult a CPA.
Schools (NCES district)
- District
- Chapel Hill ISD
- NCES district ID
- 4813650
- Math proficiency
- 25% ▼ -10.00%
- Reading proficiency
- 33% ▼ -5.00%
- Median HH income
- $43,891
- Composite
- 24.76/100
- National rank
- #7603
- State rank
- #650 of 826 in TX
Livability — New Chapel Hill
- Score
- 57/100
- State rank
- #1275
- US rank
- #22160
Category grades
Schools grade is shown separately in the Schools card above.
Census & demographics
- City population
- 16,355
- Population (ZIP)
- 1,471
Population outlook (Smith County) Hauer SSP2
- Today (2025)
- 248,890 people
- By 2030
- 261,665 · +5.1%
- By 2040
- 286,114 · +15.0%
- By 2050
- 308,006 · +23.8%
- By 2075
- 354,171 · +42.3%
- By 2100
- 372,828 · +49.8%
Race, ethnicity, and origin ACS 2023
- Neighborhood character
- Majority White (60%)
- Race & ethnicity
- White 60% Black 31% Hispanic / Latino 7% Two or more races 5%
- Hispanic origin (detail)
- Mexican 6%
- Common ancestry
- Scottish 6% Iranian 1% Scotch-Irish 1%
- Languages at home
- 99% English-only · Spanish 1%
Political lean MEDSL · Smith
- 2024 margin
- Solid R (+45.1) · D 27.0% · R 72.1%
- 2008→2024 swing
- -5.6pp toward R · 2008: -39.5pp · 2024: -45.1pp
- All cycles
- 2024: R+45.1 2020: R+39.4 2016: R+43.9 2012: R+46.9 2008: R+39.5
Not yet ingested
- Civics
- —
Market trends
- HPI YoY
- ▲ 0.98%
- Current HPI
- 144.823
- Rent YoY
- —
- Metro
- —
- State GDP YoY
- ▲ 3.95%
- F500 in state
- 110
Industry mix (Fortune 500 HQ in TX)
| Industry | F500 HQs | Revenue |
|---|---|---|
| Energy | 16 | $1,198B |
|
||
| Technology | 5 | $198B |
|
||
| Engineering / Construction | 4 | $72B |
|
||
| Energy Services | 3 | $60B |
|
||
| Utilities | 3 | $41B |
|
||
| Healthcare | 2 | $330B |
|
||
Price history
-6.3% since first listed9 events — show timeline
- 2026-05-09 Relisted — GTAR
- 2026-05-03 Pending — GTAR
- 2026-04-25 Price Changed $155,000 GTAR
- 2026-03-14 Listed $165,500 GTAR
- 2018-10-01 Sold (Public Records) — Public Records
- 2016-12-14 Sold (Public Records) — Public Records
- 2007-01-04 Sold (Public Records) — Public Records
- 2005-11-02 Sold (Public Records) — Public Records
- 1987-10-21 Sold (Public Records) — Public Records
Property tax history
+5.2%/yrLatest (2024): $1,400 · +11.2% YoY. Source: county tax records.
Cash-flow waterfall
monthlySold comps — $/sqft
last 12 mo · ≤1 miLoading sold comps…