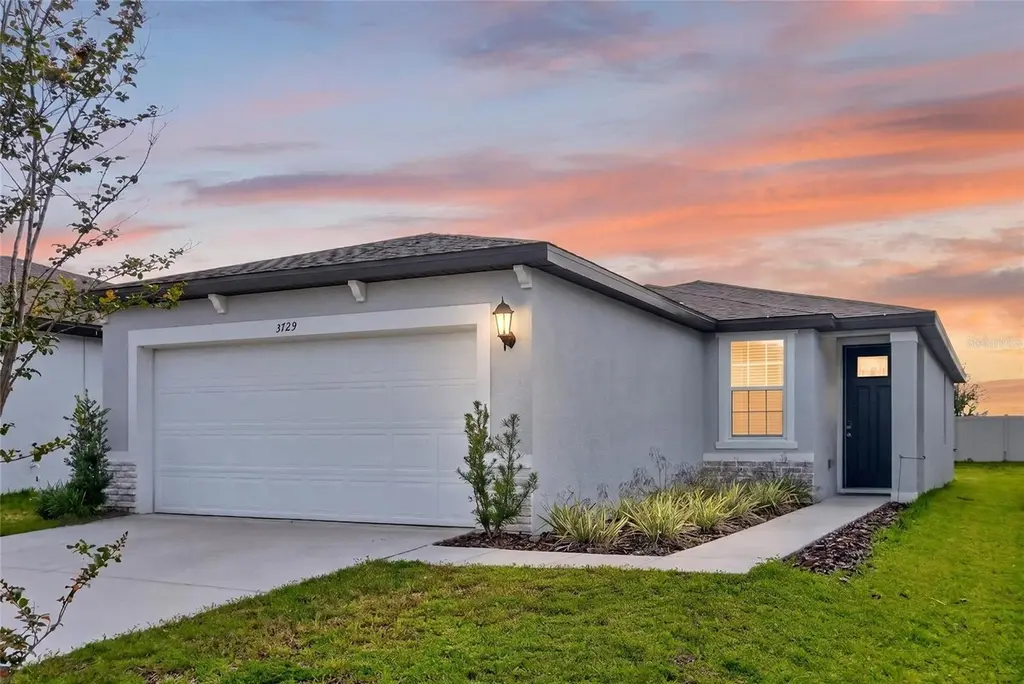
3729 Radiant Mountain Dr · Plant City, FL
Flood risk No data
- FEMA flood zone
- —
- Chance of flooding over 30 yrs
- —
- Est. flood insurance / yr
- —
Fire risk No data
- Est. fire insurance / yr
- —
Heat risk No data
- Hot days now (above threshold)
- —
- Hot days in 30 yrs
- —
Wind risk No data
- Chance of severe wind over 30 yrs
- —
Air-quality risk No data
- Unhealthy air days now
- —
- Unhealthy air days in 30 yrs
- —
Risk factors via First Street. Map © Google.
Why this score? — see what drove the D grade
The composite is a weighted blend of 9 inputs, each scored 0–100. Each bar is that input's sub-score; the figure is the points it added to the 100-point composite (weight × sub-score).
- Cash flow +12.1/30.0
- ARV discount +7.5/15.0
- Schools +4.2/10.0
- Condition / age +4.0/5.0
- 1% rule +3.9/10.0
- Livability +3.8/5.0
- DSCR +3.6/10.0
- Rent growth +2.5/5.0
- Appreciation +0.0/10.0
$299,999
🖨 Deal sheet (PDF) 📄 Offer letter ✓ Due diligence
Listing remarks MLS
Brand new, energy-efficient home available NOW! Indulge in a chef-inspired kitchen which overlooks a spacious great room and dining area. Secondary bedrooms are non-adjacent to provide privacy. The primary suite offers dual sinks and a spacious walk-in closet. New homes in Plant City, FL. Located in the master-planned community of Park East, this community offers a variety of new, single-family homes, both single and two-story, priced from the $300s. Less than a mile away from I-4, this community also offers easy access to Lakeland and Tampa. Residents can enjoy the community’s amenities which include a cabana, resort-style pool, sport court, and playground. Each of our homes is built with innovative, energy-efficient features designed to help you enjoy more savings, better health, real comfort and peace of mind.
Key facts
- Open living spaces
- Large center island
- Granite countertops
Tags
Property features AI
Finance
- Other: Property type: Residential — Single Family Residence; Lot roughly 40 x 125 (0.11 acre); Energy-efficient features include efficient appliances, HVAC, insulation, lighting, thermostat, and windows
- Financial info: CDD present; Lease restrictions apply
- HOA & community: HOA managed by Inframark / Shamil Porto; Annual HOA fee $98 (monthly approx. $8.17); Community amenities: basketball court, clubhouse, playground, pool; Deed restrictions; Pets allowed
Exterior
- Parking: Attached 2-car garage (18 x 20) with garage door opener
- Security: Smoke detectors
- Utilities: Public water; Public sewer; Underground utilities
- Home design: Single family residence; One story; East-facing entry; Completed condition
- Construction: Block construction; Shingle roof; Slab foundation; Built by Meritage Homes (Denali model)
- Exterior features: Patio; Sidewalk; Public maintained asphalt road
Interior
- Kitchen: Dishwasher; Disposal; Microwave; Range; Refrigerator
- Bedrooms: 3 bedrooms
- Flooring: Carpet; Ceramic tile
- Bathrooms: 2 full bathrooms
- Heating & cooling: Central heating (electric); Central air conditioning
- Interior features: Ceiling fans; Open floor plan; Programmable thermostat; Walk-in closets; Inside utility room
- Laundry & utility: Inside laundry room with washer and dryer included
Neighborhood map
What this means for you Summary
Snapshot
- This is a 3-bed/2.0-bath single-family listed at $300k. Condition is rated good.
Deal economics
- At list price, monthly cash flow is $-68 ($-816/yr) — negative.
- To cash-flow at today's rent, offer at most $288k (4.0% below list).
- To meet the 1% rule (rent ≥ 1% of price), the offer needs to be $266k (11.4% below list).
- Recommended offer: $266k (11.4% below list) — sets the bar for 1% rule.
Location & tenants
- Location reads 76/100 on livability (#227 in FL, #3,587 nationally) — a middle-class / working-renter tenant base. Strengths: amenities A+, cost of living A+, housing A+; Watch: employment C-, commute F.
- Hillsborough (suburban): math 47% / reading 50% proficiency, ranked #41 of 73 in FL (top 56%) — families likely to look elsewhere, expect single-tenant / working-renter base with shorter leases.
- Zoned schools: Knights Elementary School (math 52% / reading 45%, grade D, #1,152 of 2,144 statewide, top 55%, 623 students, 70% FRL); Marshall Middle Magnet School (math 28% / reading 31%, grade F, #469 of 571 statewide, top 84%, 1,089 students, 69% FRL); Plant City High School (math 38% / reading 40%, grade F, #312 of 667 statewide, top 48%, 2,474 students, 58% FRL).
- Market conditions: 323 active listings in the ZIP; 7 comparable units currently listed for rent nearby; rentals at typical pace (median 26d on market — plan ~3-4 weeks tenant-placement turnaround); 9,053 units permitted in Hillsborough County in 2024 (4,555 in 5+ unit buildings).
- This rent runs 43% of the median local income ($73k/yr) — at the standard rent-burdened threshold; future hikes will face affordability resistance.
Forward outlook
- Local home prices are declining (-3.0%/yr); year-one equity from $2k of loan paydown is wiped out by about $9k of value loss. Plan a longer hold.
- Hillsborough County population projected at +37% by 2050 — long-run rental-demand tailwind backs the buy-and-hold thesis.
Negotiation context
- Only 8 days on market — expect competitive offers; lowballing is unlikely to land.
- 3 sale attempts since 2y ago with the ask held roughly flat each time — persistent listings suggest the price (not the market) is what's stuck; bring a comps-based counter.
Questions for the listing agent
- What do current leases actually rent for vs. the listed asking? Can we see a recent rent roll and the last 12 months of T-12 income?
- What does the HOA fee cover, when was the last increase, and are there any pending special assessments or reserve-fund shortfalls?
- Is there a deadline driving the sale (1031 exchange, divorce, estate, relocation)? That informs how much negotiation room exists.
- Schools are D-rated, which usually means shorter tenancies and higher turnover. Who's the typical renter profile here, and what's been the actual vacancy rate?
- The area grade is low — what's the realistic commute time and amenity access for the typical tenant pool here? Any planned neighborhood developments (good or bad) we should know about?
- What's the average days-on-market for RENTAL listings here right now (not sales)? A rising rental-DOM trend means longer vacancies and softer asking-rent achievability than the comps imply.
- What's the recent tenant-quality profile in this submarket — average credit score on applications, eviction rate, late-payment / NSF rate, and stable-employment percentage? A property-management company in the area should have these aggregated.
- How much new for-sale + rental construction is in the pipeline within 1–3 miles? Heavy new supply typically softens prices + rents 12–24 months out; constrained supply supports both.
Investment metrics
- 1% rule
- 0.89% ✗
- Cap rate
- 6.02%
- Cash-on-cash
- -0.97%
- DSCR
- 0.96
- GRM
- 9.4
CMA / ARV
No comps found within radius.
Projected returns pro-forma
-3.0% appreciation · 3.0% rent growth · sell at horizon
- IRR
- -17.9%
- Equity multiple
- 0.37×
- Total profit
- $-52,843
- Equity at exit
- $44,731
- IRR
- -9.9%
- Equity multiple
- 0.39×
- Total profit
- $-51,189
- Equity at exit
- $25,938
Cash invested: $84,000 (down + closing). Projections, not guarantees.
Landlord ↔ Tenant lean methodology
- Overall (STATE)
- 87 Strongly Landlord-Friendly
- State Florida
- 87 Strongly Landlord-Friendly · R+3
- County
- — inherits STATE
- City
- — inherits STATE
ZIP-level market 33565
- Home prices YoY
- -24.7%
- Active inventory
- 323
- Price-to-rent
- 9.4×
Monthly cashflow live
- Estimated rent
- $2,659 high interval (Pro) →
- Mortgage (P&I)
- −$1,573
- Tax from tax record
- −$462 /mo · $5,547/yr
- Insurance
- −$125
- HOA
- −$8
- Vacancy / Maint / Mgmt
- −$558
- Net cashflow
- $-68
Break-even live
Sensitivity live
| Price | -10% $102 | -5% $17 | +0% $-68 | +5% $-153 | +10% $-238 |
|---|---|---|---|---|---|
| Rent | -10% $-278 | -5% $-173 | +0% $-68 | +5% $37 | +10% $142 |
| Rate | -1.0pp $83 | -0.5pp $8 | base $-68 | +0.5pp $-146 | +1.0pp $-225 |
UW: 25.0% down · 7.5% · 30yr · 1.5% tax · 5.0% vac · 8.0% maint · 8.0% mgmt
Financing live
Cash to close
- Down payment
- $75,000
- Closing costs
- $9,000
- Reserves months
- —
- Total cash needed
- —
Loan-product check · same deal, 3 products live
Conventional
25% down · 7.5% · 30yr
- Down + closing
- —
- Monthly P&I
- —
- Monthly cashflow
- —
- DSCR
- —
- Eligible?
- —
Personal DTI + credit; lowest rate.
DSCR
20% down · 8.5% · 30yr
- Down + closing
- —
- Monthly P&I
- —
- Monthly cashflow
- —
- DSCR
- —
- Eligible?
- —
No personal income docs; deal must DSCR.
Hard money
10% down · 12.0% · 12mo
- Down + closing
- —
- Monthly P&I
- —
- Monthly cashflow
- —
- DSCR
- —
- Eligible?
- —
Short-term bridge; refi at stabilization.
Rent comps 7 comps
| Address | Beds | Baths | Sqft | Rent | $/sqft | DOM | Units | Dist |
|---|---|---|---|---|---|---|---|---|
| 2318 Allium Roseum Ln Plant City, FL | 4.0 | 2.0 | 1817 | $2,400 | $1.32 | 26d | 1 | 0.29mi |
| 1412 Tahitian Sunrise Dr Plant City, FL | 3.0 | 2.0 | 1540 | $2,300 | $1.49 | 26d | 1 | 0.68mi |
| 4025 Westwood Fields Loop Plant City, FL | 3.0 | 2.0 | 1565 | $2,425 | $1.55 | 23d | 1 | 1.18mi |
| 4027 Westwood Fields Loop Plant City, FL | 3.0 | 2.0 | 1565 | $3,200 | $2.04 | 23d | 1 | 1.18mi |
| 4010 Westwood Fields Loop Plant City, FL | 3.0 | 2.0 | 1565 | $2,300 | $1.47 | 26d | 1 | 1.23mi |
| 4005 Westwood Fields Loop Unit 4005 Plant City, FL | 3.0 | 2.0 | 1565 | $2,500 | $1.60 | 26d | 1 | 1.23mi |
| 4008 Westwood Fields Loop Plant City, FL | 3.0 | 2.0 | 1565 | $2,300 | $1.47 | 26d | 1 | 1.23mi |
HOA detail
- Monthly dues
- $8 · $96/yr
- Likely covers
- pool
Listing history 8 events
-
2026-06-17status $299,999 Pending 8 DOM
-
2026-06-17days on market $299,999 Active 8 DOM
-
2026-06-16days on market $299,999 Active 7 DOM
-
2026-06-15days on market $299,999 Active 6 DOM
-
2026-06-13days on market $299,999 Active 4 DOM
-
2026-06-13days on market $299,999 Active 3 DOM
-
2026-06-10remarks 699-char remark
-
2026-06-10$299,999 Active 1 DOM
ⓘ Source: listings_history table (triggers on properties + properties_extension) + one-shot
backfill from property_details.listing_events for pre-trigger history.
Tax reassessment forecast FL · Resets to sale price
- Current annual tax
- $5,547 · $462/mo
- Projected year-2 tax
- $5,547 · $462/mo
- Expected delta
- $0/yr ($0/mo · 0.0%)
ⓘ Screening estimate from a state-policy table — verify with the county assessor before closing.
Nearby sold comps map
Loading sold comps map…
Walkable amenities ~0.75 mi
Loading nearby amenities…
Taxation est. · year 1
- Rental income
- $31,906
- − Mortgage interest
- −$16,805
- − Property taxes
- −$5,547
- − Insurance
- −$1,500
- − Repairs & maintenance
- −$2,552
- − Management
- −$2,552
- − HOA
- −$96
- − Depreciation
- −$8,727
- Taxable loss
- −$5,873
- Est. tax savings @ 24.0%
- +$1,410
- After-tax cash flow
- $594/yr
For passive investors: Depreciation is non-cash, so a rental often shows a tax loss while cash-flowing — sheltering income. Rental losses are passive: they offset passive income freely, and up to $25,000/yr can offset ordinary (W-2) income if you actively participate and your MAGI is under $100k (phasing out to $0 by $150k); unused losses carry forward. On sale, claimed depreciation is recaptured at up to 25%, and gains may owe capital-gains tax (a 1031 exchange can defer both). Figures are a year-1 estimate at your 24.0% rate — not tax advice; consult a CPA.
Condition & rehab AI · 12 photos
This well-maintained, modern home in the Park East subdivision offers a good condition with minimal repairs needed. It's located in a desirable community with access to resort-style amenities.
Value-add opportunities
- Both Paint interior walls — Fresh paint can enhance the home's curb appeal and interior aesthetics
- Resale Replace countertops — Granite countertops are durable and timeless, enhancing the home's resale value
- Resale Upgrade flooring — High-quality flooring can significantly increase the home's resale value
Renovation cost estimate screening
Value-add ROI direction
- Both Paint interior walls — Fresh paint can enhance the home's curb appeal and interior aesthetics ↑
- Resale Replace countertops — Granite countertops are durable and timeless, enhancing the home's resale value ↑
- Resale Upgrade flooring — High-quality flooring can significantly increase the home's resale value ↑
ⓘ Cost ranges are severity-bucket heuristics (US national rule-of-thumb). Get contractor quotes + a written scope before underwriting a rehab budget.
Schools (NCES district)
- District
- Hillsborough
- NCES district ID
- 1200870
- Math proficiency
- 47% ▼ -8.00%
- Reading proficiency
- 50% ▼ -4.00%
- Median HH income
- $50,622
- Composite
- 41.6/100
- National rank
- #3435
- State rank
- #41 of 73 in FL
Livability — Plant City
- Score
- 76/100
- State rank
- #227
- US rank
- #3587
Category grades
Schools grade is shown separately in the Schools card above.
Census & demographics
- Census place
- Plant City, FL
- County
- Hillsborough County · 1,540,968 people
- City population
- 68,525
- Metro
- Tampa-St. Petersburg-Clearwater, FL
- Population (ZIP)
- 18,108
- Household income
- $73,414
- Rent vs Own
- Severe rent burden
- 152.0
Population outlook (Hillsborough County) Hauer SSP2
- Today (2025)
- 1,607,022 people
- By 2030
- 1,733,968 · +7.9%
- By 2040
- 1,979,565 · +23.2%
- By 2050
- 2,203,427 · +37.1%
- By 2075
- 2,667,893 · +66.0%
- By 2100
- 2,891,558 · +79.9%
Race, ethnicity, and origin ACS 2023
- Neighborhood character
- Predominantly White (71%)
- Race & ethnicity
- White 71% Hispanic / Latino 23% Two or more races 14% Black 2% Native American 1%
- Hispanic origin (detail)
- Mexican 16% Puerto Rican 2% Cuban 1%
- Common ancestry
- Romanian 2% Slovak 1% Iranian 1%
- Foreign-born
- 10% · Canada, Jamaica
- Languages at home
- 80% English-only · Spanish 19%
Political lean MEDSL · Hillsborough
- 2024 margin
- Toss-up / Even · D 47.8% · R 50.9% · Other 1.3%
- 2008→2024 swing
- -10.2pp toward R · 2008: 7.1pp · 2024: -3.1pp
- All cycles
- 2024: R+3.1 2020: D+6.9 2016: D+6.8 2012: D+6.7 2008: D+7.1
Not yet ingested
- Civics
- —
Market trends
- HPI YoY
- ▼ -114.17%
- Current HPI
- 347.2475
- Rent YoY
- —
- Metro
- Tampa-St. Petersburg-Clearwater, FL
- State GDP YoY
- ▲ 3.28%
- F500 in state
- 36
Industry mix (Fortune 500 HQ in FL)
| Industry | F500 HQs | Revenue |
|---|---|---|
| Industrial Technology | 2 | $29B |
|
||
| Insurance | 2 | $17B |
|
||
| Retail | 1 | $60B |
|
||
| Technology Distribution | 1 | $58B |
|
||
| Homebuilding | 1 | $35B |
|
||
| Technology Manufacturing | 1 | $35B |
|
||
Price history
-8.2% since first listed10 events — show timeline
- 2026-06-09 Listed $299,999 Stellar MLS as Distributed by MLS Grid
- 2024-12-13 Sold (MLS) $315,000 Stellar MLS as Distributed by MLS Grid
- 2024-11-05 Pending — Stellar MLS as Distributed by MLS Grid
- 2024-10-30 Price Changed $299,999 Stellar MLS as Distributed by MLS Grid
- 2024-10-02 Price Changed $329,999 Stellar MLS as Distributed by MLS Grid
- 2024-09-25 Relisted — Stellar MLS as Distributed by MLS Grid
- 2024-09-04 Price Changed $335,760 Stellar MLS as Distributed by MLS Grid
- 2024-07-24 Price Changed $311,760 Stellar MLS as Distributed by MLS Grid
- 2024-07-08 Price Changed $331,760 Stellar MLS as Distributed by MLS Grid
- 2024-06-27 Listed $326,760 Stellar MLS as Distributed by MLS Grid
Cash-flow waterfall
monthlySold comps — $/sqft
last 12 mo · ≤1 miLoading sold comps…