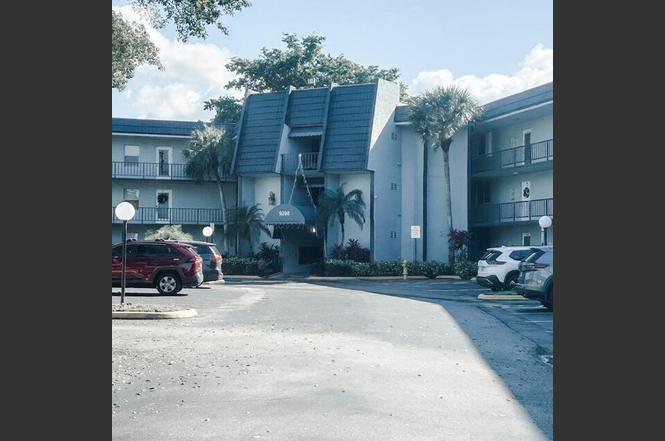
9200 Lime Bay Blvd #312 · Tamarac, FL
Flood risk 1/10 · Minimal
- FEMA flood zone
- X (shaded)
- Chance of flooding over 30 yrs
- 0.0%
- Est. flood insurance / yr
- $507 – $1,088
Fire risk 2/10 · Minimal
- Est. fire insurance / yr
- $947 – $1,759
Heat risk 10/10 · Severe
- Hot days now (above 106°F)
- 7 days/yr
- Hot days in 30 yrs
- 26 days/yr
Wind risk 10/10 · Severe
- Chance of severe wind over 30 yrs
- 99.0%
Air-quality risk 3/10 · Minor
- Unhealthy air days now
- 2 days/yr
- Unhealthy air days in 30 yrs
- 3 days/yr
Risk factors via First Street. Map © Google.
Why this score? — see what drove the C grade
The composite is a weighted blend of 9 inputs, each scored 0–100. Each bar is that input's sub-score; the figure is the points it added to the 100-point composite (weight × sub-score).
- Cash flow +19.7/30.0
- 1% rule +10.0/10.0
- ARV discount +7.5/15.0
- DSCR +6.2/10.0
- Schools +4.1/10.0
- Livability +3.8/5.0
- Condition / age +2.5/5.0
- Rent growth +2.0/5.0
- Appreciation +0.0/10.0
$89,000
🖨 Deal sheet 📄 Offer letter ✓ Due diligence
Listing remarks
Cozy 1 Bedroom/1 bathroom apartment featuring spacious layout extending to a private balcony. Nice kitchen and ceramic tile throughout the unit. Move-in Ready with the option to purchase with partial, full or unfurnished. Spacious master bedroom with en-suite bath, dressing area, and ample storage. The building offers elevators and laundry rooms on the same floor. HOA include water, sewer, trash, internet and cable. Parking assigned and guest. Very well located near shops, restaurants, shopping plazas, stores, and movie theaters, with easy access to the Sawgrass Expressway and other major roads.
Key facts
- Private balcony
- Laundry rooms
- En-suite bath
Tags
Property features AI
Finance
- Other: Private road and public road frontage; Has private pool; Senior community
- Financial info: Pets not allowed; Parcel and tax details available (financial specifics excluded)
- HOA & community: HOA with monthly fee; HOA amenities include billiard room, clubhouse, elevators, fitness center, game room, park, picnic area, parking, pool, tennis courts, on-site manager, bike storage, business center, internet included, library, street lights; HOA fee payment: monthly
Exterior
- Parking: Assigned parking; Guest parking; 1 open parking space
- Security: Fire sprinkler system
- Utilities: Septic tank sewer; Cable available; Water service available
- Home design: Condominium; 3-story building; Facing east; Resale property; Accessible elevator installed
- Construction: CBS construction
- Exterior features: Sidewalks; Not waterfront
Interior
- Kitchen: Electric range; Refrigerator
- Bedrooms: 1 bedroom on the main level
- Flooring: Ceramic tile
- Bathrooms: 1 full bathroom on the main level
- Heating & cooling: Central heating; Central air; Ceiling fan(s)
- Interior features: Entrance foyer; Walk-in closet(s)
- Laundry & utility: Unfurnished (no laundry appliances specified)
Neighborhood map
What this means for you Summary
Snapshot
- This is a 1-bed/1.0-bath condo listed at $89k.
Deal economics
- At list price, monthly cash flow is $104 ($1k/yr) — positive.
- The deal already cash-flows at list — no discount required.
- Meets the 1% rule at list price ($2k rent vs $89k).
- Recommended offer: $78k (12.0% below list) — sets the bar for market timing.
- Cap rate 7.7% vs local median 3.9% in Tamarac — top-decile yield for the area; either an underpriced asset or a hidden risk that comps aren't pricing in. Stress-test before assuming the spread holds.
Location & tenants
- Location reads 76/100 on livability (#239 in FL, #3,785 nationally) — a middle-class / working-renter tenant base. Strengths: housing A+, health & safety A+, cost of living A-; Watch: employment C-, amenities F, commute F.
- Broward (suburban): math 42% / reading 53% proficiency, ranked #46 of 73 in FL (top 63%) — families likely to look elsewhere, expect single-tenant / working-renter base with shorter leases.
- Zoned schools: Challenger Elementary School (math 37% / reading 53%, grade D-, #1,271 of 2,144 statewide, top 60%, 909 students, 62% FRL); J. P. Taravella High School (math 19% / reading 45%, grade F, #415 of 667 statewide, top 63%, 2,586 students, 54% FRL).
- Market conditions: Rents soft (-1.9%/yr); 588 active listings in the ZIP; 18 comparable units currently listed for rent nearby; rentals at typical pace (median 17d on market — plan ~3-4 weeks tenant-placement turnaround); 2,111 units permitted in Broward County in 2024 (1,265 in 5+ unit buildings).
- This rent runs 31% of the median local income ($62k/yr) — at the standard rent-burdened threshold; future hikes will face affordability resistance.
Forward outlook
- Local home prices are declining (-3.0%/yr); year-one equity from $615 of loan paydown is wiped out by about $3k of value loss. Plan a longer hold.
- Broward County population projected at +34% by 2050 — long-run rental-demand tailwind backs the buy-and-hold thesis.
Negotiation context
- It's been on market 155 days — a 12% lower offer ($78k) is reasonable based on typical stale-listing flexibility.
- 3 sale attempts; this cycle's ask is 6038% above the opening price — seller raised mid-cycle; expect resistance to lowballs.
Risks & watch-outs
- Watch-outs: property tax is 2.7% of price; HOA is 29% of rent.
- Climate carrying-cost: severe wind risk, 99% chance of damaging wind over 30y; extreme-heat days projected 7→26/yr by 2055 (HVAC capex compounding) — expect insurance premiums to compound above CPI over the hold.
Questions for the listing agent
- It's been on market 155 days. Have you received any prior offers? Is the seller open to a 12% concession, seller financing, or rate buy-down credit?
- Built in 1975 — when were the roof, HVAC, electrical panel, plumbing, and water heater last replaced?
- Property tax is high relative to price — has the assessment been appealed recently, and will the sale trigger a re-assessment?
- What does the HOA fee cover, when was the last increase, and are there any pending special assessments or reserve-fund shortfalls?
- Any open or pending special assessments — roof, HVAC, plumbing, elevator, façade? What's the per-unit balance and payoff schedule, and is the seller paying it off at close or rolling it to the buyer?
- Why hasn't it sold? Are there any deal-killer items the seller is aware of (foundation, flood, title, zoning, code violations)?
- Is there a deadline driving the sale (1031 exchange, divorce, estate, relocation)? That informs how much negotiation room exists.
- Schools are B-rated — typically a magnet for longer-tenancy family renters. What's the average tenant stay here, and is there a school-zone premium baked into asking?
- What's the average days-on-market for RENTAL listings here right now (not sales)? A rising rental-DOM trend means longer vacancies and softer asking-rent achievability than the comps imply.
- What's the recent tenant-quality profile in this submarket — average credit score on applications, eviction rate, late-payment / NSF rate, and stable-employment percentage? A property-management company in the area should have these aggregated.
- How much new apartment / multifamily construction is in the pipeline within 1–3 miles? Heavy new supply (>2% of stock underway) typically softens rents 12–24 months out; light construction supports rent growth.
Investment metrics
- 1% rule
- 1.83% ✓
- Cap rate
- 7.69%
- Cash-on-cash
- 4.99%
- DSCR
- 1.22
- GRM
- 4.6
CMA / ARV
No comps found within radius.
Projected returns pro-forma
-3.0% appreciation · 0.0% rent growth · sell at horizon
- IRR
- -14.4%
- Equity multiple
- 0.51×
- Total profit
- $-12,222
- Equity at exit
- $13,270
- IRR
- -19.3%
- Equity multiple
- 0.23×
- Total profit
- $-19,072
- Equity at exit
- $7,695
Cash invested: $24,920 (down + closing). Projections, not guarantees.
Landlord ↔ Tenant lean methodology
- Overall (STATE)
- 87 Strongly Landlord-Friendly
- State Florida
- 87 Strongly Landlord-Friendly · R+3
- County
- — inherits STATE
- City
- — inherits STATE
ZIP-level market 33321
- Home prices YoY
- -30.4%
- Rents YoY
- -1.9%
- Active inventory
- 588
- Price-to-rent
- 4.6×
Monthly cashflow live
- Estimated rent
- $1,628 high interval (Pro) →
- Mortgage (P&I)
- −$467
- Tax from tax record
- −$201 /mo · $2,412/yr
- Insurance
- −$37
- HOA
- −$478
- Vacancy / Maint / Mgmt
- −$342
- Net cashflow
- $104
Break-even live
UW: 25.0% down · 7.5% · 30yr · 1.5% tax · 5.0% vac · 8.0% maint · 8.0% mgmt
Financing live
Cash to close
- Down payment
- $22,250
- Closing costs
- $2,670
- Reserves months
- —
- Total cash needed
- —
Loan-product check · same deal, 3 products live
Conventional
25% down · 7.5% · 30yr
- Down + closing
- —
- Monthly P&I
- —
- Monthly cashflow
- —
- DSCR
- —
- Eligible?
- —
Personal DTI + credit; lowest rate.
DSCR
20% down · 8.5% · 30yr
- Down + closing
- —
- Monthly P&I
- —
- Monthly cashflow
- —
- DSCR
- —
- Eligible?
- —
No personal income docs; deal must DSCR.
Hard money
10% down · 12.0% · 12mo
- Down + closing
- —
- Monthly P&I
- —
- Monthly cashflow
- —
- DSCR
- —
- Eligible?
- —
Short-term bridge; refi at stabilization.
Rent comps 18 comps
| Address | Beds | Baths | Sqft | Rent | $/sqft | DOM | Units | Dist |
|---|---|---|---|---|---|---|---|---|
| 9301 Lime Bay Blvd Tamarac, FL | 1.0–2.0 | 1.5–2.0 | 850 | $1,400 | $1.65 | 24d | 2 | 0.06mi |
| 9360 Lime Bay Blvd #314 Tamarac, FL | 1.0 | 1.5 | 750 | $1,640 | $2.19 | 15d | 1 | 0.08mi |
| 9091 Lime Bay Blvd #212 Tamarac, FL | 1.0 | 1.0 | 700 | $1,500 | $2.14 | 10d | 1 | 0.23mi |
| 7630 Westwood Dr #327 Tamarac, FL | 1.0 | 1.0 | 741 | $1,550 | $2.09 | 15d | 1 | 0.59mi |
| 7630 Westwood Dr #327 Tamarac, FL | 1.0 | 1.0 | 741 | $1,550 | $2.09 | 2d | 1 | 0.59mi |
| 9905 Westwood Dr Unit 18-3 Tamarac, FL | 1.0 | 1.0 | 615 | $1,625 | $2.64 | 24d | 1 | 0.60mi |
| 8601 W McNab Rd Tamarac, FL | 3.0 | 1.0–2.0 | 993 | $2,211 | $2.23 | 4d | 11 | 0.61mi |
| 9909 Westwood Dr Unit 16-1 Tamarac, FL | 1.0 | 1.0 | 615 | $1,650 | $2.68 | 24d | 1 | 0.65mi |
| 8800 NW 78th Ct Tamarac, FL | 1.0–2.0 | 1.0–2.0 | 910 | $1,908 | $2.10 | 2d | 15 | 0.81mi |
| 8060 Colony Cir N Tamarac, FL | 1.0 | 1.5 | 750 | $1,600 | $2.13 | 17d | 2 | 1.07mi |
| 8060 Colony Cir N #208 Tamarac, FL | 1.0 | 1.5 | 750 | $1,700 | $2.27 | 15d | 1 | 1.07mi |
| 8000 Lagos De Campo Blvd Unit A-303 Tamarac, FL | 1.0 | 1.5 | 746 | $1,775 | $2.38 | 24d | 1 | 1.13mi |
| 7980 N Nob Hill Rd Tamarac, FL | 1.0–2.0 | 1.0–2.0 | 836 | $1,700 | $2.03 | 17d | 2 | 1.14mi |
| 8050 N Nob Hill Rd #102 Tamarac, FL | 1.0 | 1.0 | 691 | $1,850 | $2.68 | 3d | 1 | 1.18mi |
| 8050 N Nob Hill Rd #102 Tamarac, FL | 1.0 | 1.0 | 691 | $1,850 | $2.68 | 4d | 1 | 1.18mi |
| 8040 Colony Cir N #207 Tamarac, FL | 1.0 | 1.5 | 750 | $1,475 | $1.97 | 24d | 1 | 1.19mi |
| 7910 Colony Cir N #308 Tamarac, FL | 1.0 | 1.5 | 750 | $1,600 | $2.13 | 24d | 1 | 1.24mi |
| 7900 Colony Cir S #303 Tamarac, FL | 1.0 | 1.5 | 750 | $1,680 | $2.24 | 24d | 1 | 1.25mi |
HOA detail condo
- Monthly dues
- $478 · $5,736/yr
- Likely covers
- watersewertrashinternetcable
- Assessments
- None detected in remarks — confirm with the listing agent.
Listing history 25 events
-
2026-06-18days on market $89,000 Active 155 DOM
-
2026-06-17days on market $89,000 Active 154 DOM
-
2026-06-16days on market $89,000 Active 153 DOM
-
2026-06-15days on market $89,000 Active 152 DOM
-
2026-06-13days on market $89,000 Active 150 DOM
-
2026-06-09days on market $89,000 Active 146 DOM
-
2026-06-07days on market $89,000 Active 144 DOM
-
2026-06-04days on market $89,000 Active 141 DOM
-
2026-06-03days on market $89,000 Active 140 DOM
-
2026-06-02days on market $89,000 Active 139 DOM
-
2026-06-01days on market $89,000 Active 138 DOM
-
2026-05-31days on market $89,000 Active 137 DOM
-
2026-05-20historical $1,450
-
2026-05-20$1,450
-
2026-05-10$1,450
-
2026-04-01price $89,000
-
2026-03-23price $90,000
-
2026-03-03price $95,000
-
2026-02-21price $89,900
-
2026-01-30price $94,900
-
2026-01-14$99,900 Active
-
2023-04-12soldstatus $85,000
-
2017-02-27soldstatus $29,000
-
1992-08-20soldstatus $23,000
-
1974-11-01soldstatus $19,000
ⓘ Source: listings_history table (triggers on properties + properties_extension) + one-shot
backfill from property_details.listing_events for pre-trigger history.
Tax reassessment forecast FL · Resets to sale price
- Current annual tax
- $2,412 · $201/mo
- Projected year-2 tax
- $2,412 · $201/mo
- Expected delta
- $0/yr ($0/mo · 0.0%)
ⓘ Screening estimate from a state-policy table — verify with the county assessor before closing.
Climate risk First Street
- Flood 1/10 Low FEMA zone X (shaded) · 0% chance over 30 yrs
- Wildfire 2/10 Low
- Heat 10/10 Extreme 7 d/yr ≥106°F today · 26 d/yr by 30 yrs out
- Wind 10/10 Extreme 99% chance of damaging wind over 30 yrs
- Air quality 3/10 Moderate 2 unhealthy d/yr today · 3 by 30 yrs out
Nearby sold comps map
Loading sold comps map…
Walkable amenities ~0.75 mi
Loading nearby amenities…
Taxation est. · year 1
- Rental income
- $19,541
- − Mortgage interest
- −$4,985
- − Property taxes
- −$2,412
- − Insurance
- −$445
- − Repairs & maintenance
- −$1,563
- − Management
- −$1,563
- − HOA
- −$5,736
- − Depreciation
- −$2,589
- Taxable income
- $246
- Est. tax owed @ 24.0%
- −$59
- After-tax cash flow
- $1,184/yr
For passive investors: Depreciation is non-cash, so a rental often shows a tax loss while cash-flowing — sheltering income. Rental losses are passive: they offset passive income freely, and up to $25,000/yr can offset ordinary (W-2) income if you actively participate and your MAGI is under $100k (phasing out to $0 by $150k); unused losses carry forward. On sale, claimed depreciation is recaptured at up to 25%, and gains may owe capital-gains tax (a 1031 exchange can defer both). Figures are a year-1 estimate at your 24.0% rate — not tax advice; consult a CPA.
Schools (NCES district)
- District
- Broward
- NCES district ID
- 1200180
- Math proficiency
- 42% ▼ -18.00%
- Reading proficiency
- 53% ▼ -5.00%
- Median HH income
- $52,139
- Composite
- 40.88/100
- National rank
- #3621
- State rank
- #46 of 73 in FL
Livability — Tamarac
- Score
- 76/100
- State rank
- #239
- US rank
- #3785
Category grades
Schools grade is shown separately in the Schools card above.
Census & demographics
- Census place
- Tamarac, FL
- County
- Broward County · 1,963,430 people
- City population
- 105,666
- Metro
- Miami-Fort Lauderdale-Pompano Beach, FL
- Population (ZIP)
- 51,216
- Household income
- $62,066
- Rent vs Own
- Severe rent burden
- 1394.0
Population outlook (Broward County) Hauer SSP2
- Today (2025)
- 2,207,033 people
- By 2030
- 2,360,704 · +7.0%
- By 2040
- 2,661,208 · +20.6%
- By 2050
- 2,946,698 · +33.5%
- By 2075
- 3,602,273 · +63.2%
- By 2100
- 3,970,984 · +79.9%
Race, ethnicity, and origin ACS 2023
- Neighborhood character
- Highly diverse neighborhood (Simpson 0.70)
- Race & ethnicity
- Hispanic / Latino 34% White 33% Black 27% Two or more races 20% Asian 3%
- Hispanic origin (detail)
- Mexican 2% Puerto Rican 5% Cuban 5% Dominican 3%
- Common ancestry
- Romanian 3% Hispanic 3% Scotch-Irish 2%
- Foreign-born
- 38% · Canada, Jamaica, Dominican Republic
- Languages at home
- 63% English-only · Spanish 29% French/Haitian/Cajun 4% Other Indo-European 1%
Political lean MEDSL · Broward
- 2024 margin
- D (+17.0) · D 58.0% · R 41.0%
- 2008→2024 swing
- -17.8pp toward R · 2008: 34.7pp · 2024: 17.0pp
- All cycles
- 2024: D+17.0 2020: D+29.8 2016: D+35.0 2012: D+34.9 2008: D+34.7
Not yet ingested
- Civics
- —
Market trends
- HPI YoY
- ▼ -158.63%
- Current HPI
- 362.2989
- Rent YoY
- ▼ -1.86%
- Metro
- Miami-Fort Lauderdale-Pompano Beach, FL
- State GDP YoY
- ▲ 3.28%
- F500 in state
- 36
Industry mix (Fortune 500 HQ in FL)
| Industry | F500 HQs | Revenue |
|---|---|---|
| Industrial Technology | 2 | $29B |
|
||
| Insurance | 2 | $17B |
|
||
| Retail | 1 | $60B |
|
||
| Technology Distribution | 1 | $58B |
|
||
| Homebuilding | 1 | $35B |
|
||
| Technology Manufacturing | 1 | $35B |
|
||
Price history
-92.4% since first listed13 events — show timeline
- 2026-05-20 Rental Removed $1,450 GFLMLS
- 2026-05-20 Listed for Rent $1,450 GFLMLS
- 2026-05-10 Listed for Rent $1,450 RMLSFL
- 2026-04-01 Price Changed $89,000 Beaches MLS
- 2026-03-23 Price Changed $90,000 Beaches MLS
- 2026-03-03 Price Changed $95,000 Beaches MLS
- 2026-02-21 Price Changed $89,900 Beaches MLS
- 2026-01-30 Price Changed $94,900 Beaches MLS
- 2026-01-14 Listed $99,900 Beaches MLS
- 2023-04-12 Sold (Public Records) $85,000 Public Records
- 2017-02-27 Sold (Public Records) $29,000 Public Records
- 1992-08-20 Sold (Public Records) $23,000 Public Records
- 1974-11-01 Sold (Public Records) $19,000 Public Records
Property tax history
+17.1%/yrLatest (2025): $2,412 · +1.4% YoY. Source: county tax records.
Cash-flow waterfall
monthlySold comps — $/sqft
last 12 mo · ≤1 miLoading sold comps…