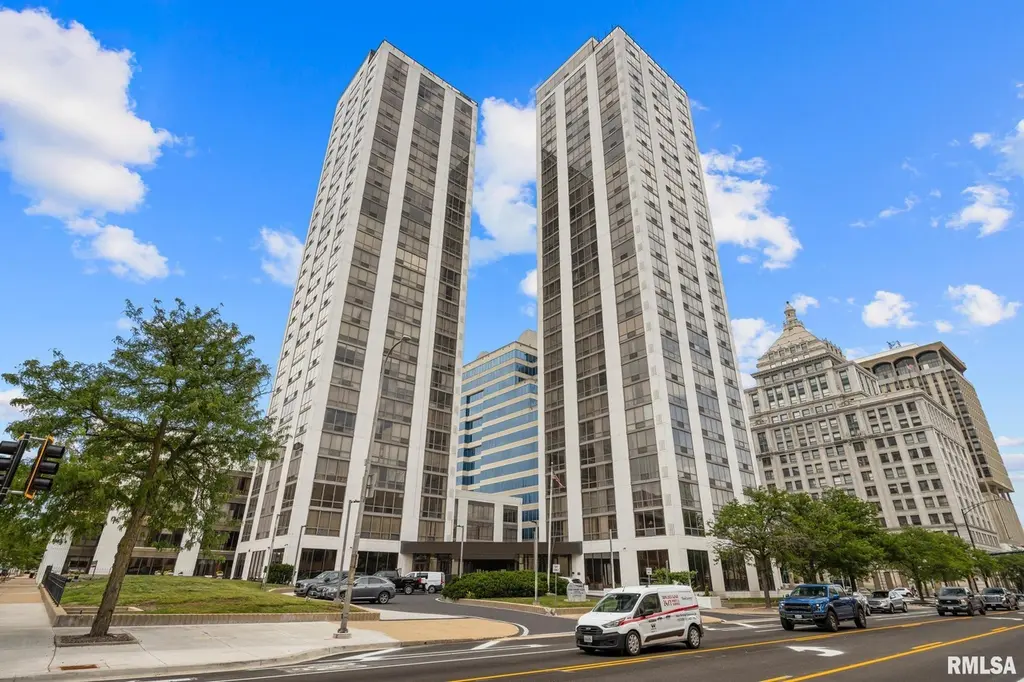
123 SW Jefferson Ave Unit E6W · Peoria, IL
Flood risk No data
- FEMA flood zone
- —
- Chance of flooding over 30 yrs
- —
- Est. flood insurance / yr
- —
Fire risk No data
- Est. fire insurance / yr
- —
Heat risk No data
- Hot days now (above threshold)
- —
- Hot days in 30 yrs
- —
Wind risk No data
- Chance of severe wind over 30 yrs
- —
Air-quality risk No data
- Unhealthy air days now
- —
- Unhealthy air days in 30 yrs
- —
Risk factors via First Street. Map © Google.
Why this score? — see what drove the B grade
The composite is a weighted blend of 9 inputs, each scored 0–100. Each bar is that input's sub-score; the figure is the points it added to the 100-point composite (weight × sub-score).
- Cash flow +30.0/30.0
- 1% rule +10.0/10.0
- DSCR +10.0/10.0
- ARV discount +7.5/15.0
- Condition / age +3.8/5.0
- Livability +3.7/5.0
- Appreciation +3.0/10.0
- Rent growth +2.5/5.0
- Schools +1.1/10.0
$69,900
🖨 Deal sheet 📄 Offer letter ✓ Due diligence
Listing remarks
City views, natural light, and a location that puts you in the center of it all! This 6th-floor Twin Towers condo offers 792 square feet of comfortable living with an open-concept kitchen and living area designed to maximize both space and views. Floor-to-ceiling windows flood the home with sunlight and create a stunning backdrop day and night. The spacious bedroom includes a walk-in closet, while the unbeatable downtown Peoria location keeps restaurants, shopping, medical facilities, and Caterpillar just minutes away. Easy living with a view what's not to love?
Key facts
- Open-concept kitchen
- Walk-in closet
- Natural light
Tags
Property features AI
Finance
- Other: Subdivision: Twin Towers; Directions: Corner of Jefferson and Fulton
- HOA & community: Association fee $316; HOA covers grounds maintenance, snow removal, common area maintenance, structure maintenance, security, trash, and lawn care
Exterior
- Parking: Parking garage (no dedicated garage spaces listed)
- Security: Community security included in association services
- Utilities: Public water; Public sewer
- Home design: Attached property; Residential zoning; 4 total stories (unit occupies 1 story); Year built 1984
- Construction: Built in 1984
- Exterior features: Other-style roof; Paved road access; Level lot
Interior
- Kitchen: Kitchen on main level
- Bedrooms: 1 bedroom (main level)
- Flooring: Luxury vinyl plank flooring in main living areas and bedroom
- Bathrooms: 1 full bathroom
- Heating & cooling: Central air conditioning; Electric heating; Electric water heater
- Interior features: Dishwasher; Refrigerator; No fireplace
Neighborhood map
What this means for you Summary
Snapshot
- This is a 1-bed/1.0-bath condo listed at $70k. Condition is rated good.
Deal economics
- At list price, monthly cash flow is $290 ($3k/yr) — positive.
- The deal already cash-flows at list — no discount required.
- Meets the 1% rule at list price ($1k rent vs $70k).
- Cap rate 11.3% vs local median 5.6% in Peoria — top-decile yield for the area; either an underpriced asset or a hidden risk that comps aren't pricing in. Stress-test before assuming the spread holds.
Location & tenants
- Location reads 73/100 on livability (#270 in IL) — a middle-class / working-renter tenant base. Strengths: commute A+, cost of living A+, housing A+; Watch: employment D+, crime F.
- Peoria SD 150 (urban): math 11% / reading 14% proficiency, ranked #554 of 620 in IL (top 89%) — low school quality limits family demand, transient renter base, plan for 1-2y turnover; 70% free/reduced lunch — lower-income household profile, screen leases tightly.
- Zoned schools: Manual High School (math 2% / reading 2%, grade F, #659 of 693 statewide, top 100%, 656 students, 0% FRL) — zoned schools average 0% FRL vs 70% district-wide (70 pts lower); this property's tenant base skews higher-income than the district average.
- Market conditions: 28 active listings in the ZIP; 17 comparable units currently listed for rent nearby; rentals leasing fast (median 14d on market — plan ~1-2 weeks tenant-placement turnaround); 73 units permitted in Peoria County in 2024 (0 in 5+ unit buildings).
Forward outlook
- Local home prices are declining (-3.0%/yr); year-one equity from $483 of loan paydown is wiped out by about $2k of value loss. Plan a longer hold.
- Peoria County population projected at -11% by 2050 — secular population decline; favor cash flow + early exit over multi-decade hold.
- At projected returns (-3.0% appreciation + 3.0% rent growth), your $20k cash investment doubles in ~7 years — after that, you're playing with house money.
Negotiation context
- Only 3 days on market — expect competitive offers; lowballing is unlikely to land.
- 2 sale attempts; this cycle's ask is 17% above the opening price — seller raised mid-cycle; expect resistance to lowballs.
Risks & watch-outs
- Watch-outs: HOA is 23% of rent.
Questions for the listing agent
- What does the HOA fee cover, when was the last increase, and are there any pending special assessments or reserve-fund shortfalls?
- Any open or pending special assessments — roof, HVAC, plumbing, elevator, façade? What's the per-unit balance and payoff schedule, and is the seller paying it off at close or rolling it to the buyer?
- Is there a deadline driving the sale (1031 exchange, divorce, estate, relocation)? That informs how much negotiation room exists.
- Schools are F-rated, which usually means shorter tenancies and higher turnover. Who's the typical renter profile here, and what's been the actual vacancy rate?
- Crime grade is F in this area — have there been break-ins, vandalism, or insurance claims at this property in the last 3 years? What carrier currently insures it and at what premium?
- What's the average days-on-market for RENTAL listings here right now (not sales)? A rising rental-DOM trend means longer vacancies and softer asking-rent achievability than the comps imply.
- What's the recent tenant-quality profile in this submarket — average credit score on applications, eviction rate, late-payment / NSF rate, and stable-employment percentage? A property-management company in the area should have these aggregated.
- How much new apartment / multifamily construction is in the pipeline within 1–3 miles? Heavy new supply (>2% of stock underway) typically softens rents 12–24 months out; light construction supports rent growth.
Investment metrics
- 1% rule
- 1.97% ✓
- Cap rate
- 11.27%
- Cash-on-cash
- 17.76%
- DSCR
- 1.79
- GRM
- 4.2
CMA / ARV
No comps found within radius.
Projected returns pro-forma
-3.0% appreciation · 3.0% rent growth · sell at horizon
- IRR
- 9.5%
- Equity multiple
- 1.37×
- Total profit
- $7,337
- Equity at exit
- $10,422
- IRR
- 18.8%
- Equity multiple
- 2.58×
- Total profit
- $31,019
- Equity at exit
- $6,044
Cash invested: $19,572 (down + closing). Projections, not guarantees.
Landlord ↔ Tenant lean methodology
- Overall (STATE)
- 43 Moderately Tenant-Leaning
- State Illinois
- 43 Moderately Tenant-Leaning · D+7
- County
- — inherits STATE
- City
- — inherits STATE
ZIP-level market 61602
- Home prices YoY
- -4.9%
- Active inventory
- 28
- Price-to-rent
- 4.2×
Monthly cashflow live
- Estimated rent
- $1,378 high interval (Pro) →
- Mortgage (P&I)
- −$367
- Tax est. 1.5%
- −$87 /mo · $1,048/yr
- Insurance
- −$29
- HOA
- −$316
- Vacancy / Maint / Mgmt
- −$289
- Net cashflow
- $290
Break-even live
UW: 25.0% down · 7.5% · 30yr · 1.5% tax · 5.0% vac · 8.0% maint · 8.0% mgmt
Financing live
Cash to close
- Down payment
- $17,475
- Closing costs
- $2,097
- Reserves months
- —
- Total cash needed
- —
Loan-product check · same deal, 3 products live
Conventional
25% down · 7.5% · 30yr
- Down + closing
- —
- Monthly P&I
- —
- Monthly cashflow
- —
- DSCR
- —
- Eligible?
- —
Personal DTI + credit; lowest rate.
DSCR
20% down · 8.5% · 30yr
- Down + closing
- —
- Monthly P&I
- —
- Monthly cashflow
- —
- DSCR
- —
- Eligible?
- —
No personal income docs; deal must DSCR.
Hard money
10% down · 12.0% · 12mo
- Down + closing
- —
- Monthly P&I
- —
- Monthly cashflow
- —
- DSCR
- —
- Eligible?
- —
Short-term bridge; refi at stabilization.
Rent comps 17 comps
| Address | Beds | Baths | Sqft | Rent | $/sqft | DOM | Units | Dist |
|---|---|---|---|---|---|---|---|---|
| 123 SW Jefferson Ave Unit E15SW Peoria, IL | 2.0 | 2.0 | 1100 | $1,750 | $1.59 | 13d | 1 | 0.01mi |
| 123 SW Jefferson Ave Unit E6W Peoria, IL | 2.0 | 1.0 | 868 | $1,495 | $1.72 | 21d | 1 | 0.01mi |
| 311 SW Water St Unit 301 Peoria, IL | 1.0 | 1.0 | 635 | $1,300 | $2.05 | 43d | 1 | 0.34mi |
| 100 Walnut St Peoria, IL | 2.0 | 2.0 | 1102 | $2,000 | $1.81 | 13d | 1 | 0.47mi |
| 416 W Main St Unit A Peoria, IL | 2.0 | 1.0 | 1050 | $950 | $0.90 | 43d | 1 | 0.61mi |
| 812 SW Washington St Unit 2 Peoria, IL | 2.0 | 1.0 | 700 | $1,275 | $1.82 | 13d | 1 | 0.65mi |
| 812 SW Washington St Peoria, IL | 2.0 | 1.0 | 640 | $1,200 | $1.88 | 13d | 1 | 0.65mi |
| 905 N Sheridan Rd Unit F Peoria, IL | 1.0 | 1.0 | 650 | $900 | $1.38 | 43d | 1 | 0.73mi |
| 911 N Sheridan Rd Unit A4 Peoria, IL | 2.0 | 1.0 | 825 | $850 | $1.03 | 43d | 1 | 0.73mi |
| 911 N Sheridan Rd Unit a1 Peoria, IL | 2.0 | 1.0 | 825 | $850 | $1.03 | 13d | 1 | 0.73mi |
| 511 W Elizabeth St Unit A Peoria, IL | 1.0 | 1.0 | 850 | $800 | $0.94 | 43d | 1 | 0.81mi |
| 1505 N Peoria Ave Peoria, IL | 1.0 | 1.0 | 525 | $1,006 | $1.92 | 13d | 4 | 0.86mi |
| 214 Pecan St Peoria, IL | 2.0 | 1.0 | 1050 | $1,595 | $1.52 | 13d | 1 | 0.95mi |
| 1220 W John H Gwynn Jr Ave Peoria, IL | 2.0 | 1.0 | 853 | $745 | $0.87 | 21d | 1 | 1.14mi |
| 506 Caroline St Unit B Peoria, IL | 2.0 | 1.0 | 1000 | $900 | $0.90 | 13d | 1 | 1.21mi |
| 1401 W Adrian G Hinton Ave Peoria, IL | 2.0 | 1.0 | 1100 | $775 | $0.70 | 43d | 1 | 1.22mi |
| 1703 N Valley Ave Peoria, IL | 2.0 | 1.0 | 676 | $1,200 | $1.78 | 13d | 1 | 1.46mi |
HOA detail condo
- Monthly dues
- $316 · $3,792/yr
- Assessments
- None detected in remarks — confirm with the listing agent.
Listing history 4 events
-
2026-06-18days on market $69,900 Active 3 DOM
-
2026-06-17days on market $69,900 Active 2 DOM
-
2026-06-16remarks 568-char remark
-
2026-06-16$69,900 Active 1 DOM
ⓘ Source: listings_history table (triggers on properties + properties_extension) + one-shot
backfill from property_details.listing_events for pre-trigger history.
Nearby sold comps map
Loading sold comps map…
Walkable amenities ~0.75 mi
Loading nearby amenities…
Taxation est. · year 1
- Rental income
- $16,538
- − Mortgage interest
- −$3,915
- − Property taxes
- −$1,048
- − Insurance
- −$350
- − Repairs & maintenance
- −$1,323
- − Management
- −$1,323
- − HOA
- −$3,792
- − Depreciation
- −$2,033
- Taxable income
- $2,753
- Est. tax owed @ 24.0%
- −$661
- After-tax cash flow
- $2,815/yr
For passive investors: Depreciation is non-cash, so a rental often shows a tax loss while cash-flowing — sheltering income. Rental losses are passive: they offset passive income freely, and up to $25,000/yr can offset ordinary (W-2) income if you actively participate and your MAGI is under $100k (phasing out to $0 by $150k); unused losses carry forward. On sale, claimed depreciation is recaptured at up to 25%, and gains may owe capital-gains tax (a 1031 exchange can defer both). Figures are a year-1 estimate at your 24.0% rate — not tax advice; consult a CPA.
Condition & rehab AI · 13 photos
This 6th-floor condo offers a good condition with a good roof and exterior. However, a major repair is needed for the roof and some maintenance is required for the exterior. Painting the exterior and replacing the roof would significantly increase its value.
Repairs flagged
- Major Roof — Significant rust and wear
- Minor Landscaping — Some areas of grass appear dry
Value-add opportunities
- Both Paint exterior — Enhances curb appeal and value
- Both Replace roof — Critical for long-term durability and value
Renovation cost estimate screening
| Repair item | Severity | Est. cost |
|---|---|---|
| Roof · Significant rust and wear | Major | $15,000–50,000 |
| Landscaping · Some areas of grass appear dry | Minor | $500–3,000 |
| Total estimated repair cost · 2 items | $15,500–53,000 |
Value-add ROI direction
- Both Paint exterior — Enhances curb appeal and value ↑
- Both Replace roof — Critical for long-term durability and value ↑
ⓘ Cost ranges are severity-bucket heuristics (US national rule-of-thumb). Get contractor quotes + a written scope before underwriting a rehab budget.
Schools (NCES district)
- District
- Peoria SD 150
- NCES district ID
- 1731230
- Math proficiency
- 11% ▼ -5.00%
- Reading proficiency
- 14% ▼ -4.00%
- Median HH income
- $41,951
- Composite
- 10.92/100
- National rank
- #9751
- State rank
- #554 of 620 in IL
Livability — Peoria
- Score
- 73/100
- State rank
- #270
- US rank
- #5096
Category grades
Schools grade is shown separately in the Schools card above.
Census & demographics
- Census place
- Peoria, IL
- City population
- 114,670
- Population (ZIP)
- 977
Population outlook (Peoria County) Hauer SSP2
- Today (2025)
- 183,007 people
- By 2030
- 179,643 · -1.8%
- By 2040
- 171,782 · -6.1%
- By 2050
- 163,508 · -10.7%
- By 2075
- 140,178 · -23.4%
- By 2100
- 114,493 · -37.4%
Race, ethnicity, and origin ACS 2023
- Neighborhood character
- Diverse neighborhood (Simpson 0.59)
- Race & ethnicity
- White 60% Hispanic / Latino 17% Black 13% Two or more races 13% Asian 2%
- Hispanic origin (detail)
- Mexican 4% Dominican 3%
- Common ancestry
- Romanian 4% Slovak 4% Portuguese 3%
- Foreign-born
- 12% · Canada, Jamaica
- Languages at home
- 81% English-only · Spanish 16% French/Haitian/Cajun 2% Chinese 1%
Political lean MEDSL · Peoria
- 2024 margin
- Toss-up / Even · D 51.5% · R 46.9% · Other 1.6%
- 2008→2024 swing
- -9.2pp toward R · 2008: 13.9pp · 2024: 4.7pp
- All cycles
- 2024: D+4.7 2020: D+6.3 2016: D+2.8 2012: D+4.4 2008: D+13.9
Not yet ingested
- Civics
- —
Market trends
- HPI YoY
- ▼ -4.01%
- Current HPI
- 77.5295
- Rent YoY
- —
- Metro
- —
- State GDP YoY
- ▲ 1.59%
- F500 in state
- 60
Industry mix (Fortune 500 HQ in IL)
| Industry | F500 HQs | Revenue |
|---|---|---|
| Insurance | 4 | $201B |
|
||
| Consumer Goods | 4 | $87B |
|
||
| Industrial Machinery | 3 | $64B |
|
||
| Healthcare | 2 | $55B |
|
||
| Retail / Pharmacy | 1 | $148B |
|
||
| Agriculture / Food | 1 | $86B |
|
||
Price history
+4575.6% since first listed4 events — show timeline
- 2026-06-16 Price Changed $69,900 RMLSA as Distributed by MLS Grid
- 2026-06-15 Listed $59,900 RMLSA as Distributed by MLS Grid
- 2026-06-06 Rental Removed $1,495 RMLSA
- 2026-05-12 Listed for Rent $1,495 RMLSA
Cash-flow waterfall
monthlySold comps — $/sqft
last 12 mo · ≤1 miLoading sold comps…