 Triplex
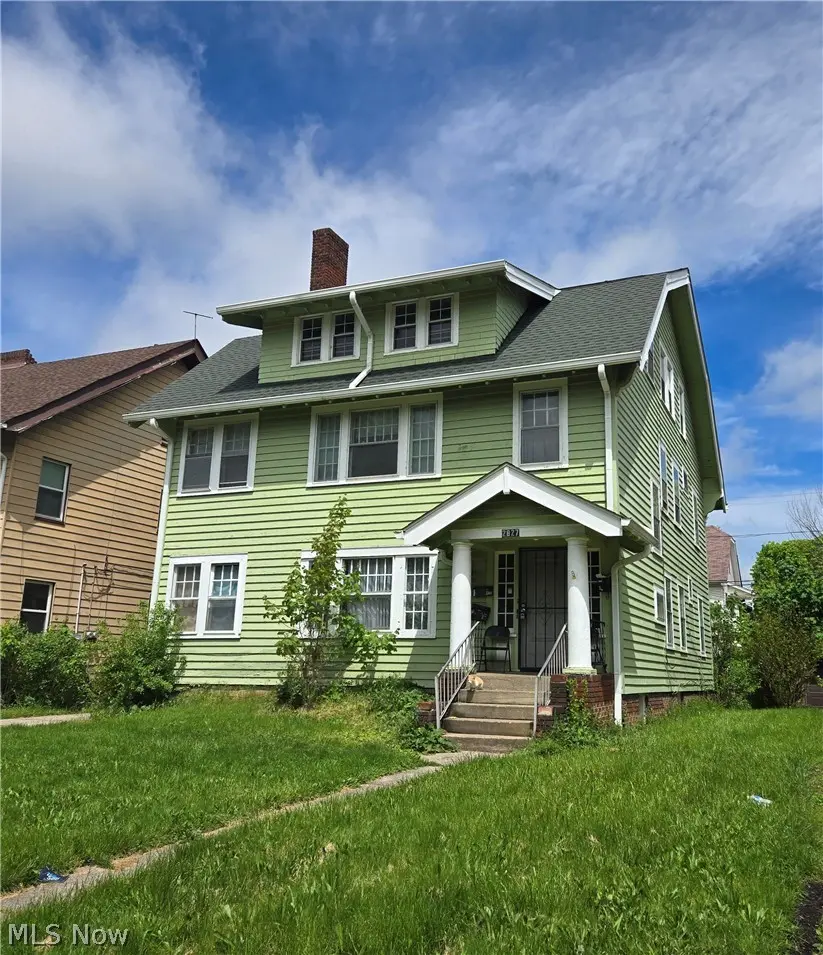
2827 Avondale Ave · Cleveland Heights, OH
Flood risk 1/10 · Minimal
- FEMA flood zone
- X (unshaded)
- Chance of flooding over 30 yrs
- 0.0%
- Est. flood insurance / yr
- $507 – $1,088
Fire risk 1/10 · Minimal
- Est. fire insurance / yr
- $713 – $1,323
Heat risk 3/10 · Minor
- Hot days now (above 95°F)
- 7 days/yr
- Hot days in 30 yrs
- 17 days/yr
Wind risk 1/10 · Minimal
- Chance of severe wind over 30 yrs
- —
Air-quality risk 3/10 · Minor
- Unhealthy air days now
- 3 days/yr
- Unhealthy air days in 30 yrs
- 5 days/yr
Risk factors via First Street. Map © Google.
Why this score? — see what drove the C+ grade
The composite is a weighted blend of 9 inputs, each scored 0–100. Each bar is that input's sub-score; the figure is the points it added to the 100-point composite (weight × sub-score).
- Cash flow +26.1/30.0
- 1% rule +9.0/10.0
- DSCR +8.8/10.0
- ARV discount +6.1/15.0
- Livability +4.5/5.0
- Rent growth +3.9/5.0
- Schools +2.8/10.0
- Condition / age +2.5/5.0
- Appreciation +0.0/10.0
$289,900
🖨 Deal sheet 📄 Offer letter ✓ Due diligence
Multi-family units
County records classify this as Multi-Family (2-4 Unit). Listing-text estimate: 3 units. confirmed
Listing remarks MLS
Cleveland Heights duplex with finished 3rd floor in walking distance to Coventry Village!! This is a rare opportunity to get one of these properties in your portfolio! 1st floor is rented through December 2023 for $1195. 2nd floor is rented through January 2024 for $1018. Third floor is rented through June 2024 for $690. This property can be purchased along with other properties that are part of a 27-property portfolio and which offers a mixture of 1-3 unit properties. Portfolio list is available upon request. POS is scheduled for 6/2. Seller prefers that Buyer assumes any violations.
Key facts
- Immediate cash flow
- Recent updates
- New flooring
Tags
Property features AI
Finance
- Other: Single building on the lot; Lot size approximately 0.142 acres; Above-grade finished area reported as 4,200
- Financial info: Owner pays water and sewer
- HOA & community: HOA information not provided
Exterior
- Parking: 2-car garage
- Security: Security information not provided
- Utilities: Public water; Public sewer
- Home design: Property type information not provided; Year built sourced from public records
- Construction: Aluminum, vinyl, and wood siding; Asphalt/fiberglass roof
- Exterior features: Paved parking areas
Interior
- Kitchen: Kitchen details not provided
- Bedrooms: Bedrooms information not provided
- Flooring: Flooring information not provided
- Bathrooms: Three full bathrooms
- Heating & cooling: Forced air heating (gas)
- Interior features: Full unfinished basement
- Laundry & utility: Laundry located in a common area
Neighborhood map
What this means for you Summary
Snapshot
- This is a 3 × 2-bed/1.0-bath units multifamily listed at $290k.
Deal economics
- At list price, monthly cash flow is $732 ($9k/yr) — positive. Per door: $244/mo.
- The deal already cash-flows at list — no discount required.
- Meets the 1% rule at list price ($4k rent vs $290k).
- Cap rate 9.3% vs local median 4.4% in Cleveland Heights — top-decile yield for the area; either an underpriced asset or a hidden risk that comps aren't pricing in. Stress-test before assuming the spread holds.
Location & tenants
- Location reads 89/100 on livability (#12 in OH, #124 nationally) — a professional / high-income tenant draw. Strengths: amenities A+, commute A+, cost of living A+.
- Cleveland Heights-University Heights City (suburban): math 23% / reading 41% proficiency, ranked #568 of 656 in OH (top 87%) — families likely to look elsewhere, expect single-tenant / working-renter base with shorter leases; 64% free/reduced lunch — lower-income household profile, screen leases tightly.
- Market conditions: Rents rising fast (+5.7%/yr); 253 active listings in the ZIP; 1 comparable units currently listed for rent nearby; solid renter incomes; 1,441 units permitted in Cuyahoga County in 2024 (700 in 5+ unit buildings).
- At $4,058/mo this rent would consume 63% of the median local household income ($78k/yr) (locally 1847% of renters already pay >50% of income on rent) — very limited rent-growth headroom before tenants either downsize or default.
Forward outlook
- Local home prices are declining (-3.0%/yr); year-one equity from $2k of loan paydown is wiped out by about $9k of value loss. Plan a longer hold.
- Cuyahoga County population projected to shrink 8% by 2050 — rents likely to lag national; underwrite the cash flow, not the appreciation.
- At projected returns (-3.0% appreciation + 5.7% rent growth), your $81k cash investment doubles in ~8 years — after that, you're playing with house money.
Negotiation context
- Only 13 days on market — expect competitive offers; lowballing is unlikely to land.
- 5 sale attempts since 3y ago with the ask held roughly flat each time — persistent listings suggest the price (not the market) is what's stuck; bring a comps-based counter.
Risks & watch-outs
- Watch-outs: property tax is 3.4% of price; built in 1920 — expect roof / HVAC / electrical / plumbing capex.
Questions for the listing agent
- Can we see the unit-by-unit rent roll, current vacancy, and any below-market leases? What's the average tenancy length?
- What capital expenditures (roof, boiler, parking lot, exteriors) have been made in the last 5 years, and what's planned in the next 2?
- Built in 1920 — when were the roof, HVAC, electrical panel, plumbing, and water heater last replaced?
- Property tax is high relative to price — has the assessment been appealed recently, and will the sale trigger a re-assessment?
- Is there a deadline driving the sale (1031 exchange, divorce, estate, relocation)? That informs how much negotiation room exists.
- Schools are A-rated — typically a magnet for longer-tenancy family renters. What's the average tenant stay here, and is there a school-zone premium baked into asking?
- What's the average days-on-market for RENTAL listings here right now (not sales)? A rising rental-DOM trend means longer vacancies and softer asking-rent achievability than the comps imply.
- What's the recent tenant-quality profile in this submarket — average credit score on applications, eviction rate, late-payment / NSF rate, and stable-employment percentage? A property-management company in the area should have these aggregated.
- How much new apartment / multifamily construction is in the pipeline within 1–3 miles? Heavy new supply (>2% of stock underway) typically softens rents 12–24 months out; light construction supports rent growth.
Investment metrics
- 1% rule
- 1.40% ✓
- Cap rate
- 9.32%
- Cash-on-cash
- 10.82%
- DSCR
- 1.48
- GRM
- 6.0
CMA / ARV
- ARV (on-the-fly)
- $281,400
- Comps found
- 2
Show comp detail 2 sales within ~0.75 mi
| Address | Dist | Beds/Ba | Sqft | Sold | Price | $/sf | Match |
|---|---|---|---|---|---|---|---|
| 14265 Superior Rd | 0.38mi | 6/4.0 | 4,737 (+13%) | 22mo | $299,900 | $63 | 38 |
| 1558 Ivydale Rd | 0.74mi | 7/3.0 (+1) | 3,696 (-12%) | 3mo | $249,000 | $67 | 38 |
Match score weights: distance 35% · size 25% · config 20% · recency 20%. Top-matched comps best support the ARV.
Projected returns pro-forma
-3.0% appreciation · 5.7% rent growth · sell at horizon
- IRR
- 3.5%
- Equity multiple
- 1.14×
- Total profit
- $11,301
- Equity at exit
- $43,225
- IRR
- 15.8%
- Equity multiple
- 2.48×
- Total profit
- $120,379
- Equity at exit
- $25,065
Cash invested: $81,172 (down + closing). Projections, not guarantees.
Landlord ↔ Tenant lean methodology
- Overall (STATE)
- 73 Landlord-Friendly
- State Ohio
- 73 Landlord-Friendly · R+6
- County
- — inherits STATE
- City
- — inherits STATE
ZIP-level market 44118
- Rents YoY
- 5.7%
- Active inventory
- 253
- Price-to-rent
- 17.9×
Monthly cashflow live
- Estimated rent
- $4,058 high interval (Pro) →
- Mortgage (P&I)
- −$1,520
- Tax from tax record
- −$833 /mo · $9,996/yr
- Insurance
- −$121
- HOA
- −$0
- Vacancy / Maint / Mgmt
- −$852
- Net cashflow
- $732
Break-even live
3-unit breakdown (identical units grouped — click to expand)
| Units | Beds | Baths | Est. rent |
|---|---|---|---|
| 3× units | 2 | 1 | $4,059 |
| #1 | 2 | 1 | $1,353 |
| #2 | 2 | 1 | $1,353 |
| #3 | 2 | 1 | $1,353 |
| Total (3 units) | $4,058 | ||
UW: 25.0% down · 7.5% · 30yr · 1.5% tax · 5.0% vac · 8.0% maint · 8.0% mgmt
Financing live
Cash to close
- Down payment
- $72,475
- Closing costs
- $8,697
- Reserves months
- —
- Total cash needed
- —
Loan-product check · same deal, 3 products live
Conventional
25% down · 7.5% · 30yr
- Down + closing
- —
- Monthly P&I
- —
- Monthly cashflow
- —
- DSCR
- —
- Eligible?
- —
Personal DTI + credit; lowest rate.
DSCR
20% down · 8.5% · 30yr
- Down + closing
- —
- Monthly P&I
- —
- Monthly cashflow
- —
- DSCR
- —
- Eligible?
- —
No personal income docs; deal must DSCR.
Hard money
10% down · 12.0% · 12mo
- Down + closing
- —
- Monthly P&I
- —
- Monthly cashflow
- —
- DSCR
- —
- Eligible?
- —
Short-term bridge; refi at stabilization.
Rent comps 1 comps
| Address | Beds | Baths | Sqft | Rent | $/sqft | DOM | Units | Dist |
|---|---|---|---|---|---|---|---|---|
| 2501 Euclid Heights Blvd Cleveland, OH | 6.0 | 5.0 | 3000 | $3,600 | $1.20 | 16d | 1 | 0.95mi |
Listing history 10 events
-
2026-06-18price $289,900 Active 13 DOM
-
2026-06-18days on market $299,900 Active 13 DOM
-
2026-06-17days on market $299,900 Active 12 DOM
-
2026-06-16days on market $299,900 Active 11 DOM
-
2026-06-15days on market $299,900 Active 10 DOM
-
2026-06-13days on market $299,900 Active 8 DOM
-
2026-06-09days on market $299,900 Active 4 DOM
-
2026-06-08days on market $299,900 Active 3 DOM
-
2026-06-07remarks 699-char remark
-
2026-06-07$299,900 Active 2 DOM
ⓘ Source: listings_history table (triggers on properties + properties_extension) + one-shot
backfill from property_details.listing_events for pre-trigger history.
Tax reassessment forecast OH · Partial reset (capped growth)
- Current annual tax
- $9,996 · $833/mo
- Projected year-2 tax
- $9,996 · $833/mo
- Expected delta
- $0/yr ($0/mo · 0.0%)
ⓘ Screening estimate from a state-policy table — verify with the county assessor before closing.
Climate risk First Street
- Flood 1/10 Low FEMA zone X (unshaded) · 0% chance over 30 yrs
- Wildfire 1/10 Low
- Heat 3/10 Moderate 7 d/yr ≥95°F today · 17 d/yr by 30 yrs out
- Wind 1/10 Low
- Air quality 3/10 Moderate 3 unhealthy d/yr today · 5 by 30 yrs out
Nearby sold comps map
Loading sold comps map…
Walkable amenities ~0.75 mi
Loading nearby amenities…
Taxation est. · year 1
- Rental income
- $48,696
- − Mortgage interest
- −$16,239
- − Property taxes
- −$9,996
- − Insurance
- −$1,450
- − Repairs & maintenance
- −$3,896
- − Management
- −$3,896
- − Depreciation
- −$8,433
- Taxable income
- $4,787
- Est. tax owed @ 24.0%
- −$1,149
- After-tax cash flow
- $7,632/yr
For passive investors: Depreciation is non-cash, so a rental often shows a tax loss while cash-flowing — sheltering income. Rental losses are passive: they offset passive income freely, and up to $25,000/yr can offset ordinary (W-2) income if you actively participate and your MAGI is under $100k (phasing out to $0 by $150k); unused losses carry forward. On sale, claimed depreciation is recaptured at up to 25%, and gains may owe capital-gains tax (a 1031 exchange can defer both). Figures are a year-1 estimate at your 24.0% rate — not tax advice; consult a CPA.
Schools (NCES district)
- District
- Cleveland Heights-University Heights City
- NCES district ID
- 3904379
- Math proficiency
- 23% ▼ -22.00%
- Reading proficiency
- 41% ▼ -12.00%
- Median HH income
- $53,451
- Composite
- 28.12/100
- National rank
- #6822
- State rank
- #568 of 656 in OH
Livability — Cleveland Heights
- Score
- 89/100
- State rank
- #12
- US rank
- #124
Category grades
Schools grade is shown separately in the Schools card above.
Census & demographics
- Census place
- Cleveland Heights, OH
- County
- Cuyahoga County · 1,090,369 people
- City population
- 32,312
- Metro
- Cleveland-Elyria, OH
- Population (ZIP)
- 40,715
- Household income
- $77,555
- Rent vs Own
- Severe rent burden
- 1847.0
Population outlook (Cuyahoga County) Hauer SSP2
- Today (2025)
- 1,244,621 people
- By 2030
- 1,230,093 · -1.2%
- By 2040
- 1,189,108 · -4.5%
- By 2050
- 1,145,706 · -7.9%
- By 2075
- 1,076,557 · -13.5%
- By 2100
- 978,987 · -21.3%
Race, ethnicity, and origin ACS 2023
- Neighborhood character
- Diverse neighborhood (Simpson 0.56)
- Race & ethnicity
- White 57% Black 33% Two or more races 4% Asian 3% Hispanic / Latino 2%
- Common ancestry
- Romanian 4% Scotch-Irish 2% Italian 2%
- Foreign-born
- 6% · Canada, China
- Languages at home
- 92% English-only · Spanish 2% Russian/Polish/Slavic 1% Other Indo-European 1%
Political lean MEDSL · Cuyahoga
- 2024 margin
- Solid D (+31.5) · D 65.4% · R 33.9%
- 2008→2024 swing
- -7.4pp toward R · 2008: 38.9pp · 2024: 31.5pp
- All cycles
- 2024: D+31.5 2020: D+34.1 2016: D+35.0 2012: D+38.7 2008: D+38.9
Not yet ingested
- Civics
- —
Market trends
- HPI YoY
- ▼ -319.62%
- Current HPI
- 204.5504
- Rent YoY
- ▲ 5.70%
- Metro
- Cleveland-Elyria, OH
- State GDP YoY
- ▲ 1.98%
- F500 in state
- 48
Industry mix (Fortune 500 HQ in OH)
| Industry | F500 HQs | Revenue |
|---|---|---|
| Insurance | 3 | $145B |
|
||
| Industrial Machinery | 3 | $49B |
|
||
| Financial Services | 3 | $24B |
|
||
| Consumer Goods | 2 | $93B |
|
||
| Aerospace / Defense | 2 | $47B |
|
||
| Utilities | 2 | $33B |
|
||
Price history
+272.5% since first listed14 events — show timeline
- 2026-06-05 Listed $299,900 MLSNOW
- 2024-03-30 Rental Removed $1,275 APPFOLIO
- 2024-03-26 Listed for Rent $1,275 APPFOLIO
- 2024-03-22 Rental Removed $875 APPFOLIO
- 2024-03-13 Rental Removed $875 APPFOLIO
- 2024-03-13 Listed for Rent $875 APPFOLIO
- 2024-01-30 Listed for Rent $1,275 APPFOLIO
- 2023-08-22 Sold (Public Records) $260,000 Public Records
- 2023-08-21 Sold (MLS) $260,000 MLSNOW
- 2023-07-18 Pending — MLSNOW
- 2023-05-27 Contingent — MLSNOW
- 2023-05-09 Listed $265,000 MLSNOW
- 2022-02-16 Price Changed $875 RENT.
- 2020-09-14 Sold (Public Records) $80,500 Public Records
Property tax history
+7.0%/yrLatest (2025): $9,996 · +8.9% YoY. Source: county tax records.
Cash-flow waterfall
monthlySold comps — $/sqft
last 12 mo · ≤1 miLoading sold comps…