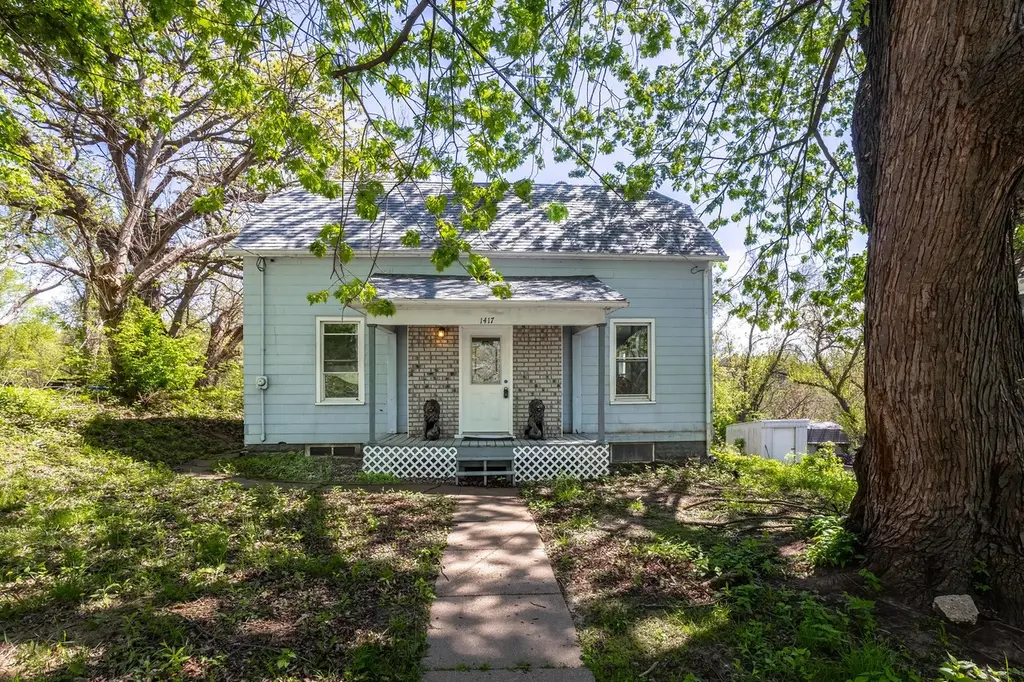
1417 Belle Ave · Davenport, IA
Flood risk 1/10 · Minimal
- FEMA flood zone
- X (unshaded)
- Chance of flooding over 30 yrs
- 0.0%
- Est. flood insurance / yr
- $473 – $860
Fire risk 1/10 · Minimal
- Est. fire insurance / yr
- $902 – $1,676
Heat risk 3/10 · Minor
- Hot days now (above 103°F)
- 7 days/yr
- Hot days in 30 yrs
- 16 days/yr
Wind risk 2/10 · Minimal
- Chance of severe wind over 30 yrs
- —
Air-quality risk 3/10 · Minor
- Unhealthy air days now
- 2 days/yr
- Unhealthy air days in 30 yrs
- 3 days/yr
Risk factors via First Street. Map © Google.
Why this score? — see what drove the C+ grade
The composite is a weighted blend of 9 inputs, each scored 0–100. Each bar is that input's sub-score; the figure is the points it added to the 100-point composite (weight × sub-score).
- Cash flow +21.6/30.0
- ARV discount +15.0/15.0
- DSCR +6.9/10.0
- 1% rule +6.0/10.0
- Livability +4.0/5.0
- Schools +3.9/10.0
- Rent growth +3.6/5.0
- Condition / age +2.5/5.0
- Appreciation +0.0/10.0
$150,000
🖨 Deal sheet 📄 Offer letter ✓ Due diligence
Listing remarks MLS
Move-in ready - all furnishings to remain (with accpetable offer) & waiting for you to make it home! This 4-bedroom home has had many recent updates and is located close to shopping, dining, recreation, & schools....plus only a few blocks from the historic East Village of Davenport, Iowa. The open concept of the combined dining & living area gives you room to gather & entertain many. The spacious kitchen offers plenty of cabinetry & countertop space to prep meals with plenty of space for the kitchen table as well. Enjoy the convenience of TWO main-floor bedrooms and an updated bath plus laundry hookups with a washer/dryer combo to stay. There is even a large family room that offers many options for use on the main level. Upstairs, you will find 2 additional bedrooms. The partially finished basement gives you space to expand with a recreation room and lots of storage space or space to finish as you choose. Relax in the large backyard with a deck that is also accessible from an alley entrance. UPDATES include: Roof 2022, High-Efficiency Furnace 2022 & AC 2023 Water Heater, Kitchen Countertops, Bathroom, Flooring, Light Fixtures, Front Porch & Rear Deck.
Key facts
- Recent updates
- Updated bath
- Open concept
Tags
Neighborhood map
What this means for you Summary
Snapshot
- This is a 4-bed/1.0-bath single-family listed at $150k.
Deal economics
- At list price, monthly cash flow is $227 ($3k/yr) — positive.
- The deal already cash-flows at list — no discount required.
- Meets the 1% rule at list price ($2k rent vs $150k).
- Recommended offer: $141k (6.0% below list) — sets the bar for market timing.
- Cap rate 8.1% vs local median 4.4% in Davenport — top-decile yield for the area; either an underpriced asset or a hidden risk that comps aren't pricing in. Stress-test before assuming the spread holds.
Location & tenants
- Location reads 79/100 on livability (#126 in IA, #2,312 nationally) — a middle-class / working-renter tenant base. Strengths: cost of living A+, housing A+, health & safety A+; Watch: employment C-, crime F.
- Davenport Community School District (urban): math 43% / reading 50% proficiency, ranked #288 of 289 in IA (top 100%) — families likely to look elsewhere, expect single-tenant / working-renter base with shorter leases.
- Market conditions: Rents rising fast (+4.6%/yr); 160 active listings in the ZIP; 4 comparable units currently listed for rent nearby; rentals lingering (median 44d on market — plan ~5-8 weeks vacancy on turnover, expect pricing pressure); 75% of comp listings sitting > 30 days — soft ceiling on asking rent; 805 units permitted in Scott County in 2024 (479 in 5+ unit buildings).
- This rent runs 31% of the median local income ($65k/yr) — at the standard rent-burdened threshold; future hikes will face affordability resistance.
Forward outlook
- Local home prices are declining (-3.0%/yr); year-one equity from $1k of loan paydown is wiped out by about $4k of value loss. Plan a longer hold.
- Scott County population projected at +19% by 2050 — long-run rental-demand tailwind backs the buy-and-hold thesis.
Negotiation context
- It's been on market 70 days — a 6% lower offer ($141k) is reasonable based on typical stale-listing flexibility.
- 4 sale attempts since 24y ago with the ask held roughly flat each time — persistent listings suggest the price (not the market) is what's stuck; bring a comps-based counter.
- Current owner paid $57k; list at $150k implies a 163% gain — meaningful room to come down on a strong offer.
Risks & watch-outs
- Watch-outs: built in 1900 — expect roof / HVAC / electrical / plumbing capex.
Questions for the listing agent
- It's been on market 70 days. Have you received any prior offers? Is the seller open to a 6% concession, seller financing, or rate buy-down credit?
- Built in 1900 — when were the roof, HVAC, electrical panel, plumbing, and water heater last replaced?
- Why hasn't it sold? Are there any deal-killer items the seller is aware of (foundation, flood, title, zoning, code violations)?
- Is there a deadline driving the sale (1031 exchange, divorce, estate, relocation)? That informs how much negotiation room exists.
- Crime grade is F in this area — have there been break-ins, vandalism, or insurance claims at this property in the last 3 years? What carrier currently insures it and at what premium?
- What's the average days-on-market for RENTAL listings here right now (not sales)? A rising rental-DOM trend means longer vacancies and softer asking-rent achievability than the comps imply.
- What's the recent tenant-quality profile in this submarket — average credit score on applications, eviction rate, late-payment / NSF rate, and stable-employment percentage? A property-management company in the area should have these aggregated.
- How much new for-sale + rental construction is in the pipeline within 1–3 miles? Heavy new supply typically softens prices + rents 12–24 months out; constrained supply supports both.
Investment metrics
- 1% rule
- 1.10% ✓
- Cap rate
- 8.11%
- Cash-on-cash
- 6.47%
- DSCR
- 1.29
- GRM
- 7.6
CMA / ARV
- ARV (median comp)
- $282,432
- List price
- $150,000
- Delta
- -46.89%
- Verdict
- UNDERPRICED
- Comps
- 20 within 1.0 mi
Show comp detail 12 sales within ~0.75 mi
| Address | Dist | Beds/Ba | Sqft | Sold | Price | $/sf | Match |
|---|---|---|---|---|---|---|---|
| 1515 Jersey Ridge Rd | 0.12mi | 4/2.5 | 1,779 (-3%) | 4mo | $112,000 | $63 | 81 |
| 2431 Fulton Ave | 0.23mi | 3/1.5 (-1) | 1,848 (+1%) | 1mo | $355,000 | $192 | 80 |
| 2107 E Locust St | 0.27mi | 4/1.5 | 1,761 (-4%) | 3mo | $162,000 | $92 | 76 |
| 2509 East St | 0.19mi | 3/3.0 (-1) | 1,865 (+2%) | 1mo | $280,000 | $150 | 74 |
| 1906 E 13th St | 0.30mi | 4/1.0 | 1,656 (-10%) | 2mo | $124,900 | $75 | 69 |
| 2304 Elm St | 0.49mi | 3/2.5 (-1) | 1,789 (-2%) | 3mo | $271,000 | $151 | 60 |
| 70 Crestwood Ter | 0.20mi | 3/2.5 (-1) | 2,060 (+12%) | 2mo | $315,000 | $153 | 57 |
| 1616 Esplanade Ave | 0.63mi | 3/1.0 (-1) | 1,976 (+8%) | 1mo | $85,000 | $43 | 51 |
| 1611 E High St | 0.59mi | 4/2.0 | 1,641 (-10%) | 2mo | $212,000 | $129 | 50 |
| 2003 E Rusholme St | 0.61mi | 4/2.0 | 1,663 (-9%) | 4mo | $292,500 | $176 | 49 |
| 2334 Elm St | 0.49mi | 3/2.0 (-1) | 1,627 (-11%) | 3mo | $237,000 | $146 | 47 |
| 2811 E 18th St St | 0.55mi | 3/2.0 (-1) | 1,600 (-13%) | 4mo | $245,000 | $153 | 41 |
Match score weights: distance 35% · size 25% · config 20% · recency 20%. Top-matched comps best support the ARV.
Projected returns pro-forma
-3.0% appreciation · 4.57% rent growth · sell at horizon
- IRR
- -4.5%
- Equity multiple
- 0.83×
- Total profit
- $-7,195
- Equity at exit
- $22,365
- IRR
- 7.0%
- Equity multiple
- 1.56×
- Total profit
- $23,673
- Equity at exit
- $12,969
Cash invested: $42,000 (down + closing). Projections, not guarantees.
Landlord ↔ Tenant lean methodology
- Overall (STATE)
- 83 Strongly Landlord-Friendly
- State Iowa
- 83 Strongly Landlord-Friendly · R+6
- County
- — inherits STATE
- City
- — inherits STATE
ZIP-level market 52803
- Home prices YoY
- -34.5%
- Rents YoY
- 4.6%
- Active inventory
- 160
- Price-to-rent
- 7.6×
Monthly cashflow live
- Estimated rent
- $1,643 medium interval (Pro) →
- Mortgage (P&I)
- −$787
- Tax from tax record
- −$223 /mo · $2,670/yr
- Insurance
- −$62
- HOA
- −$0
- Vacancy / Maint / Mgmt
- −$345
- Net cashflow
- $227
Break-even live
UW: 25.0% down · 7.5% · 30yr · 1.5% tax · 5.0% vac · 8.0% maint · 8.0% mgmt
Financing live
Cash to close
- Down payment
- $37,500
- Closing costs
- $4,500
- Reserves months
- —
- Total cash needed
- —
Loan-product check · same deal, 3 products live
Conventional
25% down · 7.5% · 30yr
- Down + closing
- —
- Monthly P&I
- —
- Monthly cashflow
- —
- DSCR
- —
- Eligible?
- —
Personal DTI + credit; lowest rate.
DSCR
20% down · 8.5% · 30yr
- Down + closing
- —
- Monthly P&I
- —
- Monthly cashflow
- —
- DSCR
- —
- Eligible?
- —
No personal income docs; deal must DSCR.
Hard money
10% down · 12.0% · 12mo
- Down + closing
- —
- Monthly P&I
- —
- Monthly cashflow
- —
- DSCR
- —
- Eligible?
- —
Short-term bridge; refi at stabilization.
Rent comps 4 comps
| Address | Beds | Baths | Sqft | Rent | $/sqft | DOM | Units | Dist |
|---|---|---|---|---|---|---|---|---|
| 1527 Fulton Ct Davenport, IA | 4.0 | 2.0 | 1850 | $1,775 | $0.96 | 44d | 1 | 0.44mi |
| 2220 E Lombard St Davenport, IA | 3.0 | 2.0 | 1500 | $1,620 | $1.08 | 44d | 1 | 0.54mi |
| 736 Federal St Davenport, IA | 1.0–3.0 | 1.0–2.0 | 1186 | $1,868 | $1.57 | 21d | 1 | 1.21mi |
| 616 E 6th St Davenport, IA | 4.0 | 1.0 | 1578 | $1,712 | $1.08 | 44d | 1 | 1.29mi |
Listing history 25 events
-
2026-06-18days on market $150,000 Active 70 DOM
-
2026-06-17days on market $150,000 Active 69 DOM
-
2026-06-16days on market $150,000 Active 68 DOM
-
2026-06-15days on market $150,000 Active 67 DOM
-
2026-06-14days on market $150,000 Active 65 DOM
-
2026-06-13days on market $150,000 Active 64 DOM
-
2026-06-10days on market $150,000 Active 62 DOM
-
2026-06-09days on market $150,000 Active 61 DOM
-
2026-06-08days on market $150,000 Active 60 DOM
-
2026-06-07days on market $150,000 Active 59 DOM
-
2026-06-03days on market $150,000 Active 55 DOM
-
2026-06-02days on market $150,000 Active 54 DOM
-
2026-06-01days on market $150,000 Active 53 DOM
-
2026-05-31days on market $150,000 Active 52 DOM
-
2026-05-30days on market $150,000 Active 51 DOM
-
2026-04-09$150,000 Active 1198-char remark
Show marketing remark (1198 chars)
Move-in ready - all furnishings to remain (with accpetable offer) & waiting for you to make it home! This 4-bedroom home has had many recent updates and is located close to shopping, dining, recreation, & schools....plus only a few blocks from the historic East Village of Davenport, Iowa. The open concept of the combined dining & living area gives you room to gather & entertain many. The spacious kitchen offers plenty of cabinetry & countertop space to prep meals with plenty of space for the kitchen table as well. Enjoy the convenience of TWO main-floor bedrooms and an updated bath plus laundry hookups with a washer/dryer combo to stay. There is even a large family room that offers many options for use on the main level. Upstairs, you will find 2 additional bedrooms. The partially finished basement gives you space to expand with a recreation room and lots of storage space or space to finish as you choose. Relax in the large backyard with a deck that is also accessible from an alley entrance. UPDATES include: Roof 2022, High-Efficiency Furnace 2022 & AC 2023 Water Heater, Kitchen Countertops, Bathroom, Flooring, Light Fixtures, Front Porch & Rear Deck.
-
2025-01-01historical
-
2024-12-31historical
-
2024-09-19price
-
2024-06-14Active
-
2024-03-22historical
-
2024-03-22historical
-
2023-12-21Active
-
2002-11-13soldstatus $57,000
-
2002-09-02$59,500
ⓘ Source: listings_history table (triggers on properties + properties_extension) + one-shot
backfill from property_details.listing_events for pre-trigger history.
Tax reassessment forecast IA · Partial reset (capped growth)
- Current annual tax
- $2,670 · $223/mo
- Projected year-2 tax
- $2,670 · $223/mo
- Expected delta
- $0/yr ($0/mo · 0.0%)
ⓘ Screening estimate from a state-policy table — verify with the county assessor before closing.
Climate risk First Street
- Flood 1/10 Low FEMA zone X (unshaded) · 0% chance over 30 yrs
- Wildfire 1/10 Low
- Heat 3/10 Moderate 7 d/yr ≥103°F today · 16 d/yr by 30 yrs out
- Wind 2/10 Low
- Air quality 3/10 Moderate 2 unhealthy d/yr today · 3 by 30 yrs out
Nearby sold comps map
Loading sold comps map…
Walkable amenities ~0.75 mi
Loading nearby amenities…
Taxation est. · year 1
- Rental income
- $19,719
- − Mortgage interest
- −$8,402
- − Property taxes
- −$2,670
- − Insurance
- −$750
- − Repairs & maintenance
- −$1,578
- − Management
- −$1,578
- − Depreciation
- −$4,364
- Taxable income
- $378
- Est. tax owed @ 24.0%
- −$91
- After-tax cash flow
- $2,628/yr
For passive investors: Depreciation is non-cash, so a rental often shows a tax loss while cash-flowing — sheltering income. Rental losses are passive: they offset passive income freely, and up to $25,000/yr can offset ordinary (W-2) income if you actively participate and your MAGI is under $100k (phasing out to $0 by $150k); unused losses carry forward. On sale, claimed depreciation is recaptured at up to 25%, and gains may owe capital-gains tax (a 1031 exchange can defer both). Figures are a year-1 estimate at your 24.0% rate — not tax advice; consult a CPA.
Schools (NCES district)
- District
- Davenport Community School District
- NCES district ID
- 1908580
- Math proficiency
- 43% ▼ -11.00%
- Reading proficiency
- 50% ▼ -3.00%
- Median HH income
- $46,157
- Composite
- 39.49/100
- National rank
- #3951
- State rank
- #288 of 289 in IA
Livability — Davenport
- Score
- 79/100
- State rank
- #126
- US rank
- #2312
Category grades
Schools grade is shown separately in the Schools card above.
Census & demographics
- Census place
- Davenport, IA
- County
- Scott County · 144,583 people
- City population
- 103,319
- Metro
- Davenport-Moline-Rock Island, IA-IL
- Population (ZIP)
- 22,742
- Household income
- $64,543
- Rent vs Own
- Severe rent burden
- 630.0
Population outlook (Scott County) Hauer SSP2
- Today (2025)
- 188,878 people
- By 2030
- 196,648 · +4.1%
- By 2040
- 210,860 · +11.6%
- By 2050
- 224,359 · +18.8%
- By 2075
- 258,884 · +37.1%
- By 2100
- 286,447 · +51.7%
Race, ethnicity, and origin ACS 2023
- Neighborhood character
- Predominantly White (69%)
- Race & ethnicity
- White 69% Black 14% Two or more races 10% Hispanic / Latino 9%
- Hispanic origin (detail)
- Mexican 7%
- Common ancestry
- Romanian 2% Portuguese 2% Iranian 2%
- Foreign-born
- 5% · Canada, United Kingdom, South Korea
- Languages at home
- 93% English-only · Spanish 4% French/Haitian/Cajun 1%
Political lean MEDSL · Scott
- 2024 margin
- Toss-up / Even · D 47.3% · R 51.2% · Other 1.4%
- 2008→2024 swing
- -18.4pp toward R · 2008: 14.6pp · 2024: -3.9pp
- All cycles
- 2024: R+3.9 2020: D+3.5 2016: D+1.4 2012: D+13.8 2008: D+14.6
Not yet ingested
- Civics
- —
Market trends
- HPI YoY
- ▼ -96.00%
- Current HPI
- 182.0976
- Rent YoY
- ▲ 4.57%
- Metro
- Davenport-Moline-Rock Island, IA-IL
- State GDP YoY
- ▲ 2.48%
- F500 in state
- 4
Industry mix (Fortune 500 HQ in IA)
| Industry | F500 HQs | Revenue |
|---|---|---|
| Financial Services | 1 | $16B |
|
||
| Retail / Convenience | 1 | $15B |
|
||
Price history
+152.1% since first listed10 events — show timeline
- 2026-04-09 Listed $150,000 MRED as Distributed by MLS Grid
- 2025-01-01 Listing Removed — RMLSA as Distributed by MLS Grid
- 2024-12-31 Listing Removed — MRED as Distributed by MLS Grid
- 2024-09-19 Price Changed — RMLSA as Distributed by MLS Grid
- 2024-06-14 Listed — RMLSA as Distributed by MLS Grid
- 2024-03-22 Listing Removed — RMLSA as Distributed by MLS Grid
- 2024-03-22 Listing Removed — MRED as Distributed by MLS Grid
- 2023-12-21 Listed — RMLSA as Distributed by MLS Grid
- 2002-11-13 Sold (MLS) $57,000 RMLSA as Distributed by MLS Grid
- 2002-09-02 Listed $59,500 RMLSA as Distributed by MLS Grid
Property tax history
+6.0%/yrLatest (2025): $2,670 · +34.8% YoY. Source: county tax records.
Cash-flow waterfall
monthlySold comps — $/sqft
last 12 mo · ≤1 miLoading sold comps…