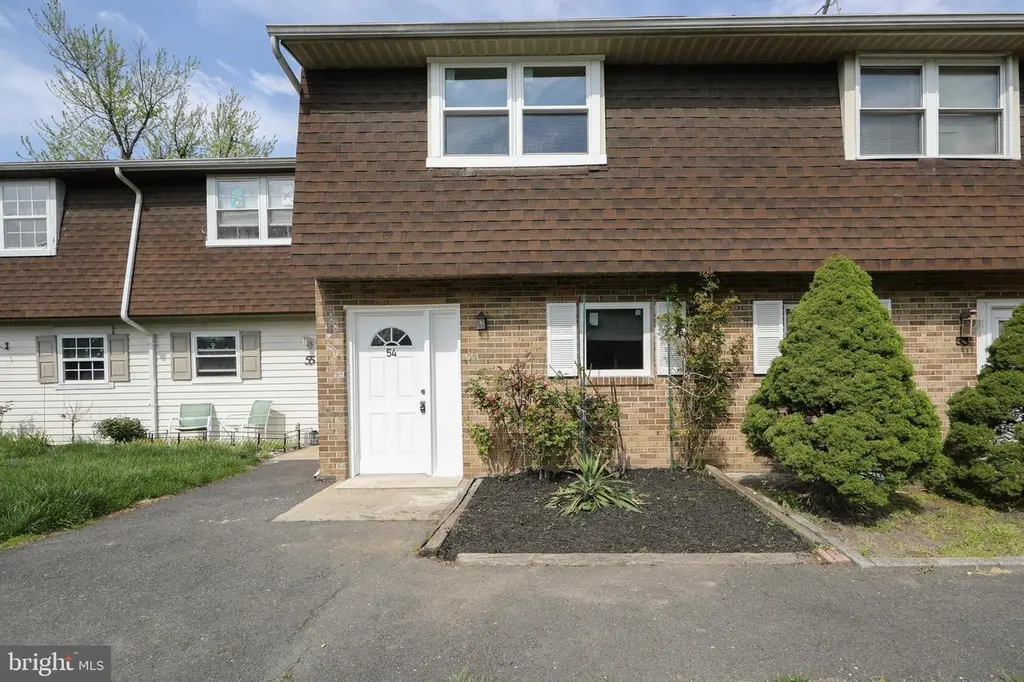
54 La Cascata Tnhs · Lindenwold, NJ
Flood risk 1/10 · Minimal
- FEMA flood zone
- X (unshaded)
- Chance of flooding over 30 yrs
- 0.0%
- Est. flood insurance / yr
- $507 – $1,088
Fire risk 2/10 · Minimal
- Est. fire insurance / yr
- $526 – $976
Heat risk 7/10 · Major
- Hot days now (above 103°F)
- 7 days/yr
- Hot days in 30 yrs
- 15 days/yr
Wind risk 6/10 · Moderate
- Chance of severe wind over 30 yrs
- 61.0%
Air-quality risk 3/10 · Minor
- Unhealthy air days now
- 3 days/yr
- Unhealthy air days in 30 yrs
- 3 days/yr
Risk factors via First Street. Map © Google.
Why this score? — see what drove the C- grade
The composite is a weighted blend of 9 inputs, each scored 0–100. Each bar is that input's sub-score; the figure is the points it added to the 100-point composite (weight × sub-score).
- Cash flow +15.4/30.0
- ARV discount +15.0/15.0
- DSCR +4.7/10.0
- 1% rule +4.4/10.0
- Livability +3.4/5.0
- Rent growth +3.3/5.0
- Schools +2.6/10.0
- Condition / age +2.5/5.0
- Appreciation +0.0/10.0
$210,000
🖨 Deal sheet (PDF) 📄 Offer letter ✓ Due diligence
Listing remarks
Welcome to this move-in ready 2-bedroom, 1.5-bath townhome located in the desirable La Cascata community. This home has been recently refreshed with thoughtful updates throughout, including a new HVAC system, new flooring on the first level, new carpet throughout the second floor, fresh interior paint, and several new appliances including the refrigerator, stove/range and dishwasher. The main level offers a comfortable and functional layout with a convenient half bath, laundry closet with full-size washer and dryer, and an open dining and living room area that provides great space for everyday living and entertaining. A door from the living room leads out to the spacious fenced backyard, of
Key facts
- New carpet
- New flooring
- New appliances
Tags
Neighborhood map
What this means for you Summary
Snapshot
- This is a 2-bed/1.5-bath single-family listed at $210k.
Deal economics
- At list price, monthly cash flow is $80 ($955/yr) — positive.
- The deal already cash-flows at list — no discount required.
- To meet the 1% rule (rent ≥ 1% of price), the offer needs to be $198k (5.9% below list).
- Recommended offer: $198k (5.9% below list) — sets the bar for 1% rule.
- Cap rate 6.7% vs local median 5.2% in Lindenwold — meaningfully above typical; check what's discounted (condition, days-on-market, listing class) to confirm the premium yield is real.
Location & tenants
- Location reads 68/100 on livability (#312 in NJ) — a middle-class / working-renter tenant base. Strengths: housing A+, health & safety A, cost of living B; Watch: employment C-, crime D, amenities D-.
- Gloucester Township Public Schools (suburban): math 14% / reading 41% proficiency, ranked #351 of 472 in NJ (top 74%) — low school quality limits family demand, transient renter base, plan for 1-2y turnover.
- Zoned schools: Highland Regional High School (math 9% / reading 41%, grade F, #325 of 399 statewide, top 81%, 1,204 students, 31% FRL) — zoned schools at 31% FRL track the district average.
- Market conditions: Rents rising (+3.0%/yr); 242 active listings in the ZIP; 17 comparable units currently listed for rent nearby; rentals leasing fast (median 1d on market — plan ~1-2 weeks tenant-placement turnaround); 1,018 units permitted in Camden County in 2024 (509 in 5+ unit buildings).
- This rent runs 35% of the median local income ($68k/yr) — at the standard rent-burdened threshold; future hikes will face affordability resistance.
Forward outlook
- Local home prices are declining (-3.0%/yr); year-one equity from $1k of loan paydown is wiped out by about $6k of value loss. Plan a longer hold.
- Camden County population projected to shrink 8% by 2050 — rents likely to lag national; underwrite the cash flow, not the appreciation.
Negotiation context
- Only 8 days on market — expect competitive offers; lowballing is unlikely to land.
- 8 sale attempts since 25y ago with the ask held roughly flat each time — persistent listings suggest the price (not the market) is what's stuck; bring a comps-based counter.
- Current owner paid $47k; list at $210k implies a 346% gain — meaningful room to come down on a strong offer.
Risks & watch-outs
- Climate carrying-cost: major wind risk, 61% chance of damaging wind over 30y; extreme-heat days projected 7→15/yr by 2055 (HVAC capex compounding) — expect insurance premiums to compound above CPI over the hold.
Questions for the listing agent
- Built in 1975 — when were the roof, HVAC, electrical panel, plumbing, and water heater last replaced?
- What does the HOA fee cover, when was the last increase, and are there any pending special assessments or reserve-fund shortfalls?
- Is there a deadline driving the sale (1031 exchange, divorce, estate, relocation)? That informs how much negotiation room exists.
- Schools are F-rated, which usually means shorter tenancies and higher turnover. Who's the typical renter profile here, and what's been the actual vacancy rate?
- Crime grade is D in this area — have there been break-ins, vandalism, or insurance claims at this property in the last 3 years? What carrier currently insures it and at what premium?
- What's the average days-on-market for RENTAL listings here right now (not sales)? A rising rental-DOM trend means longer vacancies and softer asking-rent achievability than the comps imply.
- What's the recent tenant-quality profile in this submarket — average credit score on applications, eviction rate, late-payment / NSF rate, and stable-employment percentage? A property-management company in the area should have these aggregated.
- How much new for-sale + rental construction is in the pipeline within 1–3 miles? Heavy new supply typically softens prices + rents 12–24 months out; constrained supply supports both.
Investment metrics
- 1% rule
- 0.94% ✗
- Cap rate
- 6.75%
- Cash-on-cash
- 1.62%
- DSCR
- 1.07
- GRM
- 8.9
CMA / ARV
- ARV (on-the-fly)
- $283,464
- Comps found
- 12
Show comp detail 12 sales within ~0.75 mi
| Address | Dist | Beds/Ba | Sqft | Sold | Price | $/sf | Match |
|---|---|---|---|---|---|---|---|
| 175 La Cascata Tnhs | 0.18mi | 2/1.5 | 1,016 (0%) | 21mo | $215,000 | $212 | 74 |
| 8 Lancia Pl | 0.68mi | 3/2.0 (+1) | 1,020 (+0%) | 3mo | $299,000 | $293 | 58 |
| 600 6th Ave | 0.67mi | 3/1.5 (+1) | 1,008 (-1%) | 10mo | $340,000 | $337 | 54 |
| 39 Spring Garden St | 0.50mi | 3/1.0 (+1) | 1,092 (+8%) | 6mo | $245,000 | $224 | 52 |
| 1614 Huntingdon Mews | 0.65mi | 2/2.0 | 882 (-13%) | 1mo | $180,000 | $204 | 45 |
| 409 10th Ave | 0.75mi | 2/— | 900 (-11%) | 2mo | $256,000 | $284 | 44 |
| 811 Aston Martin Dr | 0.74mi | 3/2.0 (+1) | 960 (-6%) | 11mo | $150,000 | $156 | 40 |
| 1083 Chews Land Clem Rd | 0.66mi | 3/1.0 (+1) | 1,120 (+10%) | 7mo | $270,000 | $241 | 39 |
| 728 Bentley Rd | 0.65mi | 3/1.0 (+1) | 912 (-10%) | 13mo | $254,000 | $279 | 35 |
| 725 Bentley Rd | 0.68mi | 3/1.0 (+1) | 912 (-10%) | 12mo | $245,000 | $269 | 34 |
| 732 Aston Martin Dr | 0.71mi | 3/1.0 (+1) | 912 (-10%) | 14mo | $276,000 | $303 | 31 |
| 729 Aston Martin Dr | 0.74mi | 3/1.0 (+1) | 912 (-10%) | 21mo | $280,000 | $307 | 24 |
Match score weights: distance 35% · size 25% · config 20% · recency 20%. Top-matched comps best support the ARV.
Projected returns pro-forma
-3.0% appreciation · 3.02% rent growth · sell at horizon
- IRR
- -13.7%
- Equity multiple
- 0.51×
- Total profit
- $-28,873
- Equity at exit
- $31,312
- IRR
- -4.7%
- Equity multiple
- 0.69×
- Total profit
- $-18,257
- Equity at exit
- $18,157
Cash invested: $58,800 (down + closing). Projections, not guarantees.
Landlord ↔ Tenant lean methodology
- Overall (STATE)
- 21 Tenant-Leaning
- State New Jersey
- 21 Tenant-Leaning · D+6
- County
- — inherits STATE
- City
- — inherits STATE
ZIP-level market 08021
- Home prices YoY
- -31.6%
- Rents YoY
- 3.0%
- Active inventory
- 242
- Price-to-rent
- 8.9×
Monthly cashflow live
- Estimated rent
- $1,976 high interval (Pro) →
- Mortgage (P&I)
- −$1,101
- Tax from tax record
- −$193 /mo · $2,313/yr
- Insurance
- −$88
- HOA
- −$100
- Vacancy / Maint / Mgmt
- −$415
- Net cashflow
- $80
Break-even live
Sensitivity live
| Price | -10% $198 | -5% $139 | +0% $80 | +5% $20 | +10% $-39 |
|---|---|---|---|---|---|
| Rent | -10% $-77 | -5% $2 | +0% $80 | +5% $158 | +10% $236 |
| Rate | -1.0pp $185 | -0.5pp $133 | base $80 | +0.5pp $25 | +1.0pp $-30 |
UW: 25.0% down · 7.5% · 30yr · 1.5% tax · 5.0% vac · 8.0% maint · 8.0% mgmt
Financing live
Cash to close
- Down payment
- $52,500
- Closing costs
- $6,300
- Reserves months
- —
- Total cash needed
- —
Loan-product check · same deal, 3 products live
Conventional
25% down · 7.5% · 30yr
- Down + closing
- —
- Monthly P&I
- —
- Monthly cashflow
- —
- DSCR
- —
- Eligible?
- —
Personal DTI + credit; lowest rate.
DSCR
20% down · 8.5% · 30yr
- Down + closing
- —
- Monthly P&I
- —
- Monthly cashflow
- —
- DSCR
- —
- Eligible?
- —
No personal income docs; deal must DSCR.
Hard money
10% down · 12.0% · 12mo
- Down + closing
- —
- Monthly P&I
- —
- Monthly cashflow
- —
- DSCR
- —
- Eligible?
- —
Short-term bridge; refi at stabilization.
Rent comps 17 comps
| Address | Beds | Baths | Sqft | Rent | $/sqft | DOM | Units | Dist |
|---|---|---|---|---|---|---|---|---|
| 1800 Laurel Rd Lindenwold, NJ | 1.0–2.0 | 1.0–2.0 | 885 | $2,072 | $2.34 | 0d | 25 | 0.21mi |
| 1990 Laurel Rd Apt AK313 Lindenwold, NJ | 1.0–2.0 | 1.0 | 691 | $1,450 | $2.10 | 14d | 3 | 0.24mi |
| 1600 Laurel Rd Lindenwold, NJ | 1.0–2.0 | 1.0–1.5 | 900 | $1,600 | $1.78 | 26d | 1 | 0.31mi |
| 500 Chews Landing Rd Lindenwold, NJ | 1.0–2.0 | 1.0 | 875 | $1,750 | $2.00 | 26d | 1 | 0.52mi |
| 1801 Broadacres Dr Clementon, NJ | 2.0 | 1.0–2.0 | 910 | $1,978 | $2.17 | 0d | 8 | 0.58mi |
| 51 Chiswick Dr Unit 1 Lindenwold, NJ | 3.0 | 2.0 | 1110 | $2,650 | $2.39 | 0d | 1 | 0.60mi |
| 1341 Blackwood Clementon Rd Clementon, NJ | 1.0–2.0 | 1.0 | 925 | $2,669 | $2.89 | 0d | 22 | 0.62mi |
| 1109 Huntingdon Mews Clementon, NJ | 2.0 | 2.0 | 946 | $1,750 | $1.85 | 17d | 1 | 0.65mi |
| 9 Georgetown Rd Lindenwold, NJ | 3.0 | 2.5 | 1268 | $2,600 | $2.05 | 0d | 1 | 0.67mi |
| 828 Blackwood Clementon Rd Pine Hill, NJ | 1.0–2.0 | 1.0 | 734 | $1,575 | $2.15 | 24d | 1 | 0.93mi |
| 432 Highland Ests Clementon, NJ | 1.0 | 1.0 | 827 | $1,500 | $1.81 | 14d | 1 | 1.00mi |
| 1200 Little Gloucester Rd Clementon, NJ | 1.0–2.0 | 1.0 | 875 | $3,100 | $3.54 | 0d | 1 | 1.03mi |
| 359 Lake Blvd Lindenwold, NJ | 3.0 | 2.0 | 1196 | $2,900 | $2.42 | 0d | 1 | 1.06mi |
| 105 Blackwood Clementon Rd Lindenwold, NJ | 1.0–2.0 | 1.0 | 800 | $1,600 | $2.00 | 18d | 1 | 1.11mi |
| 1000 W Atlantic Ave Laurel Springs, NJ | 1.0 | 1.0 | 770 | $1,350 | $1.75 | 0d | 2 | 1.35mi |
| 4402 Aberdeen Ln Blackwood, NJ | 2.0 | 2.5 | 1257 | $2,600 | $2.07 | 0d | 1 | 1.44mi |
| 215 S Atlantic Ave E Stratford, NJ | 3.0 | 1.0 | 1460 | $2,445 | $1.67 | 12d | 1 | 1.49mi |
HOA detail
- Monthly dues
- $100 · $1,200/yr
Listing history 19 events
-
2026-04-24status Pending
-
2026-04-16$210,000 Active
-
2012-01-03soldstatus $47,100
-
2011-09-23historical
-
2010-09-23$59,000
-
2010-08-28historical
-
2010-01-28$50,000
-
2009-04-24historical
-
2008-04-25$111,000
-
2005-12-28soldstatus $86,000
-
2005-11-29soldstatus $86,000
-
2005-11-11historical
-
2005-10-18$86,000
-
2003-06-10historical
-
2003-01-10$59,000
-
2002-06-11$66,900
-
2002-06-11historical
-
2001-07-31historical
-
2001-01-09$56,900
ⓘ Source: listings_history table (triggers on properties + properties_extension) + one-shot
backfill from property_details.listing_events for pre-trigger history.
Tax reassessment forecast NJ · Partial reset (capped growth)
- Current annual tax
- $2,313 · $193/mo
- Projected year-2 tax
- $3,771 · $314/mo
- Expected delta
- +$1,458/yr (+$122/mo · 63.0%)
ⓘ Screening estimate from a state-policy table — verify with the county assessor before closing.
Climate risk First Street
- Flood 1/10 Low FEMA zone X (unshaded) · 0% chance over 30 yrs
- Wildfire 2/10 Low
- Heat 7/10 Severe 7 d/yr ≥103°F today · 15 d/yr by 30 yrs out
- Wind 6/10 Major 61% chance of damaging wind over 30 yrs
- Air quality 3/10 Moderate 3 unhealthy d/yr today · 3 by 30 yrs out
Nearby sold comps map
Loading sold comps map…
Walkable amenities ~0.75 mi
Loading nearby amenities…
Taxation est. · year 1
- Rental income
- $23,713
- − Mortgage interest
- −$11,763
- − Property taxes
- −$2,313
- − Insurance
- −$1,050
- − Repairs & maintenance
- −$1,897
- − Management
- −$1,897
- − HOA
- −$1,200
- − Depreciation
- −$6,109
- Taxable loss
- −$2,517
- Est. tax savings @ 24.0%
- +$604
- After-tax cash flow
- $1,559/yr
For passive investors: Depreciation is non-cash, so a rental often shows a tax loss while cash-flowing — sheltering income. Rental losses are passive: they offset passive income freely, and up to $25,000/yr can offset ordinary (W-2) income if you actively participate and your MAGI is under $100k (phasing out to $0 by $150k); unused losses carry forward. On sale, claimed depreciation is recaptured at up to 25%, and gains may owe capital-gains tax (a 1031 exchange can defer both). Figures are a year-1 estimate at your 24.0% rate — not tax advice; consult a CPA.
Schools (NCES district)
- District
- Gloucester Township Public Schools
- NCES district ID
- 3406030
- Math proficiency
- 14% ▼ -28.00%
- Reading proficiency
- 41% ▼ -13.00%
- Median HH income
- $72,539
- Composite
- 26.18/100
- National rank
- #7269
- State rank
- #351 of 472 in NJ
Livability — Lindenwold
- Score
- 68/100
- State rank
- #312
- US rank
- #9603
Category grades
Schools grade is shown separately in the Schools card above.
Census & demographics
- County
- Camden County · 407,624 people
- City population
- 49,305
- Metro
- Philadelphia-Camden-Wilmington, PA-NJ-DE-MD
- Population (ZIP)
- 49,305
- Household income
- $68,044
- Rent vs Own
- Severe rent burden
- 3050.0
Population outlook (Camden County) Hauer SSP2
- Today (2025)
- 507,964 people
- By 2030
- 502,182 · -1.1%
- By 2040
- 485,602 · -4.4%
- By 2050
- 465,630 · -8.3%
- By 2075
- 419,986 · -17.3%
- By 2100
- 369,492 · -27.3%
Race, ethnicity, and origin ACS 2023
- Neighborhood character
- Diverse neighborhood (Simpson 0.69)
- Race & ethnicity
- White 44% Black 27% Hispanic / Latino 20% Two or more races 11% Asian 3%
- Hispanic origin (detail)
- Mexican 4% Puerto Rican 6% Dominican 2%
- Common ancestry
- Romanian 3% Lithuanian 1% Iranian 1%
- Foreign-born
- 12% · Canada, China, Vietnam
- Languages at home
- 81% English-only · Spanish 14% Chinese 1% Tagalog/Filipino 1%
Political lean MEDSL · Camden
- 2024 margin
- Strong D (+27.4) · D 63.0% · R 35.5% · Other 1.5%
- 2008→2024 swing
- -8.8pp toward R · 2008: 36.2pp · 2024: 27.4pp
- All cycles
- 2024: D+27.4 2020: D+33.5 2016: D+32.4 2012: D+36.6 2008: D+36.2
Not yet ingested
- Civics
- —
Market trends
- HPI YoY
- ▼ -156.73%
- Current HPI
- 338.8351
- Rent YoY
- ▲ 3.02%
- Metro
- Philadelphia-Camden-Wilmington, PA-NJ-DE-MD
- State GDP YoY
- ▲ 2.05%
- F500 in state
- 34
Industry mix (Fortune 500 HQ in NJ)
| Industry | F500 HQs | Revenue |
|---|---|---|
| Consumer Goods | 3 | $31B |
|
||
| Pharmaceuticals | 2 | $153B |
|
||
| Technology | 2 | $21B |
|
||
| Insurance | 2 | $20B |
|
||
| Healthcare | 2 | $19B |
|
||
| Financial Services | 1 | $70B |
|
||
Price history
+269.1% since first listed19 events — show timeline
- 2026-04-24 Pending — BRIGHT MLS
- 2026-04-16 Listed $210,000 BRIGHT MLS
- 2012-01-03 Sold (Public Records) $47,100 Public Records
- 2011-09-23 Listing Removed — BRIGHT MLS
- 2010-09-23 Listed $59,000 BRIGHT MLS
- 2010-08-28 Listing Removed — BRIGHT MLS
- 2010-01-28 Listed $50,000 BRIGHT MLS
- 2009-04-24 Listing Removed — BRIGHT MLS
- 2008-04-25 Listed $111,000 BRIGHT MLS
- 2005-12-28 Sold (Public Records) $86,000 Public Records
- 2005-11-29 Sold (MLS) $86,000 BRIGHT MLS
- 2005-11-11 Listing Removed — BRIGHT MLS
- 2005-10-18 Listed $86,000 BRIGHT MLS
- 2003-06-10 Listing Removed — BRIGHT MLS
- 2003-01-10 Listed $59,000 BRIGHT MLS
- 2002-06-11 Listing Removed — BRIGHT MLS
- 2002-06-11 Listed $66,900 BRIGHT MLS
- 2001-07-31 Listing Removed — BRIGHT MLS
- 2001-01-09 Listed $56,900 BRIGHT MLS
Property tax history
-0.6%/yrLatest (2025): $2,313 · +2.1% YoY. Source: county tax records.
Cash-flow waterfall
monthlySold comps — $/sqft
last 12 mo · ≤1 miLoading sold comps…