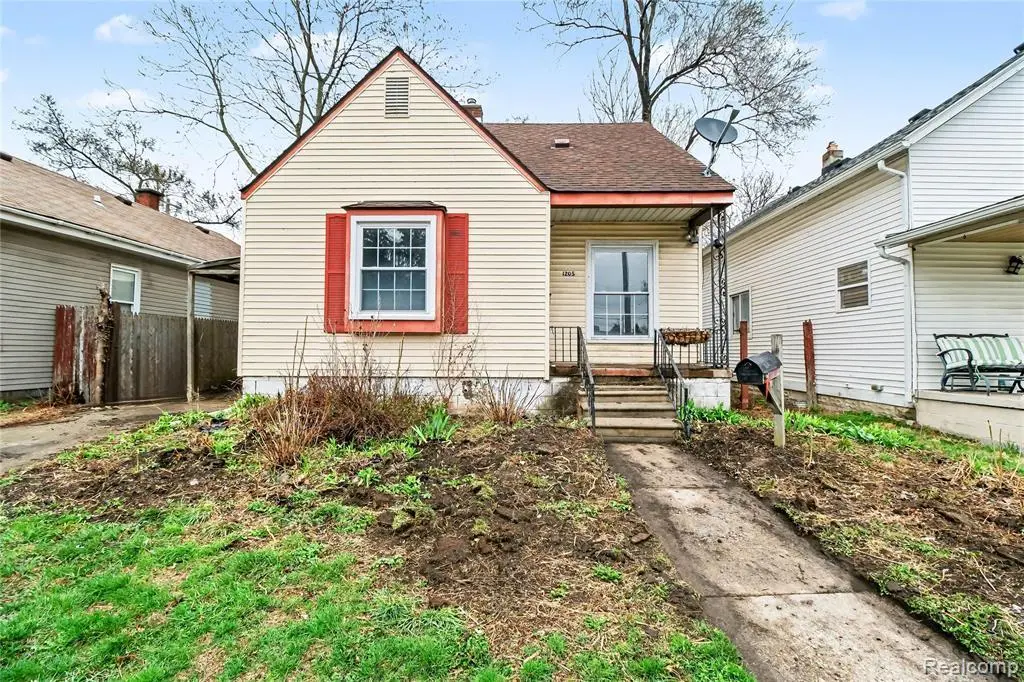
1205 E Muir Ave · Hazel Park, MI
Flood risk 1/10 · Minimal
- FEMA flood zone
- X (unshaded)
- Chance of flooding over 30 yrs
- 0.0%
- Est. flood insurance / yr
- $507 – $1,088
Fire risk 1/10 · Minimal
- Est. fire insurance / yr
- $784 – $1,456
Heat risk 3/10 · Minor
- Hot days now (above 97°F)
- 7 days/yr
- Hot days in 30 yrs
- 15 days/yr
Wind risk 2/10 · Minimal
- Chance of severe wind over 30 yrs
- —
Air-quality risk 4/10 · Minor
- Unhealthy air days now
- 4 days/yr
- Unhealthy air days in 30 yrs
- 6 days/yr
Risk factors via First Street. Map © Google.
Why this score? — see what drove the B+ grade
The composite is a weighted blend of 9 inputs, each scored 0–100. Each bar is that input's sub-score; the figure is the points it added to the 100-point composite (weight × sub-score).
- Cash flow +30.0/30.0
- ARV discount +15.0/15.0
- DSCR +10.0/10.0
- 1% rule +9.4/10.0
- Livability +4.0/5.0
- Rent growth +3.2/5.0
- Condition / age +2.5/5.0
- Schools +1.4/10.0
- Appreciation +0.0/10.0
$121,000
🖨 Deal sheet 📄 Offer letter ✓ Due diligence
Listing remarks MLS
Welcome to this 1.5-story bungalow built in 1953, offering 906 sq ft of comfortable living space. This home features 3 bedrooms and 1 full bathroom, making it a great fit for a variety of lifestyles. The living room provides ample space and is filled with natural light, creating a warm and inviting atmosphere. The kitchen offers plenty of room for meal prep and everyday cooking. Step outside to a spacious backyard perfect for gardening, hosting cookouts, or simply relaxing and enjoying the outdoors.
Key facts
- Spacious backyard
- Natural light
- Ample space
Tags
Property features AI
Exterior
- Parking: No garage
- Utilities: Public water; Public sewer
- Home design: Single-family residence; One and one-half story; Ground-level entry with steps; Vinyl siding
- Construction: Block foundation
- Exterior features: Back yard fencing; Paved road access
Interior
- Bathrooms: 1 full bathroom
- Heating & cooling: Forced air heating (natural gas); No cooling
- Interior features: Unfinished basement; Total of 5 rooms
Neighborhood map
What this means for you Summary
Snapshot
- This is a 3-bed/1.0-bath single-family listed at $121k.
Deal economics
- At list price, monthly cash flow is $560 ($7k/yr) — positive.
- The deal already cash-flows at list — no discount required.
- Meets the 1% rule at list price ($2k rent vs $121k).
- Recommended offer: $117k (3.0% below list) — sets the bar for market timing.
- Cap rate 11.8% vs local median 6.2% in Hazel Park — top-decile yield for the area; either an underpriced asset or a hidden risk that comps aren't pricing in. Stress-test before assuming the spread holds.
Location & tenants
- Location reads 81/100 on livability (#65 in MI, #1,385 nationally) — a professional / high-income tenant draw. Strengths: commute A+, cost of living A+, housing A+; Watch: employment D+, schools D.
- Hazel Park School District (suburban): math 10% / reading 24% proficiency, ranked #490 of 540 in MI (top 91%) — low school quality limits family demand, transient renter base, plan for 1-2y turnover; 70% free/reduced lunch — lower-income household profile, screen leases tightly.
- Market conditions: Rents rising (+2.9%/yr); 135 active listings in the ZIP; 12 comparable units currently listed for rent nearby; rentals at typical pace (median 22d on market — plan ~3-4 weeks tenant-placement turnaround); 2,614 units permitted in Oakland County in 2024 (721 in 5+ unit buildings).
- This rent runs 31% of the median local income ($67k/yr) — at the standard rent-burdened threshold; future hikes will face affordability resistance.
Forward outlook
- Local home prices are declining (-3.0%/yr); year-one equity from $837 of loan paydown is wiped out by about $4k of value loss. Plan a longer hold.
- Oakland County population projected at +10% by 2050 — modest demand growth; plan on rents tracking national, not racing it.
- At projected returns (-3.0% appreciation + 2.9% rent growth), your $34k cash investment doubles in ~7 years — after that, you're playing with house money.
Negotiation context
- It's been on market 43 days — a 3% lower offer ($117k) is reasonable based on typical stale-listing flexibility.
- 4 sale attempts with the ask held roughly flat each time — persistent listings suggest the price (not the market) is what's stuck; bring a comps-based counter.
Risks & watch-outs
- Watch-outs: built in 1953 — expect roof / HVAC / electrical / plumbing capex.
Questions for the listing agent
- It's been on market 43 days. Have you received any prior offers? Is the seller open to a 3% concession, seller financing, or rate buy-down credit?
- Built in 1953 — when were the roof, HVAC, electrical panel, plumbing, and water heater last replaced?
- Is there a deadline driving the sale (1031 exchange, divorce, estate, relocation)? That informs how much negotiation room exists.
- Schools are D-rated, which usually means shorter tenancies and higher turnover. Who's the typical renter profile here, and what's been the actual vacancy rate?
- What's the average days-on-market for RENTAL listings here right now (not sales)? A rising rental-DOM trend means longer vacancies and softer asking-rent achievability than the comps imply.
- What's the recent tenant-quality profile in this submarket — average credit score on applications, eviction rate, late-payment / NSF rate, and stable-employment percentage? A property-management company in the area should have these aggregated.
- How much new for-sale + rental construction is in the pipeline within 1–3 miles? Heavy new supply typically softens prices + rents 12–24 months out; constrained supply supports both.
Investment metrics
- 1% rule
- 1.44% ✓
- Cap rate
- 11.84%
- Cash-on-cash
- 19.82%
- DSCR
- 1.88
- GRM
- 5.8
CMA / ARV
- ARV (on-the-fly)
- $180,180
- Comps found
- 12
Show comp detail 12 sales within ~0.75 mi
| Address | Dist | Beds/Ba | Sqft | Sold | Price | $/sf | Match |
|---|---|---|---|---|---|---|---|
| 21420 Caledonia Ave | 0.43mi | 3/1.0 | 1,620 (-1%) | 8mo | $210,000 | $130 | 72 |
| 1226 E Bernhard Ave | 0.18mi | 3/2.5 | 1,464 (-11%) | 3mo | $285,000 | $195 | 65 |
| 20070 Irvington St | 0.52mi | 3/1.5 | 1,515 (-8%) | 1mo | $89,900 | $59 | 61 |
| 1483 E Evelyn Ave | 0.40mi | 3/2.0 | 1,500 (-8%) | 3mo | $216,500 | $144 | 60 |
| 1028 E Pearl Ave | 0.66mi | 3/1.0 | 1,679 (+2%) | 7mo | $180,000 | $107 | 59 |
| 20166 Riopelle St | 0.43mi | 3/1.0 | 1,450 (-12%) | 7mo | $103,000 | $71 | 55 |
| 19657 Cardoni St | 0.68mi | 3/1.0 | 1,765 (+8%) | 4mo | $22,000 | $12 | 52 |
| 1844 E Jarvis Ave | 0.73mi | 3/2.5 | 1,723 (+5%) | 0mo | $310,000 | $180 | 51 |
| 1744 E Madge Ave | 0.52mi | 3/1.0 | 1,439 (-12%) | 6mo | $158,000 | $110 | 50 |
| 736 E Granet Ave | 0.56mi | 4/2.0 (+1) | 1,523 (-7%) | 7mo | $185,000 | $121 | 47 |
| 1451 E Pearl Ave | 0.69mi | 3/2.0 | 1,787 (+9%) | 4mo | $185,299 | $104 | 45 |
| 20181 Lumpkin St | 0.67mi | 4/2.0 (+1) | 1,783 (+9%) | 1mo | $110,000 | $62 | 45 |
Match score weights: distance 35% · size 25% · config 20% · recency 20%. Top-matched comps best support the ARV.
Projected returns pro-forma
-3.0% appreciation · 2.9% rent growth · sell at horizon
- IRR
- 11.8%
- Equity multiple
- 1.47×
- Total profit
- $15,876
- Equity at exit
- $18,041
- IRR
- 20.7%
- Equity multiple
- 2.74×
- Total profit
- $59,069
- Equity at exit
- $10,462
Cash invested: $33,880 (down + closing). Projections, not guarantees.
Landlord ↔ Tenant lean methodology
- Overall (STATE)
- 62 Landlord-Friendly
- State Michigan
- 62 Landlord-Friendly · EVEN
- County
- — inherits STATE
- City
- — inherits STATE
ZIP-level market 48030
- Rents YoY
- 2.9%
- Active inventory
- 135
- Price-to-rent
- 5.8×
Monthly cashflow live
- Estimated rent
- $1,748 high interval (Pro) →
- Mortgage (P&I)
- −$635
- Tax from tax record
- −$136 /mo · $1,634/yr
- Insurance
- −$50
- HOA
- −$0
- Vacancy / Maint / Mgmt
- −$367
- Net cashflow
- $560
Break-even live
UW: 25.0% down · 7.5% · 30yr · 1.5% tax · 5.0% vac · 8.0% maint · 8.0% mgmt
Financing live
Cash to close
- Down payment
- $30,250
- Closing costs
- $3,630
- Reserves months
- —
- Total cash needed
- —
Loan-product check · same deal, 3 products live
Conventional
25% down · 7.5% · 30yr
- Down + closing
- —
- Monthly P&I
- —
- Monthly cashflow
- —
- DSCR
- —
- Eligible?
- —
Personal DTI + credit; lowest rate.
DSCR
20% down · 8.5% · 30yr
- Down + closing
- —
- Monthly P&I
- —
- Monthly cashflow
- —
- DSCR
- —
- Eligible?
- —
No personal income docs; deal must DSCR.
Hard money
10% down · 12.0% · 12mo
- Down + closing
- —
- Monthly P&I
- —
- Monthly cashflow
- —
- DSCR
- —
- Eligible?
- —
Short-term bridge; refi at stabilization.
Rent comps 12 comps
| Address | Beds | Baths | Sqft | Rent | $/sqft | DOM | Units | Dist |
|---|---|---|---|---|---|---|---|---|
| 1301 E Muir Ave Hazel Park, MI | 3.0 | 2.0 | 1236 | $1,600 | $1.29 | 22d | 1 | 0.05mi |
| 1326 E Evelyn Ave Unit 1032332P Hazel Park, MI | 3.0 | 2.0 | 1097 | $6,448 | $5.88 | 1d | 1 | 0.36mi |
| 329 W Muir Ave Hazel Park, MI | 4.0 | 2.0 | 1606 | $2,000 | $1.25 | 11d | 1 | 0.76mi |
| 19995 Goddard St Detroit, MI | 4.0 | 1.0 | 1292 | $1,400 | $1.08 | 22d | 1 | 0.84mi |
| 1330 E Chesterfield St Ferndale, MI | 4.0 | 2.0 | 1795 | $2,800 | $1.56 | 1d | 1 | 1.02mi |
| 23304 Cayuga Ave Hazel Park, MI | 4.0 | 2.0 | 1540 | $2,150 | $1.40 | 24d | 1 | 1.13mi |
| 23400 Reynolds Ave Hazel Park, MI | 3.0 | 1.0 | 1305 | $1,900 | $1.46 | 5d | 1 | 1.26mi |
| 20000 Norwood St Detroit, MI | 3.0 | 1.5 | 1150 | $1,200 | $1.04 | 24d | 1 | 1.33mi |
| 1820 E Troy St Ferndale, MI | 3.0 | 1.0 | 1167 | $1,500 | $1.29 | 5d | 1 | 1.35mi |
| 18503 Riopelle St Highland Park, MI | 3.0 | 1.0 | 1254 | $1,250 | $1.00 | 5d | 1 | 1.39mi |
| 2709 Capitol Ave Warren, MI | 3.0 | 2.0 | 1056 | $1,649 | $1.56 | 43d | 1 | 1.41mi |
| 19360 Revere St Detroit, MI | 3.0 | 1.0 | 1050 | $1,250 | $1.19 | 24d | 1 | 1.45mi |
Listing history 20 events
-
2026-06-18days on market $121,000 Active 43 DOM
-
2026-06-17days on market $121,000 Active 42 DOM
-
2026-06-16days on market $121,000 Active 41 DOM
-
2026-06-15days on market $121,000 Active 40 DOM
-
2026-06-13days on market $121,000 Active 38 DOM
-
2026-06-13days on market $121,000 Active 37 DOM
-
2026-06-09days on market $121,000 Active 34 DOM
-
2026-06-08days on market $121,000 Active 33 DOM
-
2026-06-07days on market $121,000 Active 32 DOM
-
2026-06-04days on market $121,000 Active 29 DOM
-
2026-06-03days on market $121,000 Active 28 DOM
-
2026-06-02days on market $121,000 Active 27 DOM
-
2026-06-01days on market $121,000 Active 26 DOM
-
2026-05-31days on market $121,000 Active 25 DOM
-
2026-05-06$121,000 Active
Show marketing remark (504 chars)
Welcome to this 1.5-story bungalow built in 1953, offering 906 sq ft of comfortable living space. This home features 3 bedrooms and 1 full bathroom, making it a great fit for a variety of lifestyles. The living room provides ample space and is filled with natural light, creating a warm and inviting atmosphere. The kitchen offers plenty of room for meal prep and everyday cooking. Step outside to a spacious backyard perfect for gardening, hosting cookouts, or simply relaxing and enjoying the outdoors.
-
2026-05-06$121,000 Active 504-char remark
Show marketing remark (504 chars)
Welcome to this 1.5-story bungalow built in 1953, offering 906 sq ft of comfortable living space. This home features 3 bedrooms and 1 full bathroom, making it a great fit for a variety of lifestyles. The living room provides ample space and is filled with natural light, creating a warm and inviting atmosphere. The kitchen offers plenty of room for meal prep and everyday cooking. Step outside to a spacious backyard perfect for gardening, hosting cookouts, or simply relaxing and enjoying the outdoors.
-
2026-03-27historical
-
2026-03-27historical
-
2026-02-05$121,000 Active
-
2026-02-05$121,000 Active
ⓘ Source: listings_history table (triggers on properties + properties_extension) + one-shot
backfill from property_details.listing_events for pre-trigger history.
Tax reassessment forecast MI · Partial reset (capped growth)
- Current annual tax
- $1,634 · $136/mo
- Projected year-2 tax
- $1,748 · $146/mo
- Expected delta
- +$115/yr (+$10/mo · 7.0%)
ⓘ Screening estimate from a state-policy table — verify with the county assessor before closing.
Climate risk First Street
- Flood 1/10 Low FEMA zone X (unshaded) · 0% chance over 30 yrs
- Wildfire 1/10 Low
- Heat 3/10 Moderate 7 d/yr ≥97°F today · 15 d/yr by 30 yrs out
- Wind 2/10 Low
- Air quality 4/10 Moderate 4 unhealthy d/yr today · 6 by 30 yrs out
Nearby sold comps map
Loading sold comps map…
Walkable amenities ~0.75 mi
Loading nearby amenities…
Taxation est. · year 1
- Rental income
- $20,973
- − Mortgage interest
- −$6,778
- − Property taxes
- −$1,634
- − Insurance
- −$605
- − Repairs & maintenance
- −$1,678
- − Management
- −$1,678
- − Depreciation
- −$3,520
- Taxable income
- $5,080
- Est. tax owed @ 24.0%
- −$1,219
- After-tax cash flow
- $5,496/yr
For passive investors: Depreciation is non-cash, so a rental often shows a tax loss while cash-flowing — sheltering income. Rental losses are passive: they offset passive income freely, and up to $25,000/yr can offset ordinary (W-2) income if you actively participate and your MAGI is under $100k (phasing out to $0 by $150k); unused losses carry forward. On sale, claimed depreciation is recaptured at up to 25%, and gains may owe capital-gains tax (a 1031 exchange can defer both). Figures are a year-1 estimate at your 24.0% rate — not tax advice; consult a CPA.
Schools (NCES district)
- District
- Hazel Park School District
- NCES district ID
- 2618030
- Math proficiency
- 10% ▼ -2.00%
- Reading proficiency
- 24% ▲ 1.00%
- Median HH income
- $36,181
- Composite
- 14.05/100
- National rank
- #9466
- State rank
- #490 of 540 in MI
Livability — Hazel Park
- Score
- 81/100
- State rank
- #65
- US rank
- #1385
Category grades
Schools grade is shown separately in the Schools card above.
Census & demographics
- Census place
- Hazel Park, MI
- County
- Oakland County · 1,009,092 people
- City population
- 14,963
- Metro
- Detroit-Warren-Dearborn, MI
- Population (ZIP)
- 14,963
- Household income
- $67,073
- Rent vs Own
- Severe rent burden
- 432.0
Population outlook (Oakland County) Hauer SSP2
- Today (2025)
- 1,335,747 people
- By 2030
- 1,375,100 · +2.9%
- By 2040
- 1,435,385 · +7.5%
- By 2050
- 1,469,250 · +10.0%
- By 2075
- 1,531,946 · +14.7%
- By 2100
- 1,450,485 · +8.6%
Race, ethnicity, and origin ACS 2023
- Neighborhood character
- Predominantly White (74%)
- Race & ethnicity
- White 74% Two or more races 10% Black 10% Hispanic / Latino 6% Asian 1%
- Hispanic origin (detail)
- Mexican 3% Puerto Rican 2%
- Common ancestry
- Romanian 11% Slovak 3% Lithuanian 2%
- Foreign-born
- 5% · Canada
- Languages at home
- 92% English-only · Spanish 5% Arabic 1% Russian/Polish/Slavic 1%
Political lean MEDSL · Oakland
- 2024 margin
- D (+10.6) · D 54.4% · R 43.8% · Other 1.9%
- 2008→2024 swing
- -3.9pp toward R · 2008: 14.5pp · 2024: 10.6pp
- All cycles
- 2024: D+10.6 2020: D+14.1 2016: D+8.1 2012: D+8.1 2008: D+14.5
Not yet ingested
- Civics
- —
Market trends
- HPI YoY
- ▼ -184.32%
- Current HPI
- 285.5923
- Rent YoY
- ▲ 2.90%
- Metro
- Detroit-Warren-Dearborn, MI
- State GDP YoY
- ▲ 1.37%
- F500 in state
- 28
Industry mix (Fortune 500 HQ in MI)
| Industry | F500 HQs | Revenue |
|---|---|---|
| Automotive Parts | 3 | $48B |
|
||
| Automotive | 2 | $372B |
|
||
| Chemicals | 1 | $45B |
|
||
| Automotive Retail | 1 | $29B |
|
||
| Healthcare / Medical Devices | 1 | $23B |
|
||
| Automotive Technology | 1 | $20B |
|
||
Price history
+0.0% since first listed6 events — show timeline
- 2026-05-06 Listed $121,000 REALCOMP
- 2026-05-06 Listed $121,000 MiRealSource-MiMLS
- 2026-03-27 Listing Removed — MiRealSource-MiMLS
- 2026-03-27 Listing Removed — REALCOMP
- 2026-02-05 Listed $121,000 REALCOMP
- 2026-02-05 Listed $121,000 MiRealSource-MiMLS
Property tax history
+2.9%/yrLatest (2025): $1,634 · +1.9% YoY. Source: county tax records.
Cash-flow waterfall
monthlySold comps — $/sqft
last 12 mo · ≤1 miLoading sold comps…