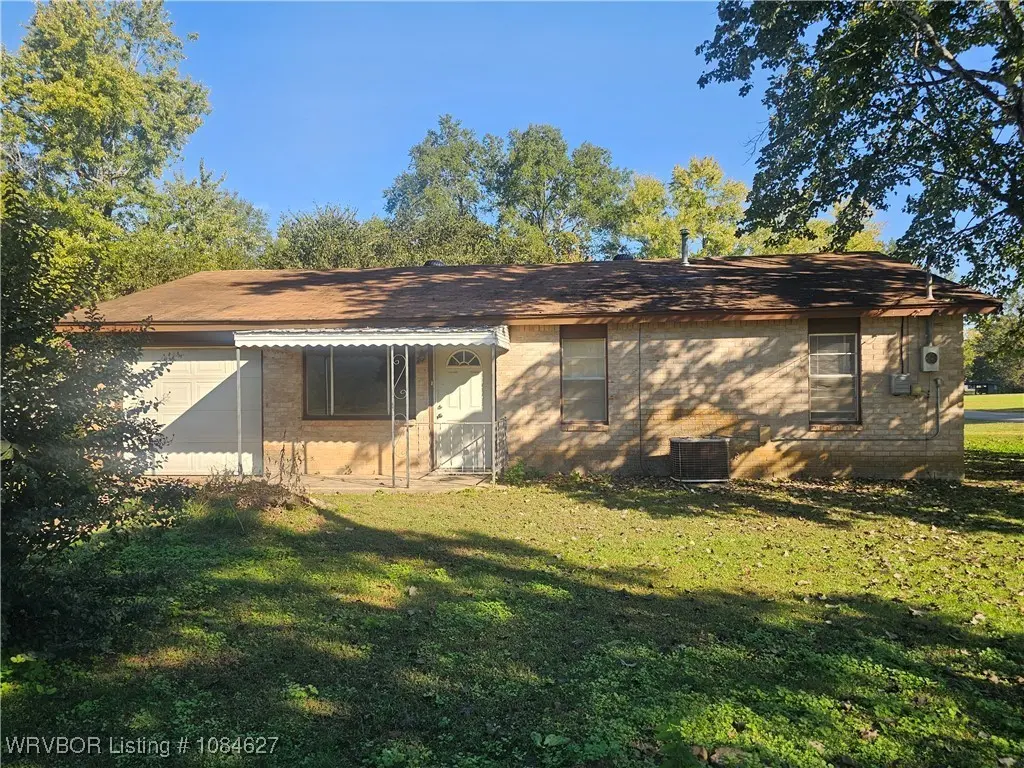
1111 Fuller St · Paris, AR
Flood risk 1/10 · Minimal
- FEMA flood zone
- X (unshaded)
- Chance of flooding over 30 yrs
- 0.0%
- Est. flood insurance / yr
- $507 – $1,088
Fire risk 5/10 · Moderate
- Est. fire insurance / yr
- $1,499 – $2,785
Heat risk 6/10 · Moderate
- Hot days now (above 111°F)
- 7 days/yr
- Hot days in 30 yrs
- 20 days/yr
Wind risk 2/10 · Minimal
- Chance of severe wind over 30 yrs
- 2.0%
Air-quality risk 1/10 · Minimal
- Unhealthy air days now
- 0 days/yr
- Unhealthy air days in 30 yrs
- 0 days/yr
Risk factors via First Street. Map © Google.
Why this score? — see what drove the B grade
The composite is a weighted blend of 9 inputs, each scored 0–100. Each bar is that input's sub-score; the figure is the points it added to the 100-point composite (weight × sub-score).
- Cash flow +28.7/30.0
- ARV discount +15.0/15.0
- DSCR +10.0/10.0
- 1% rule +8.0/10.0
- Livability +3.5/5.0
- Schools +3.2/10.0
- Rent growth +2.5/5.0
- Condition / age +2.5/5.0
- Appreciation +0.0/10.0
$79,900
🖨 Deal sheet (PDF) 📄 Offer letter ✓ Due diligence
Listing remarks MLS
This cozy 3-bedroom, 1.5-bath home is brimming with potential and waiting for your personal touch. Whether you're a first-time buyer looking to build equity or an investor seeking a smart addition to your portfolio, this property checks all the boxes. At this price point, it is a rare find in today's market. Ideal for buyers looking to get in at a great value.
Key facts
- 6,970 sq ft lot
- Garage
- Built 1996
Neighborhood map
What this means for you Summary
Snapshot
- This is a 3-bed/1.5-bath single-family listed at $80k.
Deal economics
- At list price, monthly cash flow is $267 ($3k/yr) — positive.
- The deal already cash-flows at list — no discount required.
- Meets the 1% rule at list price ($1k rent vs $80k).
- Recommended offer: $70k (12.0% below list) — sets the bar for market timing.
- Cap rate 10.3% vs local median 5.5% in Paris — top-decile yield for the area; either an underpriced asset or a hidden risk that comps aren't pricing in. Stress-test before assuming the spread holds.
Location & tenants
- Location reads 69/100 on livability (#68 in AR) — a middle-class / working-renter tenant base. Strengths: cost of living A+, housing A+, health & safety A+; Watch: crime F, amenities F, commute F.
- Paris School District (town): math 41% / reading 37% proficiency, ranked #83 of 238 in AR (top 35%) — families likely to look elsewhere, expect single-tenant / working-renter base with shorter leases.
- Zoned schools: Paris Elementary School (math 57% / reading 27%, grade F, #173 of 454 statewide, top 43%, 431 students, 100% FRL); Paris Middle School (math 39% / reading 43%, grade F, #83 of 201 statewide, top 44%, 317 students, 100% FRL); Paris High School (math 32% / reading 37%, grade F, #92 of 292 statewide, top 37%, 335 students, 100% FRL) — zoned schools average 100% FRL vs 54% district-wide (46 pts higher); higher-poverty schools than district average — tighter screening recommended.
- Market conditions: 78 active listings in the ZIP; 11 units permitted in Logan County in 2024 (0 in 5+ unit buildings).
Forward outlook
- Local home prices are declining (-3.0%/yr); year-one equity from $552 of loan paydown is wiped out by about $2k of value loss. Plan a longer hold.
- Logan County population projected at -13% by 2050 — secular population decline; favor cash flow + early exit over multi-decade hold.
- At projected returns (-3.0% appreciation + 3.0% rent growth), your $22k cash investment doubles in ~9 years — after that, you're playing with house money.
Negotiation context
- It's been on market 249 days — a 12% lower offer ($70k) is reasonable based on typical stale-listing flexibility.
Risks & watch-outs
- Climate carrying-cost: moderate wildfire risk; extreme-heat days projected 7→20/yr by 2055 (HVAC capex compounding) — expect insurance premiums to compound above CPI over the hold.
Questions for the listing agent
- It's been on market 249 days. Have you received any prior offers? Is the seller open to a 12% concession, seller financing, or rate buy-down credit?
- Why hasn't it sold? Are there any deal-killer items the seller is aware of (foundation, flood, title, zoning, code violations)?
- Is there a deadline driving the sale (1031 exchange, divorce, estate, relocation)? That informs how much negotiation room exists.
- Schools are D-rated, which usually means shorter tenancies and higher turnover. Who's the typical renter profile here, and what's been the actual vacancy rate?
- Crime grade is F in this area — have there been break-ins, vandalism, or insurance claims at this property in the last 3 years? What carrier currently insures it and at what premium?
- What's the average days-on-market for RENTAL listings here right now (not sales)? A rising rental-DOM trend means longer vacancies and softer asking-rent achievability than the comps imply.
- What's the recent tenant-quality profile in this submarket — average credit score on applications, eviction rate, late-payment / NSF rate, and stable-employment percentage? A property-management company in the area should have these aggregated.
- How much new for-sale + rental construction is in the pipeline within 1–3 miles? Heavy new supply typically softens prices + rents 12–24 months out; constrained supply supports both.
Investment metrics
- 1% rule
- 1.30% ✓
- Cap rate
- 10.30%
- Cash-on-cash
- 14.31%
- DSCR
- 1.64
- GRM
- 6.4
CMA / ARV
- ARV (median comp)
- $96,882
- List price
- $79,900
- Delta
- -17.53%
- Verdict
- UNDERPRICED
- Comps
- 20 within 1.0 mi
Show comp detail 12 sales within ~0.75 mi
| Address | Dist | Beds/Ba | Sqft | Sold | Price | $/sf | Match |
|---|---|---|---|---|---|---|---|
| 1205 Crescent Dr | 0.48mi | 3/1.5 | 1,161 (+5%) | 6mo | $30,000 | $26 | 65 |
| 519 S 10th St | 0.12mi | 2/1.0 (-1) | 1,004 (-10%) | 10mo | $62,000 | $62 | 63 |
| 804 E Academy St | 0.18mi | 2/1.0 (-1) | 974 (-12%) | 1mo | $114,000 | $117 | 63 |
| 1160 Wood St | 0.60mi | 3/1.0 | 1,032 (-7%) | 1mo | $115,000 | $111 | 58 |
| 111 Grober St | 0.70mi | 2/1.0 (-1) | 1,088 (-2%) | 1mo | $85,000 | $78 | 56 |
| 513 4th St | 0.61mi | 3/2.0 | 1,032 (-7%) | 3mo | $120,000 | $116 | 56 |
| 714 E Academy St | 0.20mi | 2/1.0 (-1) | 980 (-12%) | 12mo | $105,000 | $107 | 54 |
| 1112 E Wood St | 0.58mi | 3/2.0 | 1,209 (+9%) | 9mo | $152,700 | $126 | 48 |
| 1104 Main St | 0.22mi | 2/2.0 (-1) | 1,260 (+14%) | 15mo | $20,000 | $16 | 48 |
| 804 Wahl St | 0.40mi | 3/2.0 | 1,250 (+13%) | 15mo | $157,000 | $126 | 46 |
| 614 N 7th St | 0.57mi | 2/1.0 (-1) | 1,039 (-6%) | 13mo | $120,000 | $115 | 45 |
| 817 E Chism St | 0.46mi | 2/1.0 (-1) | 1,232 (+11%) | 15mo | $57,400 | $47 | 41 |
Match score weights: distance 35% · size 25% · config 20% · recency 20%. Top-matched comps best support the ARV.
Projected returns pro-forma
-3.0% appreciation · 3.0% rent growth · sell at horizon
- IRR
- 4.7%
- Equity multiple
- 1.18×
- Total profit
- $4,066
- Equity at exit
- $11,913
- IRR
- 14.2%
- Equity multiple
- 2.14×
- Total profit
- $25,491
- Equity at exit
- $6,908
Cash invested: $22,372 (down + closing). Projections, not guarantees.
Landlord ↔ Tenant lean methodology
- Overall (STATE)
- 92 Strongly Landlord-Friendly
- State Arkansas
- 92 Strongly Landlord-Friendly · R+14
- County
- — inherits STATE
- City
- — inherits STATE
ZIP-level market 72855
- Home prices YoY
- -8.3%
- Active inventory
- 78
- Price-to-rent
- 6.4×
Monthly cashflow live
- Estimated rent
- $1,037 medium interval (Pro) →
- Mortgage (P&I)
- −$419
- Tax est. 1.5%
- −$100 /mo · $1,198/yr
- Insurance
- −$33
- HOA
- −$0
- Vacancy / Maint / Mgmt
- −$218
- Net cashflow
- $267
Break-even live
Sensitivity live
| Price | -10% $322 | -5% $294 | +0% $267 | +5% $239 | +10% $212 |
|---|---|---|---|---|---|
| Rent | -10% $185 | -5% $226 | +0% $267 | +5% $308 | +10% $349 |
| Rate | -1.0pp $307 | -0.5pp $287 | base $267 | +0.5pp $246 | +1.0pp $225 |
UW: 25.0% down · 7.5% · 30yr · 1.5% tax · 5.0% vac · 8.0% maint · 8.0% mgmt
Financing live
Cash to close
- Down payment
- $19,975
- Closing costs
- $2,397
- Reserves months
- —
- Total cash needed
- —
Loan-product check · same deal, 3 products live
Conventional
25% down · 7.5% · 30yr
- Down + closing
- —
- Monthly P&I
- —
- Monthly cashflow
- —
- DSCR
- —
- Eligible?
- —
Personal DTI + credit; lowest rate.
DSCR
20% down · 8.5% · 30yr
- Down + closing
- —
- Monthly P&I
- —
- Monthly cashflow
- —
- DSCR
- —
- Eligible?
- —
No personal income docs; deal must DSCR.
Hard money
10% down · 12.0% · 12mo
- Down + closing
- —
- Monthly P&I
- —
- Monthly cashflow
- —
- DSCR
- —
- Eligible?
- —
Short-term bridge; refi at stabilization.
Listing history 19 events
-
2026-06-21days on market $79,900 Active 249 DOM
-
2026-06-19days on market $79,900 Active 247 DOM
-
2026-06-18days on market $79,900 Active 246 DOM
-
2026-06-17days on market $79,900 Active 245 DOM
-
2026-06-16days on market $79,900 Active 244 DOM
-
2026-06-15days on market $79,900 Active 243 DOM
-
2026-06-14days on market $79,900 Active 241 DOM
-
2026-06-12days on market $79,900 Active 240 DOM
-
2026-06-09days on market $79,900 Active 237 DOM
-
2026-06-08days on market $79,900 Active 236 DOM
-
2026-06-07days on market $79,900 Active 235 DOM
-
2026-06-07days on market $79,900 Active 234 DOM
-
2026-06-04days on market $79,900 Active 231 DOM
-
2026-06-02days on market $79,900 Active 230 DOM
-
2026-06-01days on market $79,900 Active 229 DOM
-
2026-05-31days on market $79,900 Active 228 DOM
-
2026-05-31days on market $79,900 Active 227 DOM
-
2026-01-16price $79,900 362-char remark
Show marketing remark (362 chars)
This cozy 3-bedroom, 1.5-bath home is brimming with potential and waiting for your personal touch. Whether you're a first-time buyer looking to build equity or an investor seeking a smart addition to your portfolio, this property checks all the boxes. At this price point, it is a rare find in today's market. Ideal for buyers looking to get in at a great value.
-
2025-10-15$88,500 Active 362-char remark
Show marketing remark (362 chars)
This cozy 3-bedroom, 1.5-bath home is brimming with potential and waiting for your personal touch. Whether you're a first-time buyer looking to build equity or an investor seeking a smart addition to your portfolio, this property checks all the boxes. At this price point, it is a rare find in today's market. Ideal for buyers looking to get in at a great value.
ⓘ Source: listings_history table (triggers on properties + properties_extension) + one-shot
backfill from property_details.listing_events for pre-trigger history.
Climate risk First Street
- Flood 1/10 Low FEMA zone X (unshaded) · 0% chance over 30 yrs
- Wildfire 5/10 Major
- Heat 6/10 Major 7 d/yr ≥111°F today · 20 d/yr by 30 yrs out
- Wind 2/10 Low 2% chance of damaging wind over 30 yrs
- Air quality 1/10 Low 0 unhealthy d/yr today · 0 by 30 yrs out
Nearby sold comps map
Loading sold comps map…
Walkable amenities ~0.75 mi
Loading nearby amenities…
Taxation est. · year 1
- Rental income
- $12,441
- − Mortgage interest
- −$4,476
- − Property taxes
- −$1,198
- − Insurance
- −$400
- − Repairs & maintenance
- −$995
- − Management
- −$995
- − Depreciation
- −$2,324
- Taxable income
- $2,053
- Est. tax owed @ 24.0%
- −$493
- After-tax cash flow
- $2,710/yr
For passive investors: Depreciation is non-cash, so a rental often shows a tax loss while cash-flowing — sheltering income. Rental losses are passive: they offset passive income freely, and up to $25,000/yr can offset ordinary (W-2) income if you actively participate and your MAGI is under $100k (phasing out to $0 by $150k); unused losses carry forward. On sale, claimed depreciation is recaptured at up to 25%, and gains may owe capital-gains tax (a 1031 exchange can defer both). Figures are a year-1 estimate at your 24.0% rate — not tax advice; consult a CPA.
Schools (NCES district)
- District
- Paris School District
- NCES district ID
- 0511130
- Math proficiency
- 41% ▼ -9.00%
- Reading proficiency
- 37% ▼ -6.00%
- Median HH income
- $34,950
- Composite
- 32.25/100
- National rank
- #5763
- State rank
- #83 of 238 in AR
Livability — Paris
- Score
- 69/100
- State rank
- #68
- US rank
- #8544
Category grades
Schools grade is shown separately in the Schools card above.
Census & demographics
- Census place
- Paris, AR
- Population (ZIP)
- 6,462
Population outlook (Logan County) Hauer SSP2
- Today (2025)
- 21,046 people
- By 2030
- 20,537 · -2.4%
- By 2040
- 19,443 · -7.6%
- By 2050
- 18,220 · -13.4%
- By 2075
- 16,164 · -23.2%
- By 2100
- 14,858 · -29.4%
Race, ethnicity, and origin ACS 2023
- Neighborhood character
- Predominantly White (87%)
- Race & ethnicity
- White 87% Two or more races 8% Asian 3% Hispanic / Latino 2%
- Common ancestry
- Italian 1% Serbian 1% Lithuanian 1%
- Foreign-born
- 2% · China, Vietnam
- Languages at home
- 95% English-only · Spanish 3% Other Asian/Pacific 1% Chinese 1%
Political lean MEDSL · Logan
- 2024 margin
- Solid R (+62.2) · D 17.8% · R 80.0% · Other 2.1%
- 2008→2024 swing
- -23.5pp toward R · 2008: -38.8pp · 2024: -62.2pp
- All cycles
- 2024: R+62.2 2020: R+59.5 2016: R+51.4 2012: R+41.9 2008: R+38.8
Not yet ingested
- Civics
- —
Market trends
- HPI YoY
- ▼ -15.40%
- Current HPI
- 170.513
- Rent YoY
- —
- Metro
- —
- State GDP YoY
- ▲ 3.80%
- F500 in state
- 10
Industry mix (Fortune 500 HQ in AR)
| Industry | F500 HQs | Revenue |
|---|---|---|
| Retail | 1 | $681B |
|
||
| Food / Agriculture | 1 | $53B |
|
||
| Retail / Energy | 1 | $22B |
|
||
| Transportation / Logistics | 1 | $12B |
|
||
| Energy | 1 | $4B |
|
||
Price history
-9.7% since first listed2 events — show timeline
- 2026-01-16 Price Changed $79,900 WRVBOR
- 2025-10-15 Listed $88,500 WRVBOR
Property tax history
+7.6%/yrLatest (2024): $58 · -56.1% YoY. Source: county tax records.
Cash-flow waterfall
monthlySold comps — $/sqft
last 12 mo · ≤1 miLoading sold comps…