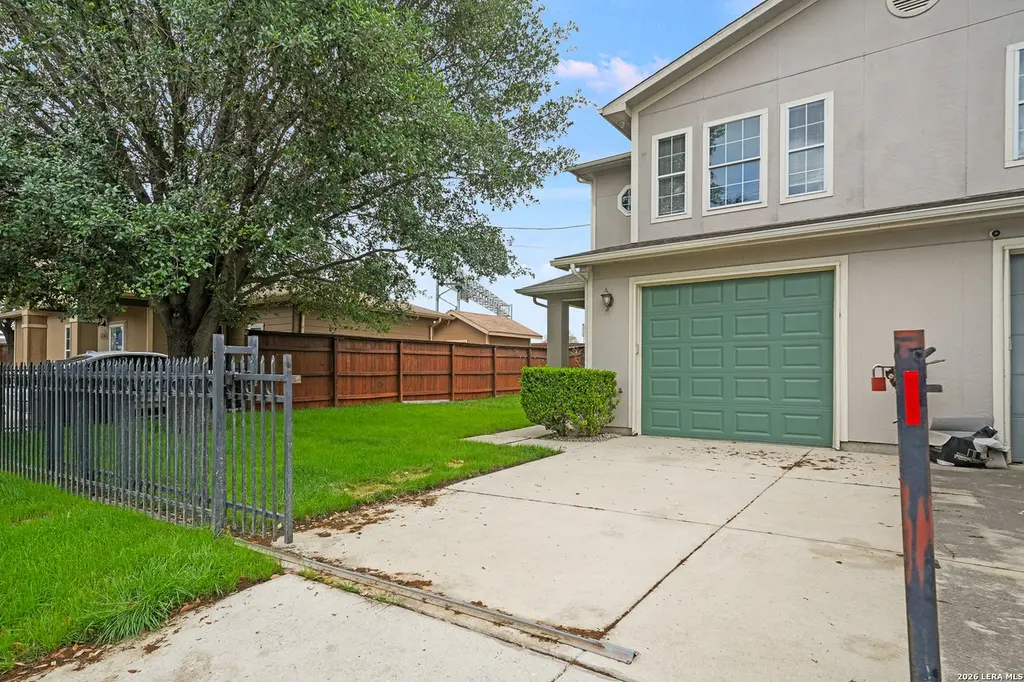
2910 Owasso St · San Antonio, TX
Flood risk 1/10 · Minimal
- FEMA flood zone
- X (unshaded)
- Chance of flooding over 30 yrs
- 0.0%
- Est. flood insurance / yr
- $507 – $1,088
Fire risk 4/10 · Minor
- Est. fire insurance / yr
- $1,222 – $2,270
Heat risk 8/10 · Major
- Hot days now (above 109°F)
- 7 days/yr
- Hot days in 30 yrs
- 22 days/yr
Wind risk 8/10 · Major
- Chance of severe wind over 30 yrs
- 80.0%
Air-quality risk 2/10 · Minimal
- Unhealthy air days now
- 0 days/yr
- Unhealthy air days in 30 yrs
- 1 days/yr
Risk factors via First Street. Map © Google.
Why this score? — see what drove the D- grade
The composite is a weighted blend of 9 inputs, each scored 0–100. Each bar is that input's sub-score; the figure is the points it added to the 100-point composite (weight × sub-score).
- Cash flow +10.5/30.0
- Appreciation +4.8/10.0
- Livability +4.0/5.0
- 1% rule +3.6/10.0
- DSCR +3.0/10.0
- ARV discount +3.0/15.0
- Rent growth +2.5/5.0
- Condition / age +2.5/5.0
- Schools +1.4/10.0
$179,000
🖨 Deal sheet (PDF) 📄 Offer letter ✓ Due diligence
Listing remarks
Welcome to 2910 Owasso St, a move-in ready home offering comfort, space, and great value in San Antonio. Enjoy a bright, functional layout with natural light throughout, comfortable living areas, and a kitchen with plenty of space for everyday use. The bedrooms are well-sized, making it easy to settle in and feel at home. Step outside to a spacious yard with room to relax, entertain, or make it your own. Conveniently located near major highways, shopping, and dining, this home offers both accessibility and everyday ease. Owner financing available with attractive terms, including a lower interest rate on a 30-year note. Sales price is $170,000 with a minimum 3 percent down payment, making t
Key facts
- Spacious yard
- Move in ready
- Conveniently located
Tags
Property features AI
Finance
- Financial info: Down payment resource not available
- HOA & community: Subdivision: PALO ALTO; Subdivision legal name: QUINTANA/SOUTH SAN AREA (SS)
Exterior
- Parking: Attached 2-car garage
- Utilities: City water and sewer
- Home design: Pre-owned property; Approximate age: 16 years
- Construction: Slab foundation; Composition roof
- Exterior features: Wood exterior
Interior
- Kitchen: Kitchen dimensions: 14 x 10; Stove/Range; Vent fan
- Bedrooms: Master bedroom (upper level) with full bath; Bedroom 2: 11 x 11; Bedroom 3: 11 x 11; Master bedroom dimensions: 14 x 12
- Flooring: Carpeting; Ceramic tile flooring
- Bathrooms: Total: 3 bathrooms (2 full, 1 half); Master bath with tub/shower combination (10 x 10)
- Heating & cooling: Central heating (electric); Central air conditioning
- Interior features: Ceiling fans; Garage door opener; City garbage service; Cable TV available; High-speed internet; Some window coverings remain; 1 living area; Separate dining room; Laundry room; Washer and dryer connections; Vent fan; Electric water heater; Stove/Range
- Laundry & utility: Laundry room with washer and dryer connections; Electric water heater
Neighborhood map
What this means for you Summary
Snapshot
- This is a 3-bed/2.5-bath townhouse listed at $179k.
Deal economics
- At list price, monthly cash flow is $-93 ($-1k/yr) — negative.
- To cash-flow at today's rent, offer at most $163k (9.2% below list).
- To meet the 1% rule (rent ≥ 1% of price), the offer needs to be $154k (13.7% below list).
- Recommended offer: $154k (13.7% below list) — sets the bar for 1% rule.
- Cap rate 5.7% vs local median 3.8% in San Antonio — top-decile yield for the area; either an underpriced asset or a hidden risk that comps aren't pricing in. Stress-test before assuming the spread holds.
Location & tenants
- Location reads 80/100 on livability (#31 in TX, #1,616 nationally) — a professional / high-income tenant draw. Strengths: amenities A+, commute A+, cost of living A+; Watch: crime F.
- South San Antonio ISD (urban): math 13% / reading 20% proficiency, ranked #804 of 826 in TX (top 97%) — low school quality limits family demand, transient renter base, plan for 1-2y turnover.
- Zoned schools: Palo Alto El (math 12% / reading 17%, grade F, #4,048 of 4,322 statewide, top 95%, 429 students, 95% FRL); South San Antonio H S (math 27% / reading 32%, grade F, #1,112 of 1,632 statewide, top 70%, 1,786 students, 93% FRL) — zoned schools average 94% FRL vs 42% district-wide (52 pts higher); higher-poverty schools than district average — tighter screening recommended.
- Market conditions: 162 active listings in the ZIP; 22 comparable units currently listed for rent nearby; rentals at typical pace (median 26d on market — plan ~3-4 weeks tenant-placement turnaround); 8,308 units permitted in Bexar County in 2024 (2,506 in 5+ unit buildings).
- This rent runs 33% of the median local income ($55k/yr) — at the standard rent-burdened threshold; future hikes will face affordability resistance.
Forward outlook
- In year one you build about $434 of equity ($1k loan paydown + $-804 appreciation (-0.5% local appreciation)).
- Bexar County population projected at +50% by 2050 — long-run rental-demand tailwind backs the buy-and-hold thesis.
Negotiation context
- It's been on market 48 days — a 3% lower offer ($174k) is reasonable based on typical stale-listing flexibility.
Risks & watch-outs
- Climate carrying-cost: severe wind risk, 80% chance of damaging wind over 30y; extreme-heat days projected 7→22/yr by 2055 (HVAC capex compounding) — expect insurance premiums to compound above CPI over the hold.
Questions for the listing agent
- What do current leases actually rent for vs. the listed asking? Can we see a recent rent roll and the last 12 months of T-12 income?
- It's been on market 48 days. Have you received any prior offers? Is the seller open to a 14% concession, seller financing, or rate buy-down credit?
- Is there a deadline driving the sale (1031 exchange, divorce, estate, relocation)? That informs how much negotiation room exists.
- Crime grade is F in this area — have there been break-ins, vandalism, or insurance claims at this property in the last 3 years? What carrier currently insures it and at what premium?
- The area grade is low — what's the realistic commute time and amenity access for the typical tenant pool here? Any planned neighborhood developments (good or bad) we should know about?
- What's the average days-on-market for RENTAL listings here right now (not sales)? A rising rental-DOM trend means longer vacancies and softer asking-rent achievability than the comps imply.
- What's the recent tenant-quality profile in this submarket — average credit score on applications, eviction rate, late-payment / NSF rate, and stable-employment percentage? A property-management company in the area should have these aggregated.
- How much new for-sale + rental construction is in the pipeline within 1–3 miles? Heavy new supply typically softens prices + rents 12–24 months out; constrained supply supports both.
Investment metrics
- 1% rule
- 0.86% ✗
- Cap rate
- 5.67%
- Cash-on-cash
- -2.23%
- DSCR
- 0.90
- GRM
- 9.7
CMA / ARV
- ARV (median comp)
- $162,714
- List price
- $179,000
- Delta
- 10.01%
- Verdict
- OVERPRICED
- Comps
- 20 within 1.0 mi
Projected returns pro-forma
-0.45% appreciation · 3.0% rent growth · sell at horizon
- IRR
- -6.5%
- Equity multiple
- 0.70×
- Total profit
- $-14,854
- Equity at exit
- $47,993
- IRR
- -0.2%
- Equity multiple
- 0.98×
- Total profit
- $-964
- Equity at exit
- $54,599
Cash invested: $50,120 (down + closing). Projections, not guarantees.
Landlord ↔ Tenant lean methodology
- Overall (STATE)
- 87 Strongly Landlord-Friendly
- State Texas
- 87 Strongly Landlord-Friendly · R+5
- County
- — inherits STATE
- City
- — inherits STATE
ZIP-level market 78211
- Home prices YoY
- -0.2%
- Active inventory
- 162
- Price-to-rent
- 9.7×
Monthly cashflow live
- Estimated rent
- $1,544 high interval (Pro) →
- Mortgage (P&I)
- −$939
- Tax from tax record
- −$300 /mo · $3,598/yr
- Insurance
- −$75
- HOA
- −$0
- Vacancy / Maint / Mgmt
- −$324
- Net cashflow
- $-93
Break-even live
Sensitivity live
| Price | -10% $8 | -5% $-43 | +0% $-93 | +5% $-144 | +10% $-195 |
|---|---|---|---|---|---|
| Rent | -10% $-215 | -5% $-154 | +0% $-93 | +5% $-32 | +10% $29 |
| Rate | -1.0pp $-3 | -0.5pp $-48 | base $-93 | +0.5pp $-140 | +1.0pp $-187 |
UW: 25.0% down · 7.5% · 30yr · 1.5% tax · 5.0% vac · 8.0% maint · 8.0% mgmt
Financing live
Cash to close
- Down payment
- $44,750
- Closing costs
- $5,370
- Reserves months
- —
- Total cash needed
- —
Loan-product check · same deal, 3 products live
Conventional
25% down · 7.5% · 30yr
- Down + closing
- —
- Monthly P&I
- —
- Monthly cashflow
- —
- DSCR
- —
- Eligible?
- —
Personal DTI + credit; lowest rate.
DSCR
20% down · 8.5% · 30yr
- Down + closing
- —
- Monthly P&I
- —
- Monthly cashflow
- —
- DSCR
- —
- Eligible?
- —
No personal income docs; deal must DSCR.
Hard money
10% down · 12.0% · 12mo
- Down + closing
- —
- Monthly P&I
- —
- Monthly cashflow
- —
- DSCR
- —
- Eligible?
- —
Short-term bridge; refi at stabilization.
Rent comps 22 comps
| Address | Beds | Baths | Sqft | Rent | $/sqft | DOM | Units | Dist |
|---|---|---|---|---|---|---|---|---|
| 9018 Chaminade Dr San Antonio, TX | 3.0 | 1.5 | 1056 | $1,675 | $1.59 | 45d | 1 | 0.79mi |
| 3810 Kurz Plz S San Antonio, TX | 3.0 | 2.0 | 1266 | $550 | $0.43 | 25d | 1 | 1.12mi |
| 3632 SW Military Dr #2 San Antonio, TX | 3.0 | 2.0 | 900 | $995 | $1.11 | 45d | 1 | 1.13mi |
| 3903 Kurz Plz S San Antonio, TX | 4.0 | 2.0 | 1627 | $2,000 | $1.23 | 0d | 1 | 1.16mi |
| 3911 Bates Pl San Antonio, TX | 3.0 | 2.0 | 1200 | $1,450 | $1.21 | 25d | 1 | 1.20mi |
| 8622 S Zarzamora St #423 San Antonio, TX | 3.0 | 2.0 | 1100 | $1,600 | $1.45 | 45d | 1 | 1.21mi |
| 1862 Kendalia Ave San Antonio, TX | 3.0 | 1.0 | 1345 | $1,350 | $1.00 | 25d | 1 | 1.25mi |
| 1243 Gillette Blvd San Antonio, TX | 3.0 | 2.0 | 1456 | $1,500 | $1.03 | 25d | 1 | 1.30mi |
| 3723 Somers Crst San Antonio, TX | 3.0 | 2.5 | 1529 | $1,650 | $1.08 | 45d | 1 | 1.31mi |
| 3811 Somers Crst San Antonio, TX | 3.0 | 2.5 | 1529 | $1,650 | $1.08 | 45d | 1 | 1.31mi |
| 9257 Somerset Rd Unit 710 San Antonio, TX | 2.0 | 2.0 | 1133 | $1,165 | $1.03 | 0d | 1 | 1.35mi |
| 9306 Somers Bnd San Antonio, TX | 3.0 | 2.5 | 1420 | $1,600 | $1.13 | 25d | 1 | 1.35mi |
| 4007 Somers Crst San Antonio, TX | 3.0 | 2.0 | 1242 | $1,525 | $1.23 | 6d | 1 | 1.35mi |
| 9334 Somers Bnd San Antonio, TX | 3.0 | 2.5 | 1272 | $1,515 | $1.19 | 6d | 1 | 1.40mi |
| 9402 Somers Bnd San Antonio, TX | 3.0 | 2.5 | 1529 | $1,600 | $1.05 | 12d | 1 | 1.41mi |
| 9407 Somers Bnd San Antonio, TX | 3.0 | 2.5 | 1310 | $1,525 | $1.16 | 25d | 1 | 1.43mi |
| 9422 Somers Bnd San Antonio, TX | 3.0 | 2.5 | 1419 | $1,575 | $1.11 | 45d | 1 | 1.45mi |
| 9435 Dogwood Hl San Antonio, TX | 3.0 | 2.5 | 1529 | $1,600 | $1.05 | 45d | 1 | 1.45mi |
| 9122 Campbell Way San Antonio, TX | 3.0 | 2.0 | 1354 | $1,495 | $1.10 | 4d | 1 | 1.46mi |
| 3439 Twining Dr San Antonio, TX | 3.0 | 1.0 | 1124 | $1,500 | $1.33 | 19d | 1 | 1.46mi |
| 9323 Somerset Rd Unit 710 San Antonio, TX | 2.0 | 2.0 | 954 | $973 | $1.02 | 0d | 1 | 1.47mi |
| 9419 Graze Br San Antonio, TX | 3.0 | 2.0 | 1242 | $1,550 | $1.25 | 19d | 1 | 1.48mi |
Listing history 11 events
-
2026-06-13statusdays on market $179,000 Pending 48 DOM
-
2026-06-09days on market $179,000 Active 47 DOM
-
2026-06-08days on market $179,000 Active 46 DOM
-
2026-06-07days on market $179,000 Active 45 DOM
-
2026-06-04days on market $179,000 Active 42 DOM
-
2026-06-03days on market $179,000 Active 41 DOM
-
2026-06-02days on market $179,000 Active 40 DOM
-
2026-06-01days on market $179,000 Active 39 DOM
-
2026-05-31days on market $179,000 Active 38 DOM
-
2026-04-24price $179,000 849-char remark
-
2026-04-21$170,000 New 849-char remark
ⓘ Source: listings_history table (triggers on properties + properties_extension) + one-shot
backfill from property_details.listing_events for pre-trigger history.
Tax reassessment forecast TX · Resets to sale price
- Current annual tax
- $3,598 · $300/mo
- Projected year-2 tax
- $3,598 · $300/mo
- Expected delta
- $0/yr ($0/mo · 0.0%)
ⓘ Screening estimate from a state-policy table — verify with the county assessor before closing.
Climate risk First Street
- Flood 1/10 Low FEMA zone X (unshaded) · 0% chance over 30 yrs
- Wildfire 4/10 Moderate
- Heat 8/10 Severe 7 d/yr ≥109°F today · 22 d/yr by 30 yrs out
- Wind 8/10 Severe 80% chance of damaging wind over 30 yrs
- Air quality 2/10 Low 0 unhealthy d/yr today · 1 by 30 yrs out
Nearby sold comps map
Loading sold comps map…
Walkable amenities ~0.75 mi
Loading nearby amenities…
Taxation est. · year 1
- Rental income
- $18,528
- − Mortgage interest
- −$10,027
- − Property taxes
- −$3,598
- − Insurance
- −$895
- − Repairs & maintenance
- −$1,482
- − Management
- −$1,482
- − Depreciation
- −$5,207
- Taxable loss
- −$4,163
- Est. tax savings @ 24.0%
- +$999
- After-tax cash flow
- $-121/yr
For passive investors: Depreciation is non-cash, so a rental often shows a tax loss while cash-flowing — sheltering income. Rental losses are passive: they offset passive income freely, and up to $25,000/yr can offset ordinary (W-2) income if you actively participate and your MAGI is under $100k (phasing out to $0 by $150k); unused losses carry forward. On sale, claimed depreciation is recaptured at up to 25%, and gains may owe capital-gains tax (a 1031 exchange can defer both). Figures are a year-1 estimate at your 24.0% rate — not tax advice; consult a CPA.
Schools (NCES district)
- District
- South San Antonio ISD
- NCES district ID
- 4840680
- Math proficiency
- 13% ▼ -20.00%
- Reading proficiency
- 20% ▼ -10.00%
- Median HH income
- $35,460
- Composite
- 13.6/100
- National rank
- #9511
- State rank
- #804 of 826 in TX
Livability — San Antonio
- Score
- 80/100
- State rank
- #31
- US rank
- #1616
Category grades
Schools grade is shown separately in the Schools card above.
Census & demographics
- Census place
- San Antonio, TX
- County
- Bexar County · 1,990,555 people
- City population
- 1,806,925
- Metro
- San Antonio-New Braunfels, TX
- Population (ZIP)
- 30,857
- Household income
- $55,436
- Rent vs Own
- Severe rent burden
- 729.0
Population outlook (Bexar County) Hauer SSP2
- Today (2025)
- 2,336,851 people
- By 2030
- 2,560,728 · +9.6%
- By 2040
- 3,020,569 · +29.3%
- By 2050
- 3,493,522 · +49.5%
- By 2075
- 4,668,459 · +99.8%
- By 2100
- 5,533,242 · +136.8%
Race, ethnicity, and origin ACS 2023
- Neighborhood character
- Predominantly Hispanic (93%)
- Race & ethnicity
- Hispanic / Latino 93% Two or more races 30% White 5% Black 1% Native American 1%
- Hispanic origin (detail)
- Mexican 76%
- Foreign-born
- 18% · Canada
- Languages at home
- 35% English-only · Spanish 65%
Political lean MEDSL · Bexar
- 2024 margin
- Lean D (+9.8) · D 54.3% · R 44.6% · Other 1.1%
- 2008→2024 swing
- +4.2pp toward D · 2008: 5.6pp · 2024: 9.8pp
- All cycles
- 2024: D+9.8 2020: D+18.2 2016: D+13.5 2012: D+4.6 2008: D+5.6
Not yet ingested
- Civics
- —
Market trends
- HPI YoY
- ▼ -0.45%
- Current HPI
- 241.1709
- Rent YoY
- —
- Metro
- San Antonio-New Braunfels, TX
- State GDP YoY
- ▲ 3.95%
- F500 in state
- 110
Industry mix (Fortune 500 HQ in TX)
| Industry | F500 HQs | Revenue |
|---|---|---|
| Energy | 16 | $1,198B |
|
||
| Technology | 5 | $198B |
|
||
| Engineering / Construction | 4 | $72B |
|
||
| Energy Services | 3 | $60B |
|
||
| Utilities | 3 | $41B |
|
||
| Healthcare | 2 | $330B |
|
||
Price history
+5.3% since first listed3 events — show timeline
- 2026-06-10 Pending — LERA
- 2026-04-24 Price Changed $179,000 LERA
- 2026-04-21 Listed $170,000 LERA
Property tax history
+3.5%/yrLatest (2025): $3,598 · -13.7% YoY. Source: county tax records.
Cash-flow waterfall
monthlySold comps — $/sqft
last 12 mo · ≤1 miLoading sold comps…