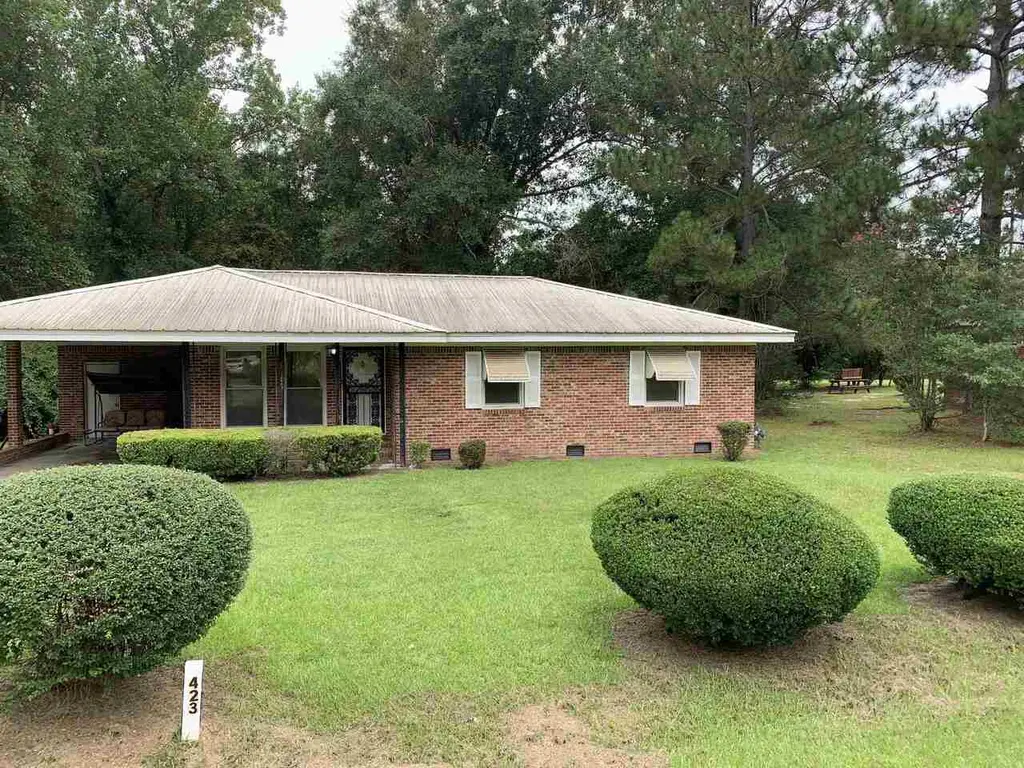
423 William Rountree St · Swainsboro, GA
Flood risk 1/10 · Minimal
- FEMA flood zone
- X (unshaded)
- Chance of flooding over 30 yrs
- 0.0%
- Est. flood insurance / yr
- $507 – $1,088
Fire risk 4/10 · Minor
- Est. fire insurance / yr
- $963 – $1,789
Heat risk 7/10 · Major
- Hot days now (above 108°F)
- 7 days/yr
- Hot days in 30 yrs
- 18 days/yr
Wind risk 8/10 · Major
- Chance of severe wind over 30 yrs
- 80.0%
Air-quality risk 2/10 · Minimal
- Unhealthy air days now
- 0 days/yr
- Unhealthy air days in 30 yrs
- 1 days/yr
Risk factors via First Street. Map © Google.
Why this score? — see what drove the B- grade
The composite is a weighted blend of 9 inputs, each scored 0–100. Each bar is that input's sub-score; the figure is the points it added to the 100-point composite (weight × sub-score).
- Cash flow +30.0/30.0
- 1% rule +10.0/10.0
- DSCR +10.0/10.0
- ARV discount +7.5/15.0
- Livability +2.9/5.0
- Rent growth +2.5/5.0
- Condition / age +2.5/5.0
- Schools +2.3/10.0
- Appreciation +0.0/10.0
$70,000
🖨 Deal sheet 📄 Offer letter ✓ Due diligence
Listing remarks
This charming 3 bedroom 2 Bath Brick Home sits on a nice large lot. New windows. HVAC is a few years old. Metal roof. Enjoy the private backyard perfect for grilling with family and friends. Close to downtown. Home is being sold As-Is. Call Jean to schedule a tour.
Key facts
- Metal roof
- Private backyard
- Large lot
Tags
Property features AI
Finance
- HOA & community: No HOA
Exterior
- Parking: Carport; Parking pad; Open parking; Parking at kitchen level
- Utilities: Public water; Public sewer (connected); Sewer available
- Home design: Single family residence (house); Resale property; Built in 1970
- Construction: Brick construction; Metal roof; Total building area 1556 (public records)
- Exterior features: Private lot
Interior
- Kitchen: Laundry area located in the kitchen
- Bedrooms: 3 bedrooms on the main level
- Flooring: Laminate flooring
- Bathrooms: 2 full bathrooms on the main level
- Heating & cooling: Electric central heating; Central electric cooling
- Interior features: One-level living; Foyer; Bonus room; Crawl space basement
- Laundry & utility: Laundry in kitchen
Neighborhood map
What this means for you Summary
Snapshot
- This is a 2-bed/1.0-bath single-family listed at $70k.
Deal economics
- At list price, monthly cash flow is $386 ($5k/yr) — positive.
- The deal already cash-flows at list — no discount required.
- Meets the 1% rule at list price ($1k rent vs $70k).
- Cap rate 12.9% vs local median 5.2% in Swainsboro — top-decile yield for the area; either an underpriced asset or a hidden risk that comps aren't pricing in. Stress-test before assuming the spread holds.
Location & tenants
- Location reads 58/100 on livability (#450 in GA) — a working-class tenant base; expect higher turnover. Strengths: cost of living A+, housing A+; Watch: crime D+, amenities F, commute F.
- Emanuel County (town): math 27% / reading 30% proficiency, ranked #110 of 174 in GA (top 63%) — low school quality limits family demand, transient renter base, plan for 1-2y turnover; 71% free/reduced lunch — lower-income household profile, screen leases tightly.
- Zoned schools: Swainsboro Middle School (math 16% / reading 28%, grade F, #333 of 470 statewide, top 72%, 647 students, 98% FRL); Swainsboro High School (math 21% / reading 22%, grade F, #218 of 424 statewide, top 53%, 810 students, 98% FRL) — zoned schools average 98% FRL vs 71% district-wide (28 pts higher); higher-poverty schools than district average — tighter screening recommended.
- Market conditions: 81 active listings in the ZIP; 76 units permitted in Emanuel County in 2024 (0 in 5+ unit buildings).
Forward outlook
- Local home prices are declining (-3.0%/yr); year-one equity from $484 of loan paydown is wiped out by about $2k of value loss. Plan a longer hold.
- Emanuel County population projected at -15% by 2050 — secular population decline; favor cash flow + early exit over multi-decade hold.
- At projected returns (-3.0% appreciation + 3.0% rent growth), your $20k cash investment doubles in ~6 years — after that, you're playing with house money.
Negotiation context
- Only 6 days on market — expect competitive offers; lowballing is unlikely to land.
- 2 sale attempts since 5y ago with the ask held roughly flat each time — persistent listings suggest the price (not the market) is what's stuck; bring a comps-based counter.
Risks & watch-outs
- Climate carrying-cost: severe wind risk, 80% chance of damaging wind over 30y; extreme-heat days projected 7→18/yr by 2055 (HVAC capex compounding) — expect insurance premiums to compound above CPI over the hold.
Questions for the listing agent
- Built in 1970 — when were the roof, HVAC, electrical panel, plumbing, and water heater last replaced?
- Is there a deadline driving the sale (1031 exchange, divorce, estate, relocation)? That informs how much negotiation room exists.
- Schools are F-rated, which usually means shorter tenancies and higher turnover. Who's the typical renter profile here, and what's been the actual vacancy rate?
- Crime grade is D in this area — have there been break-ins, vandalism, or insurance claims at this property in the last 3 years? What carrier currently insures it and at what premium?
- What's the average days-on-market for RENTAL listings here right now (not sales)? A rising rental-DOM trend means longer vacancies and softer asking-rent achievability than the comps imply.
- What's the recent tenant-quality profile in this submarket — average credit score on applications, eviction rate, late-payment / NSF rate, and stable-employment percentage? A property-management company in the area should have these aggregated.
- How much new for-sale + rental construction is in the pipeline within 1–3 miles? Heavy new supply typically softens prices + rents 12–24 months out; constrained supply supports both.
Investment metrics
- 1% rule
- 1.55% ✓
- Cap rate
- 12.91%
- Cash-on-cash
- 23.65%
- DSCR
- 2.05
- GRM
- 5.4
CMA / ARV
- ARV (on-the-fly)
- $205,392
- Comps found
- 5
Show comp detail 5 sales within ~0.75 mi
| Address | Dist | Beds/Ba | Sqft | Sold | Price | $/sf | Match |
|---|---|---|---|---|---|---|---|
| 423 William Rountree St | 0.01mi | 3/2.0 (+1) | 1,556 (0%) | 0mo | $65,000 | $42 | 90 |
| 402 N Main St | 0.57mi | 3/1.0 (+1) | 1,648 (+6%) | 4mo | $80,000 | $49 | 56 |
| 213 New Turner Dr | 0.67mi | 3/2.0 (+1) | 1,562 (+0%) | 13mo | $225,000 | $144 | 48 |
| 117 Canterbury Ln | 0.62mi | 3/2.0 (+1) | 1,685 (+8%) | 15mo | $223,000 | $132 | 35 |
| 161 Ponderosa Dr | 0.65mi | 3/2.5 (+1) | 1,692 (+9%) | 21mo | $230,000 | $136 | 26 |
Match score weights: distance 35% · size 25% · config 20% · recency 20%. Top-matched comps best support the ARV.
Projected returns pro-forma
-3.0% appreciation · 3.0% rent growth · sell at horizon
- IRR
- 16.8%
- Equity multiple
- 1.68×
- Total profit
- $13,264
- Equity at exit
- $10,437
- IRR
- 25.3%
- Equity multiple
- 3.21×
- Total profit
- $43,262
- Equity at exit
- $6,052
Cash invested: $19,600 (down + closing). Projections, not guarantees.
Landlord ↔ Tenant lean methodology
- Overall (STATE)
- 90 Strongly Landlord-Friendly
- State Georgia
- 90 Strongly Landlord-Friendly · R+3
- County
- — inherits STATE
- City
- — inherits STATE
ZIP-level market 30401
- Home prices YoY
- -11.8%
- Active inventory
- 81
- Price-to-rent
- 5.4×
Monthly cashflow live
- Estimated rent
- $1,087 medium interval (Pro) →
- Mortgage (P&I)
- −$367
- Tax from tax record
- −$76 /mo · $911/yr
- Insurance
- −$29
- HOA
- −$0
- Vacancy / Maint / Mgmt
- −$228
- Net cashflow
- $386
Break-even live
UW: 25.0% down · 7.5% · 30yr · 1.5% tax · 5.0% vac · 8.0% maint · 8.0% mgmt
Financing live
Cash to close
- Down payment
- $17,500
- Closing costs
- $2,100
- Reserves months
- —
- Total cash needed
- —
Loan-product check · same deal, 3 products live
Conventional
25% down · 7.5% · 30yr
- Down + closing
- —
- Monthly P&I
- —
- Monthly cashflow
- —
- DSCR
- —
- Eligible?
- —
Personal DTI + credit; lowest rate.
DSCR
20% down · 8.5% · 30yr
- Down + closing
- —
- Monthly P&I
- —
- Monthly cashflow
- —
- DSCR
- —
- Eligible?
- —
No personal income docs; deal must DSCR.
Hard money
10% down · 12.0% · 12mo
- Down + closing
- —
- Monthly P&I
- —
- Monthly cashflow
- —
- DSCR
- —
- Eligible?
- —
Short-term bridge; refi at stabilization.
Listing history 9 events
-
2026-06-01status $70,000 Under Contract 6 DOM
-
2026-06-01days on market $70,000 New 6 DOM
-
2026-05-31days on market $70,000 New 5 DOM
-
2026-05-31days on market $70,000 New 4 DOM
-
2026-05-20$70,000 New
-
2021-09-27historical
-
2021-09-11price $70,000
-
2021-09-05price $85,000
-
2021-06-22$125,000 New
ⓘ Source: listings_history table (triggers on properties + properties_extension) + one-shot
backfill from property_details.listing_events for pre-trigger history.
Tax reassessment forecast GA · Resets to sale price
- Current annual tax
- $911 · $76/mo
- Projected year-2 tax
- $911 · $76/mo
- Expected delta
- $0/yr ($0/mo · 0.0%)
ⓘ Screening estimate from a state-policy table — verify with the county assessor before closing.
Climate risk First Street
- Flood 1/10 Low FEMA zone X (unshaded) · 0% chance over 30 yrs
- Wildfire 4/10 Moderate
- Heat 7/10 Severe 7 d/yr ≥108°F today · 18 d/yr by 30 yrs out
- Wind 8/10 Severe 80% chance of damaging wind over 30 yrs
- Air quality 2/10 Low 0 unhealthy d/yr today · 1 by 30 yrs out
Nearby sold comps map
Loading sold comps map…
Walkable amenities ~0.75 mi
Loading nearby amenities…
Taxation est. · year 1
- Rental income
- $13,039
- − Mortgage interest
- −$3,921
- − Property taxes
- −$911
- − Insurance
- −$350
- − Repairs & maintenance
- −$1,043
- − Management
- −$1,043
- − Depreciation
- −$2,036
- Taxable income
- $3,734
- Est. tax owed @ 24.0%
- −$896
- After-tax cash flow
- $3,738/yr
For passive investors: Depreciation is non-cash, so a rental often shows a tax loss while cash-flowing — sheltering income. Rental losses are passive: they offset passive income freely, and up to $25,000/yr can offset ordinary (W-2) income if you actively participate and your MAGI is under $100k (phasing out to $0 by $150k); unused losses carry forward. On sale, claimed depreciation is recaptured at up to 25%, and gains may owe capital-gains tax (a 1031 exchange can defer both). Figures are a year-1 estimate at your 24.0% rate — not tax advice; consult a CPA.
Schools (NCES district)
- District
- Emanuel County
- NCES district ID
- 1302040
- Math proficiency
- 27% ▼ -4.00%
- Reading proficiency
- 30% ▬ 0.00%
- Median HH income
- $31,771
- Composite
- 23.21/100
- National rank
- #7941
- State rank
- #110 of 174 in GA
Livability — Swainsboro
- Score
- 58/100
- State rank
- #450
- US rank
- #21414
Category grades
Schools grade is shown separately in the Schools card above.
Census & demographics
- Census place
- Swainsboro, GA
- City population
- 14,232
- Population (ZIP)
- 14,232
Population outlook (Emanuel County) Hauer SSP2
- Today (2025)
- 22,093 people
- By 2030
- 21,595 · -2.3%
- By 2040
- 20,343 · -7.9%
- By 2050
- 18,759 · -15.1%
- By 2075
- 14,327 · -35.2%
- By 2100
- 8,496 · -61.5%
Race, ethnicity, and origin ACS 2023
- Neighborhood character
- Diverse neighborhood (Simpson 0.60)
- Race & ethnicity
- White 50% Black 39% Hispanic / Latino 7% Two or more races 5% Asian 1%
- Hispanic origin (detail)
- Mexican 6%
- Common ancestry
- Italian 3% Slovak 1%
- Foreign-born
- 4% · Canada
- Languages at home
- 93% English-only · Spanish 6% Other Indo-European 1%
Political lean MEDSL · Emanuel
- 2024 margin
- Solid R (+44.1) · D 27.8% · R 71.9%
- 2008→2024 swing
- -19.4pp toward R · 2008: -24.8pp · 2024: -44.1pp
- All cycles
- 2024: R+44.1 2020: R+38.6 2016: R+37.0 2012: R+26.9 2008: R+24.8
Not yet ingested
- Civics
- —
Market trends
- HPI YoY
- ▼ -27.97%
- Current HPI
- 209.5498
- Rent YoY
- —
- Metro
- —
- State GDP YoY
- ▲ 2.66%
- F500 in state
- 28
Industry mix (Fortune 500 HQ in GA)
| Industry | F500 HQs | Revenue |
|---|---|---|
| Paper / Packaging | 2 | $29B |
|
||
| Retail | 1 | $160B |
|
||
| Transportation / Logistics | 1 | $91B |
|
||
| Airlines | 1 | $62B |
|
||
| Consumer Goods | 1 | $47B |
|
||
| Utilities | 1 | $25B |
|
||
Price history
-44.0% since first listed5 events — show timeline
- 2026-05-20 Listed $70,000 GAMLS
- 2021-09-27 Listing Removed — GAMLS
- 2021-09-11 Price Changed $70,000 GAMLS
- 2021-09-05 Price Changed $85,000 GAMLS
- 2021-06-22 Listed $125,000 GAMLS
Property tax history
+1.0%/yrLatest (2025): $911 · +1.6% YoY. Source: county tax records.
Cash-flow waterfall
monthlySold comps — $/sqft
last 12 mo · ≤1 miLoading sold comps…