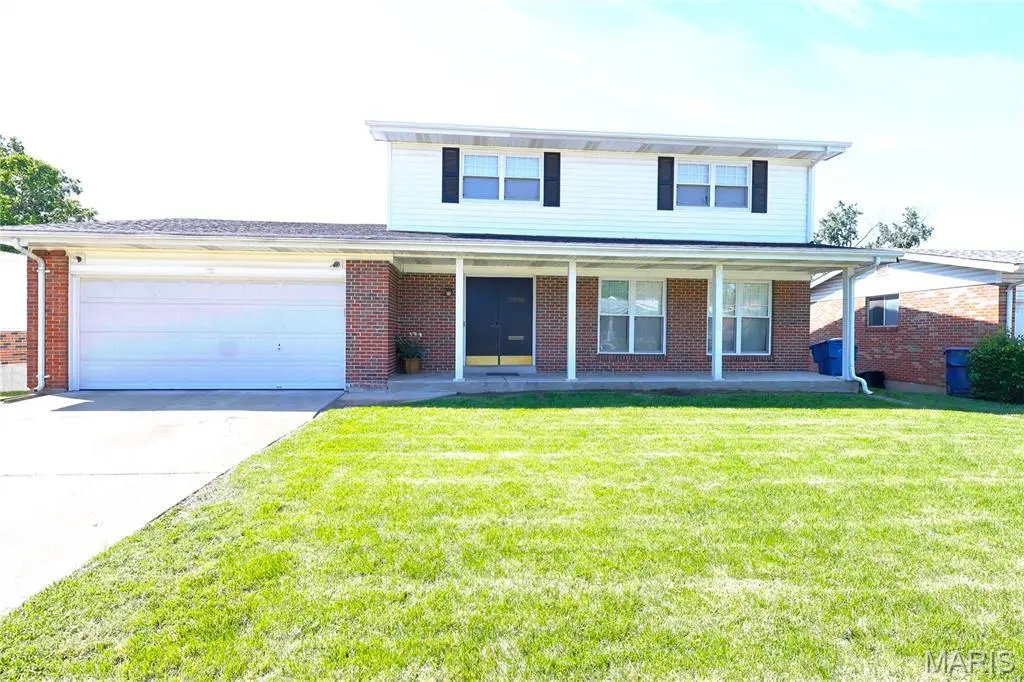
2660 Delaware Dr · Florissant, MO
Flood risk 1/10 · Minimal
- FEMA flood zone
- X (unshaded)
- Chance of flooding over 30 yrs
- 0.0%
- Est. flood insurance / yr
- $473 – $860
Fire risk 1/10 · Minimal
- Est. fire insurance / yr
- $1,054 – $1,958
Heat risk 5/10 · Moderate
- Hot days now (above 106°F)
- 7 days/yr
- Hot days in 30 yrs
- 21 days/yr
Wind risk 2/10 · Minimal
- Chance of severe wind over 30 yrs
- 1.0%
Air-quality risk 3/10 · Minor
- Unhealthy air days now
- 3 days/yr
- Unhealthy air days in 30 yrs
- 5 days/yr
Risk factors via First Street. Map © Google.
Why this score? — see what drove the C grade
The composite is a weighted blend of 9 inputs, each scored 0–100. Each bar is that input's sub-score; the figure is the points it added to the 100-point composite (weight × sub-score).
- Cash flow +16.2/30.0
- ARV discount +10.2/15.0
- Appreciation +10.0/10.0
- DSCR +5.0/10.0
- Rent growth +4.4/5.0
- 1% rule +4.1/10.0
- Livability +3.7/5.0
- Condition / age +2.5/5.0
- Schools +1.2/10.0
$214,900
🖨 Deal sheet 📄 Offer letter ✓ Due diligence
Listing remarks MLS
Location, location, location with a great price! This 2 story 4 bedroom, 3 bath nearly 2,000 sq ft home has been freshly painted and boast refinished hardwood floors from top to bottom. No smelly carpet here! Large eat in kitchen has plenty of counter space and cabinets. Brand new appliances, family room, dining room and living room make up the main floor along with a half bath. The upper level has 4 large size bedrooms and 2 full baths and yes the master has a full bathroom. These rooms are all large and have plenty of closet space. The walkout basement is unfinished and is ready for you to add the finishing touches. Conveniently close to everything from restaurants, grocery stores, banks, fitness centers and more. Schedule your personal tour now and you will not be disappointed. Plenty of room for entertaining and a growing family. Just minutes from 270, 70, Clayton, downtown and the Airport!
Key facts
- Detailed millwork
- Large eat-in kitchen
- Built-in bookcases
Tags
Property features AI
Exterior
- Parking: Attached 2-car garage; Off-street parking
- Security: Smoke detectors
- Utilities: Public water; Public sewer; Single-phase electric
- Home design: Single-family residence; Two levels; Residential property
- Construction: Brick veneer exterior; Full unfinished concrete basement with walk-out access
- Exterior features: Back yard; Cross fenced; Fenced; Level lot; Near public transit
Interior
- Kitchen: Gas cooktop; Gas oven; Gas range; Dishwasher; Microwave; Refrigerator; Pantry; Eat-in kitchen
- Bedrooms: Four bedrooms (all on the upper level)
- Flooring: Hardwood; Tile
- Bathrooms: Two full bathrooms; One half bathroom (main level)
- Heating & cooling: Forced air heating (natural gas); Central air conditioning (electric); Ceiling fans
- Interior features: Bookcases; Eat-in kitchen; Pantry; Special millwork
- Laundry & utility: Washer; Dryer; Laundry located in basement; Gas water heater
Neighborhood map
What this means for you Summary
Snapshot
- This is a 4-bed/2.5-bath single-family listed at $215k.
Deal economics
- At list price, monthly cash flow is $114 ($1k/yr) — positive.
- The deal already cash-flows at list — no discount required.
- To meet the 1% rule (rent ≥ 1% of price), the offer needs to be $195k (9.4% below list).
- Recommended offer: $195k (9.4% below list) — sets the bar for 1% rule.
Location & tenants
- Location reads 73/100 on livability (#82 in MO) — a middle-class / working-renter tenant base. Strengths: cost of living A+, housing A+, health & safety B+; Watch: crime C-, amenities D+, schools D.
- Ferguson-Florissant R-II (suburban): math 7% / reading 20% proficiency, ranked #311 of 324 in MO (top 96%) — low school quality limits family demand, transient renter base, plan for 1-2y turnover; 70% free/reduced lunch — lower-income household profile, screen leases tightly.
- Market conditions: Rents rising fast (+7.5%/yr); 218 active listings in the ZIP; 15 comparable units currently listed for rent nearby; rentals at typical pace (median 18d on market — plan ~3-4 weeks tenant-placement turnaround); 920 units permitted in St. Louis County in 2024 (250 in 5+ unit buildings).
- This rent runs 35% of the median local income ($67k/yr) — at the standard rent-burdened threshold; future hikes will face affordability resistance.
Forward outlook
- In year one you build about $23k of equity ($1k loan paydown + $21k appreciation (10.0% local appreciation)).
- At projected returns (10.0% appreciation + 7.5% rent growth), your $60k cash investment doubles in ~3 years — after that, you're playing with house money.
- By year 2, paydown + projected appreciation supports a ~$37k cash-out refi (75% LTV) — recoverable capital for the next deal without selling this one.
Negotiation context
- It's been on market 31 days — a 3% lower offer ($208k) is reasonable based on typical stale-listing flexibility.
- 3 sale attempts since 11y ago with the ask held roughly flat each time — persistent listings suggest the price (not the market) is what's stuck; bring a comps-based counter.
- Current owner paid $115k; list at $215k implies a 87% gain — meaningful room to come down on a strong offer.
Risks & watch-outs
- Climate carrying-cost: extreme-heat days projected 7→21/yr by 2055 (HVAC capex compounding) — expect insurance premiums to compound above CPI over the hold.
Questions for the listing agent
- It's been on market 31 days. Have you received any prior offers? Is the seller open to a 9% concession, seller financing, or rate buy-down credit?
- Built in 1967 — when were the roof, HVAC, electrical panel, plumbing, and water heater last replaced?
- Is there a deadline driving the sale (1031 exchange, divorce, estate, relocation)? That informs how much negotiation room exists.
- Schools are D-rated, which usually means shorter tenancies and higher turnover. Who's the typical renter profile here, and what's been the actual vacancy rate?
- What's the average days-on-market for RENTAL listings here right now (not sales)? A rising rental-DOM trend means longer vacancies and softer asking-rent achievability than the comps imply.
- What's the recent tenant-quality profile in this submarket — average credit score on applications, eviction rate, late-payment / NSF rate, and stable-employment percentage? A property-management company in the area should have these aggregated.
- How much new for-sale + rental construction is in the pipeline within 1–3 miles? Heavy new supply typically softens prices + rents 12–24 months out; constrained supply supports both.
Investment metrics
- 1% rule
- 0.91% ✗
- Cap rate
- 6.93%
- Cash-on-cash
- 2.27%
- DSCR
- 1.10
- GRM
- 9.2
CMA / ARV
- ARV (median comp)
- $228,738
- List price
- $214,900
- Delta
- -6.05%
- Verdict
- FAIR
- Comps
- 20 within 1.0 mi
Show comp detail 12 sales within ~0.75 mi
| Address | Dist | Beds/Ba | Sqft | Sold | Price | $/sf | Match |
|---|---|---|---|---|---|---|---|
| 2780 Narraganset Dr | 0.35mi | 4/2.0 | 2,102 (+6%) | 4mo | $260,000 | $124 | 69 |
| 1635 Canter Dr | 0.11mi | 3/2.0 (-1) | 2,240 (+13%) | 2mo | $239,900 | $107 | 66 |
| 2250 Montagne Dr | 0.63mi | 4/2.0 | 1,992 (+0%) | 5mo | $150,000 | $75 | 64 |
| 2590 Hackney Dr | 0.11mi | 3/2.0 (-1) | 1,699 (-14%) | 2mo | $175,000 | $103 | 62 |
| 2165 E Humes Ln | 0.68mi | 5/2.5 (+1) | 1,992 (+0%) | 2mo | $239,900 | $120 | 61 |
| 2060 Aqueduct Dr | 0.67mi | 3/2.0 (-1) | 2,001 (+1%) | 1mo | $260,000 | $130 | 60 |
| 2860 Sussex Dr | 0.70mi | 3/3.0 (-1) | 2,046 (+3%) | 2mo | $225,000 | $110 | 54 |
| 1475 Hollywood Ln | 0.70mi | 3/2.0 (-1) | 1,920 (-3%) | 2mo | $187,000 | $97 | 53 |
| 1480 Stallion Dr | 0.45mi | 4/2.0 | 1,737 (-13%) | 4mo | $239,900 | $138 | 53 |
| 2370 Martin Dr | 0.50mi | 3/2.0 (-1) | 1,793 (-10%) | 5mo | $225,000 | $125 | 50 |
| 1025 Belmont Ter | 0.70mi | 3/2.0 (-1) | 1,764 (-11%) | 4mo | $192,500 | $109 | 38 |
| 2230 Glenoro Dr | 0.63mi | 3/1.5 (-1) | 1,690 (-15%) | 4mo | $196,000 | $116 | 33 |
Match score weights: distance 35% · size 25% · config 20% · recency 20%. Top-matched comps best support the ARV.
Projected returns pro-forma
10.0% appreciation · 7.51% rent growth · sell at horizon
- IRR
- 27.5%
- Equity multiple
- 3.22×
- Total profit
- $133,536
- Equity at exit
- $193,599
- IRR
- 25.3%
- Equity multiple
- 7.81×
- Total profit
- $409,972
- Equity at exit
- $417,503
Cash invested: $60,172 (down + closing). Projections, not guarantees.
Landlord ↔ Tenant lean methodology
- Overall (STATE)
- 81 Strongly Landlord-Friendly
- State Missouri
- 81 Strongly Landlord-Friendly · R+10
- County
- — inherits STATE
- City
- — inherits STATE
ZIP-level market 63033
- Home prices YoY
- 2.5%
- Rents YoY
- 7.5%
- Active inventory
- 218
- Price-to-rent
- 9.2×
Monthly cashflow live
- Estimated rent
- $1,948 high interval (Pro) →
- Mortgage (P&I)
- −$1,127
- Tax from tax record
- −$208 /mo · $2,497/yr
- Insurance
- −$90
- HOA
- −$0
- Vacancy / Maint / Mgmt
- −$409
- Net cashflow
- $114
Break-even live
UW: 25.0% down · 7.5% · 30yr · 1.5% tax · 5.0% vac · 8.0% maint · 8.0% mgmt
Financing live
Cash to close
- Down payment
- $53,725
- Closing costs
- $6,447
- Reserves months
- —
- Total cash needed
- —
Loan-product check · same deal, 3 products live
Conventional
25% down · 7.5% · 30yr
- Down + closing
- —
- Monthly P&I
- —
- Monthly cashflow
- —
- DSCR
- —
- Eligible?
- —
Personal DTI + credit; lowest rate.
DSCR
20% down · 8.5% · 30yr
- Down + closing
- —
- Monthly P&I
- —
- Monthly cashflow
- —
- DSCR
- —
- Eligible?
- —
No personal income docs; deal must DSCR.
Hard money
10% down · 12.0% · 12mo
- Down + closing
- —
- Monthly P&I
- —
- Monthly cashflow
- —
- DSCR
- —
- Eligible?
- —
Short-term bridge; refi at stabilization.
Rent comps 15 comps
| Address | Beds | Baths | Sqft | Rent | $/sqft | DOM | Units | Dist |
|---|---|---|---|---|---|---|---|---|
| 1785 Trotter Way Florissant, MO | 3.0 | 2.0 | 1297 | $1,806 | $1.39 | 7d | 1 | 0.09mi |
| 1600 Horseshoe Dr Florissant, MO | 3.0 | 2.0 | 1314 | $1,550 | $1.18 | 43d | 1 | 0.17mi |
| 3 Cantabrian Ct Florissant, MO | 3.0 | 2.0 | 1436 | $1,881 | $1.31 | 14d | 1 | 0.57mi |
| 945 Paddock Dr Florissant, MO | 4.0 | 2.0 | 1875 | $1,850 | $0.99 | 4d | 1 | 0.74mi |
| 2075 Cordoba Dr Florissant, MO | 3.0 | 2.0 | 1523 | $1,850 | $1.21 | 14d | 1 | 0.86mi |
| 560 Jamaica Pl Florissant, MO | 3.0 | 2.0 | 1350 | $1,653 | $1.22 | 43d | 1 | 1.00mi |
| 1740 Deborah Dr Florissant, MO | 3.0 | 2.5 | 1650 | $1,750 | $1.06 | 17d | 1 | 1.06mi |
| 12 Country Ln Florissant, MO | 3.0 | 2.0 | 1881 | $2,250 | $1.20 | 43d | 1 | 1.15mi |
| 13 Cricket Ct Florissant, MO | 4.0 | 3.0 | 1560 | $2,550 | $1.63 | 43d | 1 | 1.16mi |
| 410 Ridge Dr Florissant, MO | 3.0 | 2.0 | 1226 | $1,650 | $1.35 | 17d | 1 | 1.17mi |
| 3930 Belcroft Dr Florissant, MO | 3.0 | 3.0 | 1408 | $1,935 | $1.37 | 43d | 1 | 1.22mi |
| 1280 Saint Catherine St Florissant, MO | 3.0 | 1.0 | 1274 | $1,600 | $1.26 | 14d | 1 | 1.31mi |
| 790 Pebble Ln Florissant, MO | 3.0 | 2.0 | 1242 | $1,795 | $1.45 | 23d | 1 | 1.41mi |
| 1545 Washington St Florissant, MO | 3.0 | 1.5 | 1337 | $2,055 | $1.54 | 3d | 1 | 1.41mi |
| 805 Robinwood Dr Florissant, MO | 3.0 | 1.5 | 1729 | $1,571 | $0.91 | 20d | 1 | 1.43mi |
Listing history 12 events
-
2026-06-02days on market $214,900 Active 31 DOM
-
2026-06-01days on market $214,900 Active 30 DOM
-
2026-05-31days on market $214,900 Active 29 DOM
-
2026-05-12price $214,900 781-char remark
-
2026-05-02$219,900 Active 781-char remark
-
2015-04-08soldstatus $115,000
-
2015-04-03soldstatus Closed 915-char remark
Show marketing remark (915 chars)
Location, location, location with a great price! This 2 story 4 bedroom, 3 bath nearly 2,000 sq ft home has been freshly painted and boast refinished hardwood floors from top to bottom. No smelly carpet here! Large eat in kitchen has plenty of counter space and cabinets. Brand new appliances, family room, dining room and living room make up the main floor along with a half bath. The upper level has 4 large size bedrooms and 2 full baths and yes the master has a full bathroom. These rooms are all large and have plenty of closet space. The walkout basement is unfinished and is ready for you to add the finishing touches. Conveniently close to everything from restaurants, grocery stores, banks, fitness centers and more. Schedule your personal tour now and you will not be disappointed. Plenty of room for entertaining and a growing family. Just minutes from 270, 70, Clayton, downtown and the Airport!
-
2015-03-10historical 915-char remark
Show marketing remark (915 chars)
Location, location, location with a great price! This 2 story 4 bedroom, 3 bath nearly 2,000 sq ft home has been freshly painted and boast refinished hardwood floors from top to bottom. No smelly carpet here! Large eat in kitchen has plenty of counter space and cabinets. Brand new appliances, family room, dining room and living room make up the main floor along with a half bath. The upper level has 4 large size bedrooms and 2 full baths and yes the master has a full bathroom. These rooms are all large and have plenty of closet space. The walkout basement is unfinished and is ready for you to add the finishing touches. Conveniently close to everything from restaurants, grocery stores, banks, fitness centers and more. Schedule your personal tour now and you will not be disappointed. Plenty of room for entertaining and a growing family. Just minutes from 270, 70, Clayton, downtown and the Airport!
-
2015-03-07status Active 915-char remark
Show marketing remark (915 chars)
Location, location, location with a great price! This 2 story 4 bedroom, 3 bath nearly 2,000 sq ft home has been freshly painted and boast refinished hardwood floors from top to bottom. No smelly carpet here! Large eat in kitchen has plenty of counter space and cabinets. Brand new appliances, family room, dining room and living room make up the main floor along with a half bath. The upper level has 4 large size bedrooms and 2 full baths and yes the master has a full bathroom. These rooms are all large and have plenty of closet space. The walkout basement is unfinished and is ready for you to add the finishing touches. Conveniently close to everything from restaurants, grocery stores, banks, fitness centers and more. Schedule your personal tour now and you will not be disappointed. Plenty of room for entertaining and a growing family. Just minutes from 270, 70, Clayton, downtown and the Airport!
-
2015-02-01Contingent (No Kickout) 915-char remark
Show marketing remark (915 chars)
Location, location, location with a great price! This 2 story 4 bedroom, 3 bath nearly 2,000 sq ft home has been freshly painted and boast refinished hardwood floors from top to bottom. No smelly carpet here! Large eat in kitchen has plenty of counter space and cabinets. Brand new appliances, family room, dining room and living room make up the main floor along with a half bath. The upper level has 4 large size bedrooms and 2 full baths and yes the master has a full bathroom. These rooms are all large and have plenty of closet space. The walkout basement is unfinished and is ready for you to add the finishing touches. Conveniently close to everything from restaurants, grocery stores, banks, fitness centers and more. Schedule your personal tour now and you will not be disappointed. Plenty of room for entertaining and a growing family. Just minutes from 270, 70, Clayton, downtown and the Airport!
-
2014-11-06soldstatus $57,000
-
1992-02-24soldstatus
ⓘ Source: listings_history table (triggers on properties + properties_extension) + one-shot
backfill from property_details.listing_events for pre-trigger history.
Tax reassessment forecast MO · Resets to sale price
- Current annual tax
- $2,497 · $208/mo
- Projected year-2 tax
- $2,497 · $208/mo
- Expected delta
- $0/yr ($0/mo · 0.0%)
ⓘ Screening estimate from a state-policy table — verify with the county assessor before closing.
Climate risk First Street
- Flood 1/10 Low FEMA zone X (unshaded) · 0% chance over 30 yrs
- Wildfire 1/10 Low
- Heat 5/10 Major 7 d/yr ≥106°F today · 21 d/yr by 30 yrs out
- Wind 2/10 Low 100% chance of damaging wind over 30 yrs
- Air quality 3/10 Moderate 3 unhealthy d/yr today · 5 by 30 yrs out
Nearby sold comps map
Loading sold comps map…
Walkable amenities ~0.75 mi
Loading nearby amenities…
Taxation est. · year 1
- Rental income
- $23,372
- − Mortgage interest
- −$12,038
- − Property taxes
- −$2,497
- − Insurance
- −$1,074
- − Repairs & maintenance
- −$1,870
- − Management
- −$1,870
- − Depreciation
- −$6,252
- Taxable loss
- −$2,229
- Est. tax savings @ 24.0%
- +$535
- After-tax cash flow
- $1,904/yr
For passive investors: Depreciation is non-cash, so a rental often shows a tax loss while cash-flowing — sheltering income. Rental losses are passive: they offset passive income freely, and up to $25,000/yr can offset ordinary (W-2) income if you actively participate and your MAGI is under $100k (phasing out to $0 by $150k); unused losses carry forward. On sale, claimed depreciation is recaptured at up to 25%, and gains may owe capital-gains tax (a 1031 exchange can defer both). Figures are a year-1 estimate at your 24.0% rate — not tax advice; consult a CPA.
Schools (NCES district)
- District
- Ferguson-Florissant R-II
- NCES district ID
- 2912010
- Math proficiency
- 7% ▼ -9.00%
- Reading proficiency
- 20% ▼ -6.00%
- Median HH income
- $44,610
- Composite
- 11.96/100
- National rank
- #9666
- State rank
- #311 of 324 in MO
Livability — Florissant
- Score
- 73/100
- State rank
- #82
- US rank
- #5406
Category grades
Schools grade is shown separately in the Schools card above.
Census & demographics
- Census place
- Florissant, MO
- County
- Saint Louis County · 888,823 people
- City population
- 69,104
- Metro
- St. Louis, MO-IL
- Population (ZIP)
- 43,056
- Household income
- $66,776
- Rent vs Own
- Severe rent burden
- 1429.0
Population outlook (St. Louis County) Hauer SSP2
- Today (2025)
- 1,025,227 people
- By 2030
- 1,028,023 · +0.3%
- By 2040
- 1,020,940 · -0.4%
- By 2050
- 1,007,280 · -1.8%
- By 2075
- 987,277 · -3.7%
- By 2100
- 921,984 · -10.1%
Race, ethnicity, and origin ACS 2023
- Neighborhood character
- Predominantly Black (71%)
- Race & ethnicity
- Black 71% White 23% Two or more races 4% Hispanic / Latino 1%
- Common ancestry
- Romanian 1% Lithuanian 1% Italian 1%
- Foreign-born
- 3% · Canada, Vietnam
- Languages at home
- 95% English-only · Spanish 1% French/Haitian/Cajun 1%
Political lean MEDSL · St. Louis
- 2024 margin
- Strong D (+23.4) · D 60.8% · R 37.4% · Other 1.7%
- 2008→2024 swing
- +3.5pp toward D · 2008: 19.9pp · 2024: 23.4pp
- All cycles
- 2024: D+23.4 2020: D+24.0 2016: D+16.2 2012: D+13.7 2008: D+19.9
Not yet ingested
- Civics
- —
Market trends
- HPI YoY
- ▲ 13.78%
- Current HPI
- 570.6
- Rent YoY
- ▲ 7.51%
- Metro
- St. Louis, MO-IL
- State GDP YoY
- ▲ 1.84%
- F500 in state
- 20
Industry mix (Fortune 500 HQ in MO)
| Industry | F500 HQs | Revenue |
|---|---|---|
| Healthcare | 1 | $163B |
|
||
| Insurance | 1 | $21B |
|
||
| Industrial Technology | 1 | $17B |
|
||
| Retail | 1 | $16B |
|
||
| Industrial Distribution | 1 | $10B |
|
||
| Utilities | 1 | $9B |
|
||
Price history
+277.0% since first listed9 events — show timeline
- 2026-05-12 Price Changed $214,900 MARIS as Distributed by MLS Grid
- 2026-05-02 Listed $219,900 MARIS as Distributed by MLS Grid
- 2015-04-08 Sold (Public Records) $115,000 Public Records
- 2015-04-03 Sold (MLS) — MARIS as Distributed by MLS Grid
- 2015-03-10 Delisted — MARIS as Distributed by MLS Grid
- 2015-03-07 Relisted — MARIS as Distributed by MLS Grid
- 2015-02-01 Listed — MARIS as Distributed by MLS Grid
- 2014-11-06 Sold (Public Records) $57,000 Public Records
- 1992-02-24 Sold (Public Records) — Public Records
Property tax history
+2.7%/yrLatest (2022): $2,497 · +1.7% YoY. Source: county tax records.
Cash-flow waterfall
monthlySold comps — $/sqft
last 12 mo · ≤1 miLoading sold comps…