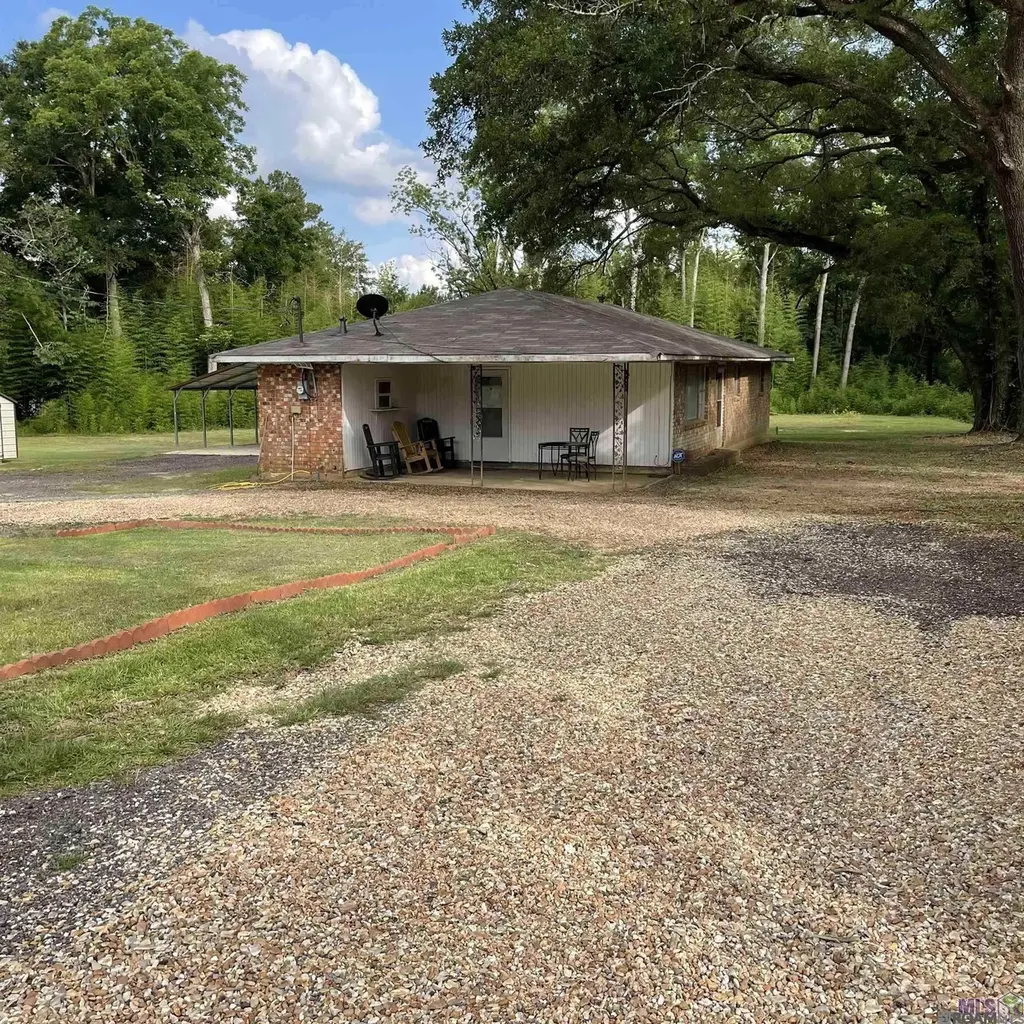
2232 Hatfield Ln · Jackson, LA
Flood risk 1/10 · Minimal
- FEMA flood zone
- X (unshaded)
- Chance of flooding over 30 yrs
- 0.0%
- Est. flood insurance / yr
- $507 – $1,088
Fire risk 3/10 · Minor
- Est. fire insurance / yr
- $1,269 – $2,357
Heat risk 7/10 · Major
- Hot days now (above 108°F)
- 7 days/yr
- Hot days in 30 yrs
- 18 days/yr
Wind risk 8/10 · Major
- Chance of severe wind over 30 yrs
- 99.0%
Air-quality risk 2/10 · Minimal
- Unhealthy air days now
- 1 days/yr
- Unhealthy air days in 30 yrs
- 2 days/yr
Risk factors via First Street. Map © Google.
Why this score? — see what drove the D grade
The composite is a weighted blend of 9 inputs, each scored 0–100. Each bar is that input's sub-score; the figure is the points it added to the 100-point composite (weight × sub-score).
- Cash flow +14.9/30.0
- ARV discount +8.5/15.0
- DSCR +4.5/10.0
- 1% rule +3.1/10.0
- Livability +3.1/5.0
- Rent growth +2.5/5.0
- Condition / age +2.5/5.0
- Schools +2.0/10.0
- Appreciation +0.0/10.0
$140,000
🖨 Deal sheet (PDF) 📄 Offer letter ✓ Due diligence
Listing remarks MLS
WELCOME TO THIS CHARMING 3 BEDROOM, 1 BATH HOME NESTLED ON 2.40 PEACEFUL ACRES. DON'T MISS THIS GREAT OPPORTUNITY! WHETHER YOU'RE LOOKING FOR A STARTER HOME, INVESTMENT, OR SPACE TO BUILD YOU FUTURE. OUTSIDE THE EXPANSIVE LAND GIVES YOU ROOM TO CREATE THE LIFESTYLE YOU WANT: ADD A WORKSHOP, PLANT A GARDEN, RAISE ANIMALS, OR SIMPLY ENJOY THE OPEN SPACE. SCHEDULE YOUR SHOWING TODAY!
Key facts
- Open space
- Expansive land
- 2.4 acre lot
Tags
Neighborhood map
What this means for you Summary
Snapshot
- This is a 3-bed/1.0-bath single-family listed at $140k.
Deal economics
- At list price, monthly cash flow is $40 ($484/yr) — positive.
- The deal already cash-flows at list — no discount required.
- To meet the 1% rule (rent ≥ 1% of price), the offer needs to be $114k (18.5% below list).
- Recommended offer: $114k (18.5% below list) — sets the bar for 1% rule.
- Cap rate 6.6% vs local median 1.9% in Jackson — top-decile yield for the area; either an underpriced asset or a hidden risk that comps aren't pricing in. Stress-test before assuming the spread holds.
Location & tenants
- Location reads 61/100 on livability (#239 in LA) — a middle-class / working-renter tenant base. Strengths: cost of living A+, housing A+; Watch: crime F, amenities F, commute F.
- East Feliciana Parish (rural): math 19% / reading 28% proficiency, ranked #62 of 98 in LA (top 63%) — low school quality limits family demand, transient renter base, plan for 1-2y turnover; 75% free/reduced lunch — lower-income household profile, screen leases tightly.
- Zoned schools: East Feliciana Middle School (math 2% / reading 12%, grade F, #209 of 218 statewide, top 97%, 120 students, 79% FRL) — zoned schools at 79% FRL track the district average.
- Zoned-school proficiency averages 7% at this address vs 24% district-wide (-16 pts) — the specific schools serving this property underperform the East Feliciana Parish average; the district grade overstates school quality for this exact location.
- Market conditions: 65 active listings in the ZIP; 42 units permitted in East Feliciana Parish in 2024 (0 in 5+ unit buildings).
Forward outlook
- Local home prices are declining (-3.0%/yr); year-one equity from $968 of loan paydown is wiped out by about $4k of value loss. Plan a longer hold.
- East Feliciana County population projected at -18% by 2050 — secular population decline; favor cash flow + early exit over multi-decade hold.
Negotiation context
- It's been on market 194 days — a 12% lower offer ($123k) is reasonable based on typical stale-listing flexibility.
- 5 sale attempts since 4y ago with the ask held roughly flat each time — persistent listings suggest the price (not the market) is what's stuck; bring a comps-based counter.
Risks & watch-outs
- Climate carrying-cost: severe wind risk, 99% chance of damaging wind over 30y; extreme-heat days projected 7→18/yr by 2055 (HVAC capex compounding) — expect insurance premiums to compound above CPI over the hold.
Questions for the listing agent
- It's been on market 194 days. Have you received any prior offers? Is the seller open to a 19% concession, seller financing, or rate buy-down credit?
- Built in 1974 — when were the roof, HVAC, electrical panel, plumbing, and water heater last replaced?
- Why hasn't it sold? Are there any deal-killer items the seller is aware of (foundation, flood, title, zoning, code violations)?
- Is there a deadline driving the sale (1031 exchange, divorce, estate, relocation)? That informs how much negotiation room exists.
- Schools are D-rated, which usually means shorter tenancies and higher turnover. Who's the typical renter profile here, and what's been the actual vacancy rate?
- Crime grade is F in this area — have there been break-ins, vandalism, or insurance claims at this property in the last 3 years? What carrier currently insures it and at what premium?
- The area grade is low — what's the realistic commute time and amenity access for the typical tenant pool here? Any planned neighborhood developments (good or bad) we should know about?
- What's the average days-on-market for RENTAL listings here right now (not sales)? A rising rental-DOM trend means longer vacancies and softer asking-rent achievability than the comps imply.
- What's the recent tenant-quality profile in this submarket — average credit score on applications, eviction rate, late-payment / NSF rate, and stable-employment percentage? A property-management company in the area should have these aggregated.
- How much new for-sale + rental construction is in the pipeline within 1–3 miles? Heavy new supply typically softens prices + rents 12–24 months out; constrained supply supports both.
Investment metrics
- 1% rule
- 0.81% ✗
- Cap rate
- 6.64%
- Cash-on-cash
- 1.23%
- DSCR
- 1.05
- GRM
- 10.2
CMA / ARV
- ARV (median comp)
- $143,142
- List price
- $140,000
- Delta
- -2.20%
- Verdict
- FAIR
- Comps
- 6 within 2.0 mi
Projected returns pro-forma
-3.0% appreciation · 3.0% rent growth · sell at horizon
- IRR
- -14.4%
- Equity multiple
- 0.49×
- Total profit
- $-20,166
- Equity at exit
- $20,874
- IRR
- -5.7%
- Equity multiple
- 0.63×
- Total profit
- $-14,450
- Equity at exit
- $12,105
Cash invested: $39,200 (down + closing). Projections, not guarantees.
Landlord ↔ Tenant lean methodology
- Overall (STATE)
- 90 Strongly Landlord-Friendly
- State Louisiana
- 90 Strongly Landlord-Friendly · R+12
- County
- — inherits STATE
- City
- — inherits STATE
ZIP-level market 70748
- Home prices YoY
- -26.2%
- Active inventory
- 65
- Price-to-rent
- 10.2×
Monthly cashflow live
- Estimated rent
- $1,141 medium interval (Pro) →
- Mortgage (P&I)
- −$734
- Tax from tax record
- −$68 /mo · $818/yr
- Insurance
- −$58
- HOA
- −$0
- Vacancy / Maint / Mgmt
- −$240
- Net cashflow
- $40
Break-even live
Sensitivity live
| Price | -10% $120 | -5% $80 | +0% $40 | +5% $1 | +10% $-39 |
|---|---|---|---|---|---|
| Rent | -10% $-50 | -5% $-5 | +0% $40 | +5% $85 | +10% $130 |
| Rate | -1.0pp $111 | -0.5pp $76 | base $40 | +0.5pp $4 | +1.0pp $-33 |
UW: 25.0% down · 7.5% · 30yr · 1.5% tax · 5.0% vac · 8.0% maint · 8.0% mgmt
Financing live
Cash to close
- Down payment
- $35,000
- Closing costs
- $4,200
- Reserves months
- —
- Total cash needed
- —
Loan-product check · same deal, 3 products live
Conventional
25% down · 7.5% · 30yr
- Down + closing
- —
- Monthly P&I
- —
- Monthly cashflow
- —
- DSCR
- —
- Eligible?
- —
Personal DTI + credit; lowest rate.
DSCR
20% down · 8.5% · 30yr
- Down + closing
- —
- Monthly P&I
- —
- Monthly cashflow
- —
- DSCR
- —
- Eligible?
- —
No personal income docs; deal must DSCR.
Hard money
10% down · 12.0% · 12mo
- Down + closing
- —
- Monthly P&I
- —
- Monthly cashflow
- —
- DSCR
- —
- Eligible?
- —
Short-term bridge; refi at stabilization.
Listing history 28 events
-
2026-06-22days on market $140,000 Active 194 DOM
-
2026-06-18days on market $140,000 Active 191 DOM
-
2026-06-17days on market $140,000 Active 190 DOM
-
2026-06-16days on market $140,000 Active 189 DOM
-
2026-06-15days on market $140,000 Active 188 DOM
-
2026-06-14days on market $140,000 Active 186 DOM
-
2026-06-10days on market $140,000 Active 183 DOM
-
2026-06-09days on market $140,000 Active 182 DOM
-
2026-06-08days on market $140,000 Active 181 DOM
-
2026-06-07days on market $140,000 Active 180 DOM
-
2026-06-05days on market $140,000 Active 177 DOM
-
2026-06-03days on market $140,000 Active 176 DOM
-
2026-06-02days on market $140,000 Active 175 DOM
-
2026-06-01days on market $140,000 Active 174 DOM
-
2026-05-31days on market $140,000 Active 173 DOM
-
2026-05-31days on market $140,000 Active 172 DOM
-
2026-04-25price $140,000 383-char remark
Show marketing remark (383 chars)
WELCOME TO THIS CHARMING 3 BEDROOM, 1 BATH HOME NESTLED ON 2.40 PEACEFUL ACRES. DON'T MISS THIS GREAT OPPORTUNITY! WHETHER YOU'RE LOOKING FOR A STARTER HOME, INVESTMENT, OR SPACE TO BUILD YOU FUTURE. OUTSIDE THE EXPANSIVE LAND GIVES YOU ROOM TO CREATE THE LIFESTYLE YOU WANT: ADD A WORKSHOP, PLANT A GARDEN, RAISE ANIMALS, OR SIMPLY ENJOY THE OPEN SPACE. SCHEDULE YOUR SHOWING TODAY!
-
2025-12-02$150,000 Active 383-char remark
Show marketing remark (383 chars)
WELCOME TO THIS CHARMING 3 BEDROOM, 1 BATH HOME NESTLED ON 2.40 PEACEFUL ACRES. DON'T MISS THIS GREAT OPPORTUNITY! WHETHER YOU'RE LOOKING FOR A STARTER HOME, INVESTMENT, OR SPACE TO BUILD YOU FUTURE. OUTSIDE THE EXPANSIVE LAND GIVES YOU ROOM TO CREATE THE LIFESTYLE YOU WANT: ADD A WORKSHOP, PLANT A GARDEN, RAISE ANIMALS, OR SIMPLY ENJOY THE OPEN SPACE. SCHEDULE YOUR SHOWING TODAY!
-
2025-12-02$140,000 Active 383-char remark
Show marketing remark (383 chars)
WELCOME TO THIS CHARMING 3 BEDROOM, 1 BATH HOME NESTLED ON 2.40 PEACEFUL ACRES. DON'T MISS THIS GREAT OPPORTUNITY! WHETHER YOU'RE LOOKING FOR A STARTER HOME, INVESTMENT, OR SPACE TO BUILD YOU FUTURE. OUTSIDE THE EXPANSIVE LAND GIVES YOU ROOM TO CREATE THE LIFESTYLE YOU WANT: ADD A WORKSHOP, PLANT A GARDEN, RAISE ANIMALS, OR SIMPLY ENJOY THE OPEN SPACE. SCHEDULE YOUR SHOWING TODAY!
-
2022-12-02historical
-
2022-10-29price $110,000
-
2022-10-28status Active
-
2022-09-03historical
-
2022-07-20price $108,000
-
2022-06-29price $110,000
-
2022-06-24price $125,000
-
2022-06-09$135,000 Active
-
2022-06-09$110,000
ⓘ Source: listings_history table (triggers on properties + properties_extension) + one-shot
backfill from property_details.listing_events for pre-trigger history.
Tax reassessment forecast LA · Resets to sale price
- Current annual tax
- $818 · $68/mo
- Projected year-2 tax
- $818 · $68/mo
- Expected delta
- $0/yr ($0/mo · 0.0%)
ⓘ Screening estimate from a state-policy table — verify with the county assessor before closing.
Climate risk First Street
- Flood 1/10 Low FEMA zone X (unshaded) · 0% chance over 30 yrs
- Wildfire 3/10 Moderate
- Heat 7/10 Severe 7 d/yr ≥108°F today · 18 d/yr by 30 yrs out
- Wind 8/10 Severe 99% chance of damaging wind over 30 yrs
- Air quality 2/10 Low 1 unhealthy d/yr today · 2 by 30 yrs out
Nearby sold comps map
Loading sold comps map…
Walkable amenities ~0.75 mi
Loading nearby amenities…
Taxation est. · year 1
- Rental income
- $13,687
- − Mortgage interest
- −$7,842
- − Property taxes
- −$818
- − Insurance
- −$700
- − Repairs & maintenance
- −$1,095
- − Management
- −$1,095
- − Depreciation
- −$4,073
- Taxable loss
- −$1,937
- Est. tax savings @ 24.0%
- +$465
- After-tax cash flow
- $949/yr
For passive investors: Depreciation is non-cash, so a rental often shows a tax loss while cash-flowing — sheltering income. Rental losses are passive: they offset passive income freely, and up to $25,000/yr can offset ordinary (W-2) income if you actively participate and your MAGI is under $100k (phasing out to $0 by $150k); unused losses carry forward. On sale, claimed depreciation is recaptured at up to 25%, and gains may owe capital-gains tax (a 1031 exchange can defer both). Figures are a year-1 estimate at your 24.0% rate — not tax advice; consult a CPA.
Schools (NCES district)
- District
- East Feliciana Parish
- NCES district ID
- 2200600
- Math proficiency
- 19% ▼ -36.00%
- Reading proficiency
- 28% ▼ -37.00%
- Median HH income
- $43,478
- Composite
- 20.16/100
- National rank
- #8636
- State rank
- #62 of 98 in LA
Livability — Jackson
- Score
- 61/100
- State rank
- #239
- US rank
- #18179
Category grades
Schools grade is shown separately in the Schools card above.
Census & demographics
- City population
- 7,016
- Population (ZIP)
- 7,016
Population outlook (East Feliciana County) Hauer SSP2
- Today (2025)
- 18,858 people
- By 2030
- 18,225 · -3.4%
- By 2040
- 16,760 · -11.1%
- By 2050
- 15,456 · -18.0%
- By 2075
- 13,112 · -30.5%
- By 2100
- 11,117 · -41.0%
Race, ethnicity, and origin ACS 2023
- Neighborhood character
- Diverse neighborhood (Simpson 0.61)
- Race & ethnicity
- Black 47% White 41% Two or more races 9% Hispanic / Latino 5% Native American 1%
- Common ancestry
- Lithuanian 7% Italian 4% Slovak 1%
- Foreign-born
- 1% · Canada
- Languages at home
- 97% English-only · Spanish 1% French/Haitian/Cajun 1%
Political lean MEDSL · East Feliciana
- 2024 margin
- Strong R (+22.2) · D 38.3% · R 60.5% · Other 1.2%
- 2008→2024 swing
- -11.7pp toward R · 2008: -10.6pp · 2024: -22.2pp
- All cycles
- 2024: R+22.2 2020: R+17.0 2016: R+13.3 2012: R+7.3 2008: R+10.6
Not yet ingested
- Civics
- —
Market trends
- HPI YoY
- ▼ -48.49%
- Current HPI
- 136.6804
- Rent YoY
- —
- Metro
- —
- State GDP YoY
- ▲ 3.29%
- F500 in state
- 10
Industry mix (Fortune 500 HQ in LA)
| Industry | F500 HQs | Revenue |
|---|---|---|
| Telecommunications | 2 | $23B |
|
||
| Utilities | 1 | $12B |
|
||
| Wholesale / Distribution | 1 | $5B |
|
||
| Advertising | 1 | $2B |
|
||
Price history
+3.7% since first listed12 events — show timeline
- 2026-04-25 Price Changed $140,000 GBRMLS
- 2025-12-02 Listed $140,000 AcadianaMLS
- 2025-12-02 Listed $150,000 GBRMLS
- 2022-12-02 Delisted — GBRMLS
- 2022-10-29 Price Changed $110,000 GBRMLS
- 2022-10-28 Relisted — GBRMLS
- 2022-09-03 Delisted — GBRMLS
- 2022-07-20 Price Changed $108,000 GBRMLS
- 2022-06-29 Price Changed $110,000 GBRMLS
- 2022-06-24 Price Changed $125,000 GBRMLS
- 2022-06-09 Listed $110,000 AcadianaMLS
- 2022-06-09 Listed $135,000 GBRMLS
Property tax history
+4.4%/yrLatest (2025): $818 · +0.0% YoY. Source: county tax records.
Cash-flow waterfall
monthlySold comps — $/sqft
last 12 mo · ≤1 miLoading sold comps…