 Duplex
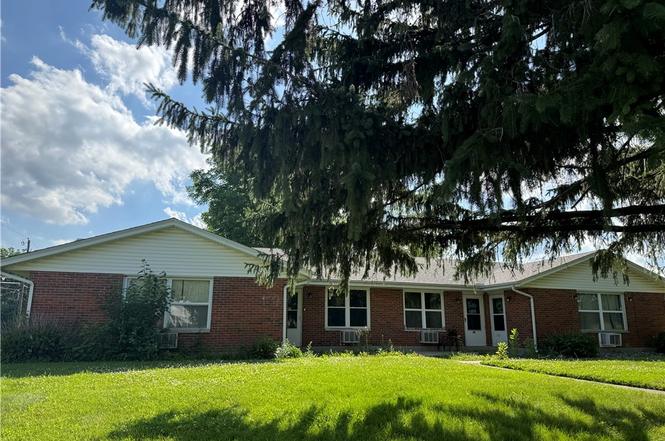
247 Moran · Xenia, OH
Flood risk 1/10 · Minimal
- FEMA flood zone
- X (unshaded)
- Chance of flooding over 30 yrs
- 0.0%
- Est. flood insurance / yr
- $507 – $1,088
Fire risk 1/10 · Minimal
- Est. fire insurance / yr
- $713 – $1,323
Heat risk 3/10 · Minor
- Hot days now (above 101°F)
- 7 days/yr
- Hot days in 30 yrs
- 18 days/yr
Wind risk 2/10 · Minimal
- Chance of severe wind over 30 yrs
- 1.0%
Air-quality risk 3/10 · Minor
- Unhealthy air days now
- 3 days/yr
- Unhealthy air days in 30 yrs
- 3 days/yr
Risk factors via First Street. Map © Google.
Why this score? — see what drove the C- grade
The composite is a weighted blend of 9 inputs, each scored 0–100. Each bar is that input's sub-score; the figure is the points it added to the 100-point composite (weight × sub-score).
- Cash flow +20.4/30.0
- ARV discount +7.5/15.0
- DSCR +6.5/10.0
- 1% rule +4.5/10.0
- Schools +4.0/10.0
- Rent growth +3.9/5.0
- Livability +3.8/5.0
- Condition / age +2.5/5.0
- Appreciation +0.0/10.0
$310,000
🖨 Deal sheet 📄 Offer letter ✓ Due diligence
Multi-family units
County records classify this as Multi-Family (5+ Unit). Listing-text estimate: 2 units. estimate disagrees with records
5+ unit building — per-unit beds/baths from public records are typically unavailable; the breakdown below (if shown) is an estimate from the listing text.
Listing remarks
Great investment property!! 4 units-2 bedroom and 2 1 bedroom. Updates include newer roof 2023 and newer septic. and updated kitchens
Key facts
- Newer roof
- Newer septic
- Parking
Tags
Property features AI
Finance
- Financial info: Offered for sale
Exterior
- Parking: Carport
- Utilities: Natural gas available; Window cooling units (electric)
- Home design: One-story building; Slab foundation; Brick construction
- Construction: Brick exterior
- Exterior features: Commercially zoned property
Interior
- Bedrooms: Units include four or more bedrooms
- Bathrooms: Each unit has full bathrooms (4 full bathrooms listed)
- Heating & cooling: Natural gas heating; Window air conditioning units
- Interior features: Single-story layout; Four separate residential units in one building
Neighborhood map
What this means for you Summary
Snapshot
- This is a 2 × 3-bed/2.0-bath units multifamily listed at $310k.
Deal economics
- At list price, monthly cash flow is $405 ($5k/yr) — positive. Per door: $203/mo.
- The deal already cash-flows at list — no discount required.
- To meet the 1% rule (rent ≥ 1% of price), the offer needs to be $296k (4.6% below list).
- Recommended offer: $296k (4.6% below list) — sets the bar for 1% rule.
- Cap rate 7.9% vs local median 3.6% in Xenia — top-decile yield for the area; either an underpriced asset or a hidden risk that comps aren't pricing in. Stress-test before assuming the spread holds.
Location & tenants
- Location reads 75/100 on livability (#244 in OH, #3,892 nationally) — a middle-class / working-renter tenant base. Strengths: cost of living A+, housing A+, health & safety B+; Watch: amenities D+, commute F, employment F.
- Xenia Community City (suburban): math 42% / reading 53% proficiency, ranked #478 of 656 in OH (top 73%) — families likely to look elsewhere, expect single-tenant / working-renter base with shorter leases.
- Market conditions: Rents rising fast (+5.5%/yr); 234 active listings in the ZIP; solid renter incomes; 797 units permitted in Greene County in 2024 (148 in 5+ unit buildings).
- At $2,957/mo this rent would consume 46% of the median local household income ($77k/yr) (locally 906% of renters already pay >50% of income on rent) — very limited rent-growth headroom before tenants either downsize or default.
Forward outlook
- Local home prices are declining (-3.0%/yr); year-one equity from $2k of loan paydown is wiped out by about $9k of value loss. Plan a longer hold.
Negotiation context
- Only 5 days on market — expect competitive offers; lowballing is unlikely to land.
Questions for the listing agent
- Can we see the unit-by-unit rent roll, current vacancy, and any below-market leases? What's the average tenancy length?
- What capital expenditures (roof, boiler, parking lot, exteriors) have been made in the last 5 years, and what's planned in the next 2?
- Built in 1964 — when were the roof, HVAC, electrical panel, plumbing, and water heater last replaced?
- Is there a deadline driving the sale (1031 exchange, divorce, estate, relocation)? That informs how much negotiation room exists.
- What's the average days-on-market for RENTAL listings here right now (not sales)? A rising rental-DOM trend means longer vacancies and softer asking-rent achievability than the comps imply.
- What's the recent tenant-quality profile in this submarket — average credit score on applications, eviction rate, late-payment / NSF rate, and stable-employment percentage? A property-management company in the area should have these aggregated.
- How much new apartment / multifamily construction is in the pipeline within 1–3 miles? Heavy new supply (>2% of stock underway) typically softens rents 12–24 months out; light construction supports rent growth.
Investment metrics
- 1% rule
- 0.95% ✗
- Cap rate
- 7.86%
- Cash-on-cash
- 5.60%
- DSCR
- 1.25
- GRM
- 8.7
CMA / ARV
No comps found within radius.
Projected returns pro-forma
-3.0% appreciation · 5.48% rent growth · sell at horizon
- IRR
- -5.1%
- Equity multiple
- 0.80×
- Total profit
- $-16,960
- Equity at exit
- $46,222
- IRR
- 7.0%
- Equity multiple
- 1.58×
- Total profit
- $50,749
- Equity at exit
- $26,803
Cash invested: $86,800 (down + closing). Projections, not guarantees.
Landlord ↔ Tenant lean methodology
- Overall (STATE)
- 73 Landlord-Friendly
- State Ohio
- 73 Landlord-Friendly · R+6
- County
- — inherits STATE
- City
- — inherits STATE
ZIP-level market 45385
- Rents YoY
- 5.5%
- Active inventory
- 234
- Price-to-rent
- 17.5×
Monthly cashflow live
- Estimated rent
- $2,957 high interval (Pro) →
- Mortgage (P&I)
- −$1,626
- Tax from tax record
- −$176 /mo · $2,114/yr
- Insurance
- −$129
- HOA
- −$0
- Vacancy / Maint / Mgmt
- −$621
- Net cashflow
- $405
Break-even live
2-unit breakdown (identical units grouped — click to expand)
| Units | Beds | Baths | Est. rent |
|---|---|---|---|
| 2× units | 3 | 2 | $2,956 |
| #1 | 3 | 2 | $1,478 |
| #2 | 3 | 2 | $1,478 |
| Total (2 units) | $2,957 | ||
UW: 25.0% down · 7.5% · 30yr · 1.5% tax · 5.0% vac · 8.0% maint · 8.0% mgmt
Financing live
Cash to close
- Down payment
- $77,500
- Closing costs
- $9,300
- Reserves months
- —
- Total cash needed
- —
Loan-product check · same deal, 3 products live
Conventional
25% down · 7.5% · 30yr
- Down + closing
- —
- Monthly P&I
- —
- Monthly cashflow
- —
- DSCR
- —
- Eligible?
- —
Personal DTI + credit; lowest rate.
DSCR
20% down · 8.5% · 30yr
- Down + closing
- —
- Monthly P&I
- —
- Monthly cashflow
- —
- DSCR
- —
- Eligible?
- —
No personal income docs; deal must DSCR.
Hard money
10% down · 12.0% · 12mo
- Down + closing
- —
- Monthly P&I
- —
- Monthly cashflow
- —
- DSCR
- —
- Eligible?
- —
Short-term bridge; refi at stabilization.
Listing history 5 events
-
2026-06-16statusdays on market $310,000 Pending 5 DOM
-
2026-06-15days on market $310,000 Active 4 DOM
-
2026-06-14days on market $310,000 Active 2 DOM
-
2026-06-13remarks 134-char remark
-
2026-06-13$310,000 Active 1 DOM
ⓘ Source: listings_history table (triggers on properties + properties_extension) + one-shot
backfill from property_details.listing_events for pre-trigger history.
Tax reassessment forecast OH · Partial reset (capped growth)
- Current annual tax
- $2,114 · $176/mo
- Projected year-2 tax
- $3,475 · $290/mo
- Expected delta
- +$1,361/yr (+$113/mo · 64.4%)
ⓘ Screening estimate from a state-policy table — verify with the county assessor before closing.
Climate risk First Street
- Flood 1/10 Low FEMA zone X (unshaded) · 0% chance over 30 yrs
- Wildfire 1/10 Low
- Heat 3/10 Moderate 7 d/yr ≥101°F today · 18 d/yr by 30 yrs out
- Wind 2/10 Low 100% chance of damaging wind over 30 yrs
- Air quality 3/10 Moderate 3 unhealthy d/yr today · 3 by 30 yrs out
Nearby sold comps map
Loading sold comps map…
Walkable amenities ~0.75 mi
Loading nearby amenities…
Taxation est. · year 1
- Rental income
- $35,484
- − Mortgage interest
- −$17,365
- − Property taxes
- −$2,114
- − Insurance
- −$1,550
- − Repairs & maintenance
- −$2,839
- − Management
- −$2,839
- − Depreciation
- −$9,018
- Taxable loss
- −$240
- Est. tax savings @ 24.0%
- +$58
- After-tax cash flow
- $4,918/yr
For passive investors: Depreciation is non-cash, so a rental often shows a tax loss while cash-flowing — sheltering income. Rental losses are passive: they offset passive income freely, and up to $25,000/yr can offset ordinary (W-2) income if you actively participate and your MAGI is under $100k (phasing out to $0 by $150k); unused losses carry forward. On sale, claimed depreciation is recaptured at up to 25%, and gains may owe capital-gains tax (a 1031 exchange can defer both). Figures are a year-1 estimate at your 24.0% rate — not tax advice; consult a CPA.
Schools (NCES district)
- District
- Xenia Community City
- NCES district ID
- 3904515
- Math proficiency
- 42% ▼ -16.00%
- Reading proficiency
- 53% ▼ -5.00%
- Median HH income
- $46,206
- Composite
- 40.31/100
- National rank
- #3752
- State rank
- #478 of 656 in OH
Livability — Xenia
- Score
- 75/100
- State rank
- #244
- US rank
- #3892
Category grades
Schools grade is shown separately in the Schools card above.
Census & demographics
- Census place
- Xenia, OH
- County
- Greene County · 132,120 people
- City population
- 40,617
- Metro
- Dayton-Kettering, OH
- Population (ZIP)
- 40,617
- Household income
- $76,564
- Rent vs Own
- Severe rent burden
- 906.0
Population outlook (Greene County) Hauer SSP2
- Today (2025)
- 170,301 people
- By 2030
- 171,840 · +0.9%
- By 2040
- 171,408 · +0.7%
- By 2050
- 167,806 · -1.5%
- By 2075
- 154,430 · -9.3%
- By 2100
- 138,669 · -18.6%
Race, ethnicity, and origin ACS 2023
- Neighborhood character
- Predominantly White (83%)
- Race & ethnicity
- White 83% Two or more races 6% Black 6% Hispanic / Latino 2% Asian 2%
- Common ancestry
- Slovak 3% Italian 2% Serbian 1%
- Foreign-born
- 3% · Canada
- Languages at home
- 96% English-only · Other Indo-European 1% Spanish 1%
Political lean MEDSL · Greene
- 2024 margin
- R (+19.8) · D 39.5% · R 59.3% · Other 1.2%
- 2008→2024 swing
- -1.4pp toward R · 2008: -18.4pp · 2024: -19.8pp
- All cycles
- 2024: R+19.8 2020: R+19.5 2016: R+24.5 2012: R+21.8 2008: R+18.4
Not yet ingested
- Civics
- —
Market trends
- HPI YoY
- ▼ -158.15%
- Current HPI
- 239.0473
- Rent YoY
- ▲ 5.48%
- Metro
- Dayton-Kettering, OH
- State GDP YoY
- ▲ 1.98%
- F500 in state
- 48
Industry mix (Fortune 500 HQ in OH)
| Industry | F500 HQs | Revenue |
|---|---|---|
| Insurance | 3 | $145B |
|
||
| Industrial Machinery | 3 | $49B |
|
||
| Financial Services | 3 | $24B |
|
||
| Consumer Goods | 2 | $93B |
|
||
| Aerospace / Defense | 2 | $47B |
|
||
| Utilities | 2 | $33B |
|
||
Price history
1 event — show timeline
- 2026-06-11 Listed $310,000 Dayton MLS
Property tax history
+0.5%/yrLatest (2025): $2,114 · +1.8% YoY. Source: county tax records.
Cash-flow waterfall
monthlySold comps — $/sqft
last 12 mo · ≤1 miLoading sold comps…