 Triplex
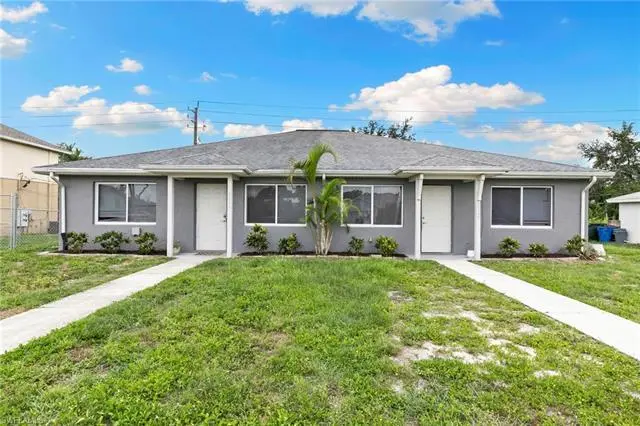
8264-8268 Matanzas Rd · San Carlos Park, FL
Flood risk 3/10 · Minor
- FEMA flood zone
- AE
- Chance of flooding over 30 yrs
- 0.12%
- Est. flood insurance / yr
- $1,737 – $8,500
Fire risk 1/10 · Minimal
- Est. fire insurance / yr
- $947 – $1,759
Heat risk 10/10 · Severe
- Hot days now (above 107°F)
- 7 days/yr
- Hot days in 30 yrs
- 30 days/yr
Wind risk 10/10 · Severe
- Chance of severe wind over 30 yrs
- 99.0%
Air-quality risk 2/10 · Minimal
- Unhealthy air days now
- 1 days/yr
- Unhealthy air days in 30 yrs
- 1 days/yr
Risk factors via First Street. Map © Google.
Why this score? — see what drove the D+ grade
The composite is a weighted blend of 9 inputs, each scored 0–100. Each bar is that input's sub-score; the figure is the points it added to the 100-point composite (weight × sub-score).
- Cash flow +17.5/30.0
- ARV discount +7.5/15.0
- DSCR +5.5/10.0
- 1% rule +4.2/10.0
- Schools +4.1/10.0
- Livability +3.2/5.0
- Condition / age +2.5/5.0
- Rent growth +1.1/5.0
- Appreciation +0.0/10.0
$555,000
🖨 Deal sheet (PDF) 📄 Offer letter ✓ Due diligence
Multi-family units
County records classify this as Multi-Family (2-4 Unit). Listing-text estimate: 3 units. confirmed
Listing remarks MLS
Outstanding investment opportunity in highly desired neighborhood San Carlos Park. This duplex offers 2 bedrooms and 2 baths in each unit which also includes a private lanai and laundry space. The unit to the left side of the duplex has been freshly renovated with new kitchen cabinets, granite counter tops, bathroom vanities and beautiful plank tiles throughout. Exterior received a new coat of paint. Potential to produce $50,000 income. One side is tenant occupied, the renovated unit is ready for new tenant. Only minutes from Gulf Coast Town Center, i75, US41, RSW Airport, restaurants and in an excellent school district.
Key facts
- Fenced in for pets
- Separate laundry
- Private lanai area
Tags
Property features AI
Finance
- Financial info: Property listed as multi-unit (2 units)
- HOA & community: Non-gated community; No HOA amenities
Exterior
- Utilities: Central water; Septic sewer; Cable available
- Home design: Residential income property; Duplex; Located in SAN CARLOS PARK development
- Construction: Concrete block construction; Built in 2004
- Exterior features: Double-hung windows; Stucco exterior; Shingle roof
Interior
- Flooring: Tile
- Bathrooms: 4 full bathrooms
- Heating & cooling: Central electric heat; Central electric cooling
- Interior features: Tile flooring
Neighborhood map
What this means for you Summary
Snapshot
- This is a 3 × 2-bed/2.0-bath units multifamily listed at $555k.
Deal economics
- At list price, monthly cash flow is $2 ($30/yr) — positive. Per door: $1/mo.
- The deal already cash-flows at list — no discount required.
- To meet the 1% rule (rent ≥ 1% of price), the offer needs to be $511k (8.0% below list).
- Recommended offer: $511k (8.0% below list) — sets the bar for 1% rule.
- Cap rate 7.2% vs local median 2.4% in San Carlos Park — top-decile yield for the area; either an underpriced asset or a hidden risk that comps aren't pricing in. Stress-test before assuming the spread holds.
Location & tenants
- Location reads 65/100 on livability (#662 in FL) — a middle-class / working-renter tenant base. Strengths: housing A+, employment A-, crime B+; Watch: amenities F, commute F, health & safety D-.
- Lee (suburban): math 47% / reading 50% proficiency, ranked #42 of 73 in FL (top 58%) — families likely to look elsewhere, expect single-tenant / working-renter base with shorter leases.
- Zoned schools: Heights Elementary School (math 74% / reading 67%, grade A-, #333 of 2,144 statewide, top 16%, 1,109 students, 38% FRL); Lexington Middle School (math 55% / reading 54%, grade B-, #183 of 571 statewide, top 34%, 1,138 students, 44% FRL); South Fort Myers High School (math 23% / reading 30%, grade F, #489 of 667 statewide, top 74%, 1,917 students, 50% FRL).
- Market conditions: Rents falling (-5.7%/yr); 226 active listings in the ZIP; 32 comparable units currently listed for rent nearby; rentals at typical pace (median 23d on market — plan ~3-4 weeks tenant-placement turnaround); solid renter incomes; 15,411 units permitted in Lee County in 2024 (4,686 in 5+ unit buildings).
- At $5,108/mo this rent would consume 68% of the median local household income ($91k/yr) (locally 491% of renters already pay >50% of income on rent) — very limited rent-growth headroom before tenants either downsize or default.
Forward outlook
- Local home prices are declining (-3.0%/yr); year-one equity from $4k of loan paydown is wiped out by about $17k of value loss. Plan a longer hold.
- Lee County population projected at +44% by 2050 — long-run rental-demand tailwind backs the buy-and-hold thesis.
Negotiation context
- Only 14 days on market — expect competitive offers; lowballing is unlikely to land.
- 3 sale attempts since 4y ago with the ask held roughly flat each time — persistent listings suggest the price (not the market) is what's stuck; bring a comps-based counter.
Risks & watch-outs
- Watch-outs: flood insurance adds $427/mo.
- Climate carrying-cost: in FEMA flood zone AE (mandatory federal flood insurance); severe wind risk, 99% chance of damaging wind over 30y; extreme-heat days projected 7→30/yr by 2055 (HVAC capex compounding) — expect insurance premiums to compound above CPI over the hold.
Questions for the listing agent
- Can we see the unit-by-unit rent roll, current vacancy, and any below-market leases? What's the average tenancy length?
- What capital expenditures (roof, boiler, parking lot, exteriors) have been made in the last 5 years, and what's planned in the next 2?
- What's the actual annual flood-insurance premium (NFIP or private), and is the property in a SFHA with mandatory coverage?
- Is there a deadline driving the sale (1031 exchange, divorce, estate, relocation)? That informs how much negotiation room exists.
- Schools are F-rated, which usually means shorter tenancies and higher turnover. Who's the typical renter profile here, and what's been the actual vacancy rate?
- The area grade is low — what's the realistic commute time and amenity access for the typical tenant pool here? Any planned neighborhood developments (good or bad) we should know about?
- What's the average days-on-market for RENTAL listings here right now (not sales)? A rising rental-DOM trend means longer vacancies and softer asking-rent achievability than the comps imply.
- What's the recent tenant-quality profile in this submarket — average credit score on applications, eviction rate, late-payment / NSF rate, and stable-employment percentage? A property-management company in the area should have these aggregated.
- How much new apartment / multifamily construction is in the pipeline within 1–3 miles? Heavy new supply (>2% of stock underway) typically softens rents 12–24 months out; light construction supports rent growth.
Investment metrics
- 1% rule
- 0.92% ✗
- Cap rate
- 7.22%
- Cash-on-cash
- 3.31%
- DSCR
- 1.15
- GRM
- 9.1
CMA / ARV
No comps found within radius.
Projected returns pro-forma
-3.0% appreciation · 0.0% rent growth · sell at horizon
- IRR
- -19.8%
- Equity multiple
- 0.33×
- Total profit
- $-104,547
- Equity at exit
- $82,752
- IRR
- -21.5%
- Equity multiple
- 0.05×
- Total profit
- $-147,879
- Equity at exit
- $47,986
Cash invested: $155,400 (down + closing). Projections, not guarantees.
Landlord ↔ Tenant lean methodology
- Overall (STATE)
- 87 Strongly Landlord-Friendly
- State Florida
- 87 Strongly Landlord-Friendly · R+3
- County
- — inherits STATE
- City
- — inherits STATE
ZIP-level market 33967
- Home prices YoY
- -29.3%
- Rents YoY
- -5.7%
- Active inventory
- 226
- Price-to-rent
- 27.2×
Monthly cashflow live
- Estimated rent
- $5,108 high interval (Pro) →
- Mortgage (P&I)
- −$2,910
- Tax from tax record
- −$465 /mo · $5,575/yr
- Insurance
- −$231
- Flood insurance flood zone
- −$427 /mo · $5,118/yr
- HOA
- −$0
- Vacancy / Maint / Mgmt
- −$1,073
- Net cashflow
- $2
Break-even live
Sensitivity live
| Price | -10% $317 | -5% $160 | +0% $2 | +5% $-155 | +10% $-312 |
|---|---|---|---|---|---|
| Rent | -10% $-401 | -5% $-199 | +0% $2 | +5% $204 | +10% $406 |
| Rate | -1.0pp $282 | -0.5pp $144 | base $2 | +0.5pp $-141 | +1.0pp $-288 |
3-unit breakdown (identical units grouped — click to expand)
| Units | Beds | Baths | Est. rent |
|---|---|---|---|
| 3× units | 2 | 2 | $5,109 |
| #1 | 2 | 2 | $1,703 |
| #2 | 2 | 2 | $1,703 |
| #3 | 2 | 2 | $1,703 |
| Total (3 units) | $5,108 | ||
UW: 25.0% down · 7.5% · 30yr · 1.5% tax · 5.0% vac · 8.0% maint · 8.0% mgmt
Financing live
Cash to close
- Down payment
- $138,750
- Closing costs
- $16,650
- Reserves months
- —
- Total cash needed
- —
Loan-product check · same deal, 3 products live
Conventional
25% down · 7.5% · 30yr
- Down + closing
- —
- Monthly P&I
- —
- Monthly cashflow
- —
- DSCR
- —
- Eligible?
- —
Personal DTI + credit; lowest rate.
DSCR
20% down · 8.5% · 30yr
- Down + closing
- —
- Monthly P&I
- —
- Monthly cashflow
- —
- DSCR
- —
- Eligible?
- —
No personal income docs; deal must DSCR.
Hard money
10% down · 12.0% · 12mo
- Down + closing
- —
- Monthly P&I
- —
- Monthly cashflow
- —
- DSCR
- —
- Eligible?
- —
Short-term bridge; refi at stabilization.
Rent comps 32 comps
| Address | Beds | Baths | Sqft | Rent | $/sqft | DOM | Units | Dist |
|---|---|---|---|---|---|---|---|---|
| 8357 Matanzas Rd Fort Myers, FL | 4.0 | 2.0 | 1828 | $3,095 | $1.69 | 25d | 1 | 0.17mi |
| 8157 Albatross Rd Fort Myers, FL | 4.0 | 2.0 | 1667 | $3,095 | $1.86 | 5d | 1 | 0.25mi |
| 8157 Albatross Rd Fort Myers, FL | 4.0 | 2.0 | 1700 | $3,095 | $1.82 | 25d | 1 | 0.25mi |
| 8418 Wren Rd Fort Myers, FL | 3.0 | 2.0 | 1502 | $2,246 | $1.50 | 3d | 1 | 0.28mi |
| 8430 Southbridge Dr #3 Estero, FL | 3.0 | 2.0 | 1805 | $4,447 | $2.46 | 25d | 1 | 0.29mi |
| 18606 Cedar Dr E Fort Myers, FL | 3.0 | 2.0 | 1698 | $2,676 | $1.58 | 5d | 1 | 0.47mi |
| 18422 Huckleberry Rd Fort Myers, FL | 3.0 | 2.5 | 2028 | $2,975 | $1.47 | 25d | 1 | 0.51mi |
| 18521 Olive Rd Fort Myers, FL | 3.0 | 2.0 | 1798 | $2,396 | $1.33 | 5d | 1 | 0.64mi |
| 18477 Sunflower Rd Fort Myers, FL | 3.0 | 2.0 | 2120 | $2,100 | $0.99 | 17d | 1 | 0.69mi |
| 18477 Sunflower Rd Fort Myers, FL | 3.0 | 2.0 | 1548 | $2,100 | $1.36 | 23d | 1 | 0.69mi |
| 8792 Largo Mar Dr Estero, FL | 4.0 | 3.0 | 2568 | $8,000 | $3.12 | 23d | 1 | 0.82mi |
| 9051 Astonia Way Estero, FL | 4.0 | 3.5 | 2696 | $8,500 | $3.15 | 25d | 1 | 0.83mi |
| 18500 Winter Haven Rd Fort Myers, FL | 3.0 | 2.0 | 1523 | $2,100 | $1.38 | 23d | 1 | 0.84mi |
| 8847 Largo Mar Dr Estero, FL | 3.0 | 2.0 | 2099 | $4,500 | $2.14 | 21d | 1 | 0.90mi |
| 18145 Baruch Dr Fort Myers, FL | 4.0 | 2.0 | 1818 | $2,531 | $1.39 | 5d | 1 | 0.90mi |
| 9135 Astonia Way Estero, FL | 4.0 | 2.5 | 2539 | $3,000 | $1.18 | 25d | 1 | 0.95mi |
| 18125 Hilda Dr Fort Myers, FL | 3.0 | 2.0 | 1517 | $2,056 | $1.36 | 16d | 1 | 0.96mi |
| 19809 Maddelena Cir Estero, FL | 3.0 | 2.0 | 2348 | $3,500 | $1.49 | 25d | 1 | 0.96mi |
| 18205 Apple Rd Fort Myers, FL | 3.0 | 2.0 | 1588 | $2,646 | $1.67 | 5d | 1 | 0.99mi |
| 19639 Villa Rosa Loop Estero, FL | 3.0 | 2.0 | 2075 | $2,600 | $1.25 | 13d | 1 | 1.03mi |
| 7340 Stoney Grove CIR Fort Myers, FL | 1.0–3.0 | 1.0–2.0 | 1106 | $2,595 | $2.35 | 3d | 39 | 1.12mi |
| 9980 Portofino Vineyards Dr Fort Myers, FL | 3.0–4.0 | 2.5–3.5 | 2026 | $4,399 | $2.17 | 4d | 56 | 1.18mi |
| 7286 Jonas Rd Fort Myers, FL | 3.0 | 2.0 | 1427 | $2,556 | $1.79 | 17d | 1 | 1.19mi |
| 19721 Tesoro Way Estero, FL | 4.0 | 4.5 | 2839 | $3,950 | $1.39 | 25d | 1 | 1.27mi |
| 18015 Horseshoe Bay Cir Fort Myers, FL | 3.0 | 2.0 | 1623 | $3,350 | $2.06 | 25d | 1 | 1.28mi |
| 9151 Kings Cove Ct Fort Myers, FL | 4.0 | 3.0 | 2710 | $3,000 | $1.11 | 25d | 1 | 1.28mi |
| 19738 Tesoro Way Unit 1545812P Fort Myers, FL | 3.0 | 2.0 | 1496 | $3,871 | $2.59 | 17d | 1 | 1.31mi |
| 17700 Middle Oak Ct Fort Myers, FL | 3.0 | 2.0 | 1943 | $2,800 | $1.44 | 25d | 1 | 1.33mi |
| 3702 Pino Vista Way #3 Estero, FL | 3.0 | 2.0 | 1610 | $2,300 | $1.43 | 5d | 1 | 1.36mi |
| 17412 Oriole Rd Fort Myers, FL | 3.0 | 2.0 | 1483 | $2,025 | $1.37 | 15d | 1 | 1.38mi |
| 3783 Pino Vista Way #201 Estero, FL | 3.0 | 2.0 | 1523 | $3,300 | $2.17 | 25d | 1 | 1.42mi |
| 18911 Bay Woods Lake Dr #201 Fort Myers, FL | 3.0 | 2.0 | 2348 | $3,000 | $1.28 | 25d | 1 | 1.45mi |
Listing history 10 events
-
2026-06-22days on market $555,000 Active 14 DOM
-
2026-06-18days on market $555,000 Active 11 DOM
-
2026-06-17days on market $555,000 Active 10 DOM
-
2026-06-16days on market $555,000 Active 9 DOM
-
2026-06-15days on market $555,000 Active 8 DOM
-
2026-06-13days on market $555,000 Active 6 DOM
-
2026-06-10days on market $555,000 Active 3 DOM
-
2026-06-09days on market $555,000 Active 2 DOM
-
2026-06-07remarks 623-char remark
-
2026-06-07$555,000 Active 1 DOM
ⓘ Source: listings_history table (triggers on properties + properties_extension) + one-shot
backfill from property_details.listing_events for pre-trigger history.
Tax reassessment forecast FL · Resets to sale price
- Current annual tax
- $5,575 · $465/mo
- Projected year-2 tax
- $5,575 · $465/mo
- Expected delta
- $0/yr ($0/mo · 0.0%)
ⓘ Screening estimate from a state-policy table — verify with the county assessor before closing.
Climate risk First Street
- Flood 3/10 Moderate FEMA zone AE · 12% chance over 30 yrs
- Wildfire 1/10 Low
- Heat 10/10 Extreme 7 d/yr ≥107°F today · 30 d/yr by 30 yrs out
- Wind 10/10 Extreme 99% chance of damaging wind over 30 yrs
- Air quality 2/10 Low 1 unhealthy d/yr today · 1 by 30 yrs out
Nearby sold comps map
Loading sold comps map…
Walkable amenities ~0.75 mi
Loading nearby amenities…
Taxation est. · year 1
- Rental income
- $61,296
- − Mortgage interest
- −$31,089
- − Property taxes
- −$5,575
- − Insurance
- −$7,894
- − Repairs & maintenance
- −$4,904
- − Management
- −$4,904
- − Depreciation
- −$16,145
- Taxable loss
- −$9,214
- Est. tax savings @ 24.0%
- +$2,211
- After-tax cash flow
- $2,241/yr
For passive investors: Depreciation is non-cash, so a rental often shows a tax loss while cash-flowing — sheltering income. Rental losses are passive: they offset passive income freely, and up to $25,000/yr can offset ordinary (W-2) income if you actively participate and your MAGI is under $100k (phasing out to $0 by $150k); unused losses carry forward. On sale, claimed depreciation is recaptured at up to 25%, and gains may owe capital-gains tax (a 1031 exchange can defer both). Figures are a year-1 estimate at your 24.0% rate — not tax advice; consult a CPA.
Schools (NCES district)
- District
- Lee
- NCES district ID
- 1201080
- Math proficiency
- 47% ▼ -11.00%
- Reading proficiency
- 50% ▼ -4.00%
- Median HH income
- $49,518
- Composite
- 41.49/100
- National rank
- #3458
- State rank
- #42 of 73 in FL
Livability — San Carlos Park
- Score
- 65/100
- State rank
- #662
- US rank
- #13354
Category grades
Schools grade is shown separately in the Schools card above.
Census & demographics
- Census place
- San Carlos Park, FL
- County
- Lee County · 788,662 people
- City population
- 27,337
- Metro
- Cape Coral-Fort Myers, FL
- Population (ZIP)
- 28,341
- Household income
- $90,519
- Rent vs Own
- Severe rent burden
- 491.0
Population outlook (Lee County) Hauer SSP2
- Today (2025)
- 871,946 people
- By 2030
- 955,468 · +9.6%
- By 2040
- 1,113,587 · +27.7%
- By 2050
- 1,256,891 · +44.1%
- By 2075
- 1,560,270 · +78.9%
- By 2100
- 1,726,848 · +98.0%
Race, ethnicity, and origin ACS 2023
- Neighborhood character
- Predominantly White (67%)
- Race & ethnicity
- White 67% Hispanic / Latino 23% Two or more races 16% Asian 3% Black 3%
- Hispanic origin (detail)
- Mexican 8% Puerto Rican 2% Cuban 4% Dominican 1%
- Common ancestry
- Romanian 3% Lithuanian 2% Slovak 2%
- Foreign-born
- 14% · Canada, Jamaica, Vietnam
- Languages at home
- 79% English-only · Spanish 16% Other Indo-European 1% Vietnamese 1%
Political lean MEDSL · Lee
- 2024 margin
- Strong R (+28.4) · D 35.5% · R 63.9%
- 2008→2024 swing
- -18.0pp toward R · 2008: -10.4pp · 2024: -28.4pp
- All cycles
- 2024: R+28.4 2020: R+19.2 2016: R+20.4 2012: R+16.6 2008: R+10.4
Not yet ingested
- Civics
- —
Market trends
- HPI YoY
- ▼ -123.07%
- Current HPI
- 296.5923
- Rent YoY
- ▼ -5.68%
- Metro
- Cape Coral-Fort Myers, FL
- State GDP YoY
- ▲ 3.28%
- F500 in state
- 36
Industry mix (Fortune 500 HQ in FL)
| Industry | F500 HQs | Revenue |
|---|---|---|
| Industrial Technology | 2 | $29B |
|
||
| Insurance | 2 | $17B |
|
||
| Retail | 1 | $60B |
|
||
| Technology Distribution | 1 | $58B |
|
||
| Homebuilding | 1 | $35B |
|
||
| Technology Manufacturing | 1 | $35B |
|
||
Price history
+670.8% since first listed18 events — show timeline
- 2026-06-07 Listed $555,000 NAPLESMLS
- 2023-08-31 Sold (Public Records) $520,000 Public Records
- 2023-08-29 Sold (MLS) $520,000 NAPLESMLS
- 2023-08-08 Pending — NAPLESMLS
- 2023-07-08 Price Changed $540,000 NAPLESMLS
- 2023-06-09 Price Changed $565,000 NAPLESMLS
- 2023-05-05 Listed $575,000 NAPLESMLS
- 2022-12-20 Sold (Public Records) $365,000 Public Records
- 2022-11-30 Sold (MLS) $365,000 FORTMLS
- 2022-11-01 Pending — FORTMLS
- 2022-09-09 Price Changed $417,500 FORTMLS
- 2022-05-20 Price Changed $439,000 FORTMLS
- 2022-05-20 Price Changed $469,000 FORTMLS
- 2022-05-19 Listed $439,000 FORTMLS
- 2001-03-13 Sold (Public Records) $48,000 Public Records
- 2001-03-02 Sold (MLS) $12,000 FORTMLS
- 2001-02-19 Price Changed $12,500 FORTMLS
- 1993-04-01 Sold (Public Records) $72,000 Public Records
Property tax history
+8.7%/yrLatest (2025): $5,575 · +8.5% YoY. Source: county tax records.
Cash-flow waterfall
monthlySold comps — $/sqft
last 12 mo · ≤1 miLoading sold comps…