 5-Plex
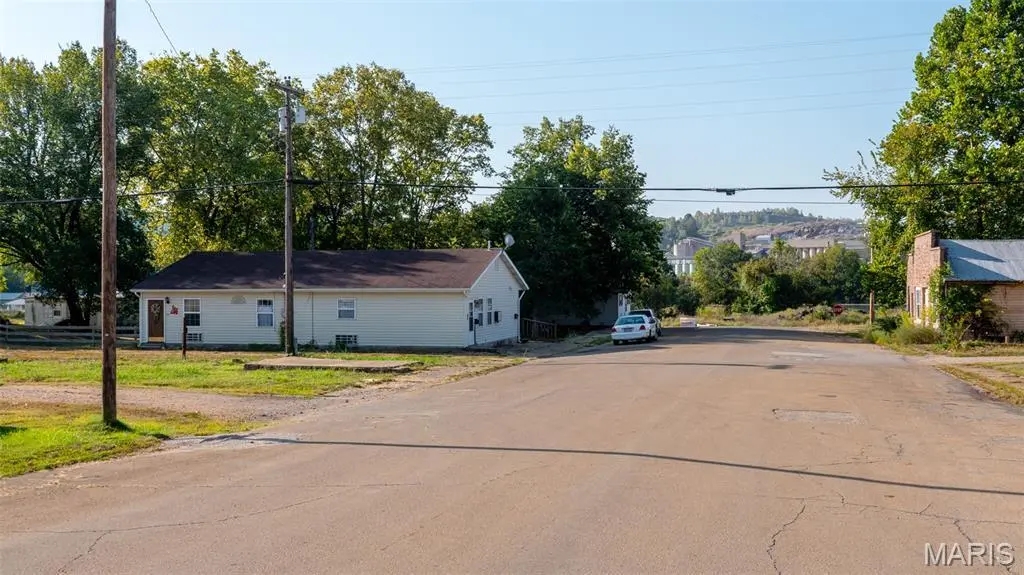
105 N Allen St · Annapolis, MO
Flood risk 1/10 · Minimal
- FEMA flood zone
- X (unshaded)
- Chance of flooding over 30 yrs
- 0.0%
- Est. flood insurance / yr
- $507 – $1,088
Fire risk 4/10 · Minor
- Est. fire insurance / yr
- $1,054 – $1,958
Heat risk 6/10 · Moderate
- Hot days now (above 106°F)
- 7 days/yr
- Hot days in 30 yrs
- 23 days/yr
Wind risk 2/10 · Minimal
- Chance of severe wind over 30 yrs
- 2.0%
Air-quality risk 1/10 · Minimal
- Unhealthy air days now
- 0 days/yr
- Unhealthy air days in 30 yrs
- 0 days/yr
Risk factors via First Street. Map © Google.
Why this score? — see what drove the B+ grade
The composite is a weighted blend of 9 inputs, each scored 0–100. Each bar is that input's sub-score; the figure is the points it added to the 100-point composite (weight × sub-score).
- Cash flow +30.0/30.0
- 1% rule +10.0/10.0
- DSCR +10.0/10.0
- ARV discount +7.5/15.0
- Appreciation +7.5/10.0
- Schools +2.9/10.0
- Condition / age +2.8/5.0
- Rent growth +2.5/5.0
- Livability +2.5/5.0
$125,000
🖨 Deal sheet 📄 Offer letter ✓ Due diligence
Multi-family units
County records classify this as Multi-Family (2-4 Unit). Listing-text estimate: 5 units. estimate disagrees with records
Listing remarks MLS
Multi Unit Investment Property! This versatile property offers 4 unique rental units, ideal for investors or owner/occupants seeking income potential. Unit A-1 bed/1bath, approx. 504 sq ft, featuring an eat in kitchen. Unit B-1bed/1bath Studio Style approx. 280 sq ft. Newly remodeled. Unit C-Hotel Style-1bed/ 1bath only additional space could be added to this room . Unit D-1bed/bath approx. 504 sq ft with eat in kitchen. Each unit offers its own character, with functional layouts and desirable features. Efficient use of space make these units attractive to a wide range of tenants. Whether you are expanding your portfolio or starting fresh, this property provides rental income potential.
Key facts
- 2,178 sq ft lot
- Built 1998
- Listed 276 days
Neighborhood map
What this means for you Summary
Snapshot
- This is a 4×1.0bd/1.0ba + 1×?bd/0.2ba units multifamily listed at $125k. Condition is rated average.
Deal economics
- At list price, monthly cash flow is $2k ($25k/yr) — positive. Per door: $412/mo.
- The deal already cash-flows at list — no discount required.
- Meets the 1% rule at list price ($4k rent vs $125k).
- Recommended offer: $110k (12.0% below list) — sets the bar for market timing.
Location & tenants
- Location reads 50/100 on livability (#905 in MO) — a working-class tenant base; expect higher turnover. Strengths: cost of living A+, housing A+; Watch: schools F, crime F, amenities F.
- South Iron County R-I (rural): math 30% / reading 35% proficiency, ranked #443 of 535 in MO (top 83%) — families likely to look elsewhere, expect single-tenant / working-renter base with shorter leases; 68% free/reduced lunch — lower-income household profile, screen leases tightly.
- Market conditions: 39 active listings in the ZIP; 6 units permitted in Iron County in 2024 (0 in 5+ unit buildings).
Forward outlook
- In year one you build about $7k of equity ($864 loan paydown + $6k appreciation (5.1% local appreciation)).
- Iron County population projected at -25% by 2050 — secular population decline; favor cash flow + early exit over multi-decade hold.
- At projected returns (5.1% appreciation + 3.0% rent growth), your $35k cash investment doubles in ~2 years — after that, you're playing with house money.
- By year 5, paydown + projected appreciation supports a ~$31k cash-out refi (75% LTV) — recoverable capital for the next deal without selling this one.
Negotiation context
- It's been on market 277 days — a 12% lower offer ($110k) is reasonable based on typical stale-listing flexibility.
- 4 sale attempts since 3y ago with the ask held roughly flat each time — persistent listings suggest the price (not the market) is what's stuck; bring a comps-based counter.
Risks & watch-outs
- Climate carrying-cost: extreme-heat days projected 7→23/yr by 2055 (HVAC capex compounding) — expect insurance premiums to compound above CPI over the hold.
Questions for the listing agent
- It's been on market 277 days. Have you received any prior offers? Is the seller open to a 12% concession, seller financing, or rate buy-down credit?
- Can we see the unit-by-unit rent roll, current vacancy, and any below-market leases? What's the average tenancy length?
- What capital expenditures (roof, boiler, parking lot, exteriors) have been made in the last 5 years, and what's planned in the next 2?
- Why hasn't it sold? Are there any deal-killer items the seller is aware of (foundation, flood, title, zoning, code violations)?
- Is there a deadline driving the sale (1031 exchange, divorce, estate, relocation)? That informs how much negotiation room exists.
- Schools are F-rated, which usually means shorter tenancies and higher turnover. Who's the typical renter profile here, and what's been the actual vacancy rate?
- Crime grade is F in this area — have there been break-ins, vandalism, or insurance claims at this property in the last 3 years? What carrier currently insures it and at what premium?
- What's the average days-on-market for RENTAL listings here right now (not sales)? A rising rental-DOM trend means longer vacancies and softer asking-rent achievability than the comps imply.
- What's the recent tenant-quality profile in this submarket — average credit score on applications, eviction rate, late-payment / NSF rate, and stable-employment percentage? A property-management company in the area should have these aggregated.
- How much new apartment / multifamily construction is in the pipeline within 1–3 miles? Heavy new supply (>2% of stock underway) typically softens rents 12–24 months out; light construction supports rent growth.
Investment metrics
- 1% rule
- 2.96% ✓
- Cap rate
- 26.05%
- Cash-on-cash
- 70.55%
- DSCR
- 4.14
- GRM
- 2.8
CMA / ARV
No comps found within radius.
Projected returns pro-forma
5.07% appreciation · 3.0% rent growth · sell at horizon
- IRR
- 77.0%
- Equity multiple
- 5.58×
- Total profit
- $160,432
- Equity at exit
- $71,387
- IRR
- 75.0%
- Equity multiple
- 11.62×
- Total profit
- $371,579
- Equity at exit
- $123,662
Cash invested: $35,000 (down + closing). Projections, not guarantees.
Landlord ↔ Tenant lean methodology
- Overall (STATE)
- 81 Strongly Landlord-Friendly
- State Missouri
- 81 Strongly Landlord-Friendly · R+10
- County
- — inherits STATE
- City
- — inherits STATE
ZIP-level market 63620
- Home prices YoY
- 3.4%
- Active inventory
- 39
- Price-to-rent
- 14.1×
Monthly cashflow live
- Estimated rent
- $3,698 medium interval (Pro) →
- Mortgage (P&I)
- −$656
- Tax est. 1.5%
- −$156 /mo · $1,875/yr
- Insurance
- −$52
- HOA
- −$0
- Vacancy / Maint / Mgmt
- −$777
- Net cashflow
- $2,058
Break-even live
5-unit breakdown (identical units grouped — click to expand)
| Units | Beds | Baths | Est. rent |
|---|---|---|---|
| 4× units | 1.0 | 1 | $2,956 |
| #1 | 1.0 | 1 | $739 |
| #2 | 1.0 | 1 | $739 |
| #3 | 1.0 | 1 | $739 |
| #4 | 1.0 | 1 | $739 |
| 1× unit | 0 | 0.2 | $743 |
| Total (5 units) | $3,698 | ||
UW: 25.0% down · 7.5% · 30yr · 1.5% tax · 5.0% vac · 8.0% maint · 8.0% mgmt
Financing live
Cash to close
- Down payment
- $31,250
- Closing costs
- $3,750
- Reserves months
- —
- Total cash needed
- —
Loan-product check · same deal, 3 products live
Conventional
25% down · 7.5% · 30yr
- Down + closing
- —
- Monthly P&I
- —
- Monthly cashflow
- —
- DSCR
- —
- Eligible?
- —
Personal DTI + credit; lowest rate.
DSCR
20% down · 8.5% · 30yr
- Down + closing
- —
- Monthly P&I
- —
- Monthly cashflow
- —
- DSCR
- —
- Eligible?
- —
No personal income docs; deal must DSCR.
Hard money
10% down · 12.0% · 12mo
- Down + closing
- —
- Monthly P&I
- —
- Monthly cashflow
- —
- DSCR
- —
- Eligible?
- —
Short-term bridge; refi at stabilization.
Listing history 26 events
-
2026-06-18days on market $125,000 Active 277 DOM
-
2026-06-17days on market $125,000 Active 276 DOM
-
2026-06-16days on market $125,000 Active 275 DOM
-
2026-06-15days on market $125,000 Active 274 DOM
-
2026-06-13days on market $125,000 Active 272 DOM
-
2026-06-12days on market $125,000 Active 271 DOM
-
2026-06-09days on market $125,000 Active 268 DOM
-
2026-06-08days on market $125,000 Active 267 DOM
-
2026-06-07days on market $125,000 Active 266 DOM
-
2026-06-07days on market $125,000 Active 265 DOM
-
2026-06-04days on market $125,000 Active 262 DOM
-
2026-06-02days on market $125,000 Active 261 DOM
-
2026-06-01days on market $125,000 Active 260 DOM
-
2026-05-31days on market $125,000 Active 259 DOM
-
2025-11-21price $125,000 702-char remark
Show marketing remark (702 chars)
Multi Unit Investment Property! This versatile property offers 4 unique rental units, ideal for investors or owner/occupants seeking income potential. Unit A-1 bed/1bath, approx. 504 sq ft, featuring an eat in kitchen. Unit B-1bed/1bath Studio Style approx. 280 sq ft. Newly remodeled. Unit C-Hotel Style-1bed/ 1bath only additional space could be added to this room . Unit D-1bed/bath approx. 504 sq ft with eat in kitchen. Each unit offers its own character, with functional layouts and desirable features. Efficient use of space make these units attractive to a wide range of tenants. Whether you are expanding your portfolio or starting fresh, this property provides rental income potential.
-
2025-09-14$129,900 Active 702-char remark
Show marketing remark (702 chars)
Multi Unit Investment Property! This versatile property offers 4 unique rental units, ideal for investors or owner/occupants seeking income potential. Unit A-1 bed/1bath, approx. 504 sq ft, featuring an eat in kitchen. Unit B-1bed/1bath Studio Style approx. 280 sq ft. Newly remodeled. Unit C-Hotel Style-1bed/ 1bath only additional space could be added to this room . Unit D-1bed/bath approx. 504 sq ft with eat in kitchen. Each unit offers its own character, with functional layouts and desirable features. Efficient use of space make these units attractive to a wide range of tenants. Whether you are expanding your portfolio or starting fresh, this property provides rental income potential.
-
2025-09-14historical $129,900 702-char remark
Show marketing remark (702 chars)
Multi Unit Investment Property! This versatile property offers 4 unique rental units, ideal for investors or owner/occupants seeking income potential. Unit A-1 bed/1bath, approx. 504 sq ft, featuring an eat in kitchen. Unit B-1bed/1bath Studio Style approx. 280 sq ft. Newly remodeled. Unit C-Hotel Style-1bed/ 1bath only additional space could be added to this room . Unit D-1bed/bath approx. 504 sq ft with eat in kitchen. Each unit offers its own character, with functional layouts and desirable features. Efficient use of space make these units attractive to a wide range of tenants. Whether you are expanding your portfolio or starting fresh, this property provides rental income potential.
-
2024-10-31historical
-
2024-08-22price $131,900
-
2024-06-12status Active
-
2024-05-31historical
-
2024-05-24price $136,900
-
2023-09-07status Active
-
2023-08-14historical Active Under Contract
-
2023-07-02price $139,900
-
2023-04-02$149,900 Active
ⓘ Source: listings_history table (triggers on properties + properties_extension) + one-shot
backfill from property_details.listing_events for pre-trigger history.
Climate risk First Street
- Flood 1/10 Low FEMA zone X (unshaded) · 0% chance over 30 yrs
- Wildfire 4/10 Moderate
- Heat 6/10 Major 7 d/yr ≥106°F today · 23 d/yr by 30 yrs out
- Wind 2/10 Low 2% chance of damaging wind over 30 yrs
- Air quality 1/10 Low 0 unhealthy d/yr today · 0 by 30 yrs out
Nearby sold comps map
Loading sold comps map…
Walkable amenities ~0.75 mi
Loading nearby amenities…
Taxation est. · year 1
- Rental income
- $44,376
- − Mortgage interest
- −$7,002
- − Property taxes
- −$1,875
- − Insurance
- −$625
- − Repairs & maintenance
- −$3,550
- − Management
- −$3,550
- − Depreciation
- −$3,636
- Taxable income
- $24,138
- Est. tax owed @ 24.0%
- −$5,793
- After-tax cash flow
- $18,898/yr
For passive investors: Depreciation is non-cash, so a rental often shows a tax loss while cash-flowing — sheltering income. Rental losses are passive: they offset passive income freely, and up to $25,000/yr can offset ordinary (W-2) income if you actively participate and your MAGI is under $100k (phasing out to $0 by $150k); unused losses carry forward. On sale, claimed depreciation is recaptured at up to 25%, and gains may owe capital-gains tax (a 1031 exchange can defer both). Figures are a year-1 estimate at your 24.0% rate — not tax advice; consult a CPA.
Condition & rehab AI · 12 photos
This multi-family property requires moderate repairs and maintenance to improve its condition and increase its resale and rental value.
Repairs flagged
- Major roof — visible wear
- Major HVAC/mechanicals — portable air conditioner
Value-add opportunities
- Both paint exterior — enhances curb appeal and resale value
- Both repair roof — improves home's condition and extends life
- Both replace HVAC system — increases comfort and energy efficiency
Renovation cost estimate screening
| Repair item | Severity | Est. cost |
|---|---|---|
| roof · visible wear | Major | $15,000–50,000 |
| HVAC/mechanicals · portable air conditioner | Major | $15,000–50,000 |
| Total estimated repair cost · 2 items | $30,000–100,000 |
Value-add ROI direction
- Both paint exterior — enhances curb appeal and resale value ↑
- Both repair roof — improves home's condition and extends life ↑
- Both replace HVAC system — increases comfort and energy efficiency ↑
ⓘ Cost ranges are severity-bucket heuristics (US national rule-of-thumb). Get contractor quotes + a written scope before underwriting a rehab budget.
Schools (NCES district)
- District
- South Iron County R-I
- NCES district ID
- 2928470
- Math proficiency
- 30% ▼ -5.00%
- Reading proficiency
- 35% ▼ -5.00%
- Median HH income
- $32,320
- Composite
- 29.31/100
- National rank
- #11838
- State rank
- #443 of 535 in MO
Livability — Annapolis
- Score
- 50/100
- State rank
- #905
- US rank
- #25607
Category grades
Schools grade is shown separately in the Schools card above.
Census & demographics
- Census place
- Annapolis, MO
- Population (ZIP)
- 1,142
Population outlook (Iron County) Hauer SSP2
- Today (2025)
- 9,245 people
- By 2030
- 8,745 · -5.4%
- By 2040
- 7,808 · -15.5%
- By 2050
- 6,944 · -24.9%
- By 2075
- 5,320 · -42.5%
- By 2100
- 4,245 · -54.1%
Race, ethnicity, and origin ACS 2023
- Neighborhood character
- Predominantly White (90%)
- Race & ethnicity
- White 90% Two or more races 7% Hispanic / Latino 3% Black 1%
- Common ancestry
- Romanian 2% Serbian 2% Italian 1%
- Foreign-born
- 0%
- Languages at home
- 99% English-only · Spanish 1%
Political lean MEDSL · Iron
- 2024 margin
- Solid R (+62.4) · D 18.2% · R 80.7% · Other 1.1%
- 2008→2024 swing
- -65.2pp toward R · 2008: 2.8pp · 2024: -62.4pp
- All cycles
- 2024: R+62.4 2020: R+57.7 2016: R+52.6 2012: R+14.5 2008: D+2.8
Not yet ingested
- Civics
- —
Market trends
- HPI YoY
- ▲ 5.07%
- Current HPI
- 152.6846
- Rent YoY
- —
- Metro
- —
- State GDP YoY
- ▲ 1.84%
- F500 in state
- 20
Industry mix (Fortune 500 HQ in MO)
| Industry | F500 HQs | Revenue |
|---|---|---|
| Healthcare | 1 | $163B |
|
||
| Insurance | 1 | $21B |
|
||
| Industrial Technology | 1 | $17B |
|
||
| Retail | 1 | $16B |
|
||
| Industrial Distribution | 1 | $10B |
|
||
| Utilities | 1 | $9B |
|
||
Price history
-16.6% since first listed12 events — show timeline
- 2025-11-21 Price Changed $125,000 MARIS as Distributed by MLS Grid
- 2025-09-14 Listed $129,900 MARIS as Distributed by MLS Grid
- 2025-09-14 Coming Soon $129,900 MARIS as Distributed by MLS Grid
- 2024-10-31 Delisted — MARIS as Distributed by MLS Grid
- 2024-08-22 Price Changed $131,900 MARIS as Distributed by MLS Grid
- 2024-06-12 Relisted — MARIS as Distributed by MLS Grid
- 2024-05-31 Delisted — MARIS as Distributed by MLS Grid
- 2024-05-24 Price Changed $136,900 MARIS as Distributed by MLS Grid
- 2023-09-07 Relisted — MARIS as Distributed by MLS Grid
- 2023-08-14 Contingent — MARIS as Distributed by MLS Grid
- 2023-07-02 Price Changed $139,900 MARIS as Distributed by MLS Grid
- 2023-04-02 Listed $149,900 MARIS as Distributed by MLS Grid
Cash-flow waterfall
monthlySold comps — $/sqft
last 12 mo · ≤1 miLoading sold comps…