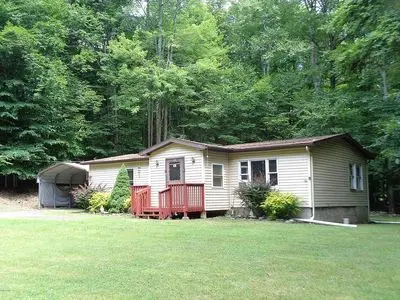
49 Sunrise Trl · The Hideout, PA
Flood risk 1/10 · Minimal
- FEMA flood zone
- X (unshaded)
- Chance of flooding over 30 yrs
- 0.0%
- Est. flood insurance / yr
- $507 – $1,088
Fire risk 1/10 · Minimal
- Est. fire insurance / yr
- $511 – $949
Heat risk 2/10 · Minimal
- Hot days now (above 91°F)
- 7 days/yr
- Hot days in 30 yrs
- 16 days/yr
Wind risk 2/10 · Minimal
- Chance of severe wind over 30 yrs
- 3.0%
Air-quality risk 2/10 · Minimal
- Unhealthy air days now
- 1 days/yr
- Unhealthy air days in 30 yrs
- 2 days/yr
Risk factors via First Street. Map © Google.
Why this score? — see what drove the C+ grade
The composite is a weighted blend of 9 inputs, each scored 0–100. Each bar is that input's sub-score; the figure is the points it added to the 100-point composite (weight × sub-score).
- Cash flow +21.6/30.0
- Appreciation +10.0/10.0
- ARV discount +7.7/15.0
- DSCR +6.9/10.0
- 1% rule +4.8/10.0
- Schools +4.2/10.0
- Livability +3.6/5.0
- Rent growth +2.5/5.0
- Condition / age +2.5/5.0
$225,000
🖨 Deal sheet 📄 Offer letter ✓ Due diligence
Listing remarks MLS
VERY AFFORDABLE!!! Private, year round or vacation, 3 bdrm renovated ranch with Florida room, carport, and storage shed. Move in ready and easy to maintain. Friendly, low key, low dues community with lovely lake and sandy beach, large picnic and entertaining pavilion, ball field, and playground. Low taxes. Commutable distance to NYC and other major metro areas.
Key facts
- Sandy beach
- Florida room
- Carport
Tags
Neighborhood map
What this means for you Summary
Snapshot
- This is a 3-bed/1.0-bath single-family listed at $225k.
Deal economics
- At list price, monthly cash flow is $343 ($4k/yr) — positive.
- The deal already cash-flows at list — no discount required.
- To meet the 1% rule (rent ≥ 1% of price), the offer needs to be $221k (1.7% below list).
- Recommended offer: $221k (1.7% below list) — sets the bar for 1% rule.
- Cap rate 8.1% vs local median 5.0% in The Hideout — top-decile yield for the area; either an underpriced asset or a hidden risk that comps aren't pricing in. Stress-test before assuming the spread holds.
Location & tenants
- Location reads 72/100 on livability (#668 in PA) — a middle-class / working-renter tenant base. Strengths: crime A+, employment A+, cost of living A+; Watch: schools D, amenities F, commute F.
- Wallenpaupack Area SD (rural): math 39% / reading 59% proficiency, ranked #192 of 539 in PA (top 36%) — families likely to look elsewhere, expect single-tenant / working-renter base with shorter leases.
- Market conditions: 371 active listings in the ZIP; 177 units permitted in Wayne County in 2024 (0 in 5+ unit buildings).
Forward outlook
- In year one you build about $24k of equity ($2k loan paydown + $22k appreciation (10.0% local appreciation)).
- Wayne County population projected at -17% by 2050 — secular population decline; favor cash flow + early exit over multi-decade hold.
- At projected returns (10.0% appreciation + 3.0% rent growth), your $63k cash investment doubles in ~3 years — after that, you're playing with house money.
- By year 2, paydown + projected appreciation supports a ~$39k cash-out refi (75% LTV) — recoverable capital for the next deal without selling this one.
Negotiation context
- It's been on market 23 days — a 2% lower offer ($222k) is reasonable based on typical stale-listing flexibility.
- 3 sale attempts since 6y ago with the ask held roughly flat each time — persistent listings suggest the price (not the market) is what's stuck; bring a comps-based counter.
- Current owner paid $122k; list at $225k implies a 84% gain — meaningful room to come down on a strong offer.
Questions for the listing agent
- Built in 1970 — when were the roof, HVAC, electrical panel, plumbing, and water heater last replaced?
- Is there a deadline driving the sale (1031 exchange, divorce, estate, relocation)? That informs how much negotiation room exists.
- Schools are D-rated, which usually means shorter tenancies and higher turnover. Who's the typical renter profile here, and what's been the actual vacancy rate?
- What's the average days-on-market for RENTAL listings here right now (not sales)? A rising rental-DOM trend means longer vacancies and softer asking-rent achievability than the comps imply.
- What's the recent tenant-quality profile in this submarket — average credit score on applications, eviction rate, late-payment / NSF rate, and stable-employment percentage? A property-management company in the area should have these aggregated.
- How much new for-sale + rental construction is in the pipeline within 1–3 miles? Heavy new supply typically softens prices + rents 12–24 months out; constrained supply supports both.
Investment metrics
- 1% rule
- 0.98% ✗
- Cap rate
- 8.12%
- Cash-on-cash
- 6.54%
- DSCR
- 1.29
- GRM
- 8.5
CMA / ARV
- ARV (on-the-fly)
- $225,984
- Comps found
- 7
Show comp detail 7 sales within ~0.75 mi
| Address | Dist | Beds/Ba | Sqft | Sold | Price | $/sf | Match |
|---|---|---|---|---|---|---|---|
| 97 Tiffany Rd | 0.56mi | 2/1.0 (-1) | 1,062 (+1%) | 4mo | $190,000 | $179 | 65 |
| 65 Windsor Rd | 0.49mi | 3/1.0 | 960 (-9%) | 1mo | $224,900 | $234 | 61 |
| 167 W Shore Dr | 0.54mi | 3/2.0 | 1,054 (-0%) | 13mo | $553,300 | $525 | 59 |
| 36 Fawn Rd | 0.56mi | 3/1.5 | 1,100 (+4%) | 15mo | $235,000 | $214 | 52 |
| 23 Highland Ln | 0.64mi | 2/1.0 (-1) | 936 (-11%) | 9mo | $199,900 | $214 | 39 |
| 142 Sunrise Trl | 0.44mi | 2/1.5 (-1) | 1,147 (+9%) | 24mo | $222,500 | $194 | 38 |
| 99 Ferris Rd | 0.65mi | 2/1.5 (-1) | 961 (-9%) | 12mo | $210,000 | $219 | 37 |
Match score weights: distance 35% · size 25% · config 20% · recency 20%. Top-matched comps best support the ARV.
Projected returns pro-forma
10.0% appreciation · 3.0% rent growth · sell at horizon
- IRR
- 29.0%
- Equity multiple
- 3.29×
- Total profit
- $144,357
- Equity at exit
- $202,698
- IRR
- 25.2%
- Equity multiple
- 7.47×
- Total profit
- $407,788
- Equity at exit
- $437,126
Cash invested: $63,000 (down + closing). Projections, not guarantees.
Landlord ↔ Tenant lean methodology
- Overall (STATE)
- 62 Landlord-Friendly
- State Pennsylvania
- 62 Landlord-Friendly · EVEN
- County
- — inherits STATE
- City
- — inherits STATE
ZIP-level market 18428
- Home prices YoY
- 9.2%
- Active inventory
- 371
- Price-to-rent
- 8.5×
Monthly cashflow live
- Estimated rent
- $2,213 medium interval (Pro) →
- Mortgage (P&I)
- −$1,180
- Tax from tax record
- −$131 /mo · $1,570/yr
- Insurance
- −$94
- HOA
- −$0
- Vacancy / Maint / Mgmt
- −$465
- Net cashflow
- $343
Break-even live
UW: 25.0% down · 7.5% · 30yr · 1.5% tax · 5.0% vac · 8.0% maint · 8.0% mgmt
Financing live
Cash to close
- Down payment
- $56,250
- Closing costs
- $6,750
- Reserves months
- —
- Total cash needed
- —
Loan-product check · same deal, 3 products live
Conventional
25% down · 7.5% · 30yr
- Down + closing
- —
- Monthly P&I
- —
- Monthly cashflow
- —
- DSCR
- —
- Eligible?
- —
Personal DTI + credit; lowest rate.
DSCR
20% down · 8.5% · 30yr
- Down + closing
- —
- Monthly P&I
- —
- Monthly cashflow
- —
- DSCR
- —
- Eligible?
- —
No personal income docs; deal must DSCR.
Hard money
10% down · 12.0% · 12mo
- Down + closing
- —
- Monthly P&I
- —
- Monthly cashflow
- —
- DSCR
- —
- Eligible?
- —
Short-term bridge; refi at stabilization.
Listing history 22 events
-
2026-06-18days on market $225,000 Active 23 DOM
-
2026-06-17days on market $225,000 Active 22 DOM
-
2026-06-16days on market $225,000 Active 21 DOM
-
2026-06-15days on market $225,000 Active 20 DOM
-
2026-06-13days on market $225,000 Active 18 DOM
-
2026-06-13days on market $225,000 Active 17 DOM
-
2026-06-09days on market $225,000 Active 14 DOM
-
2026-06-08days on market $225,000 Active 13 DOM
-
2026-06-07days on market $225,000 Active 12 DOM
-
2026-06-04days on market $225,000 Active 9 DOM
-
2026-06-03days on market $225,000 Active 8 DOM
-
2026-06-02days on market $225,000 Active 7 DOM
-
2026-06-01days on market $225,000 Active 6 DOM
-
2026-05-31days on market $225,000 Active 5 DOM
-
2026-05-26$225,000 Active
-
2020-08-31soldstatus $122,000
-
2020-08-13soldstatus 363-char remark
Show marketing remark (439 chars)
VERY AFFORDABLE!!! Private, year round or vacation, 3 bdrm renovated ranch with Florida room, carport, and storage shed. Move in ready and easy to maintain. Friendly, low key, low dues community with lovely lake and sandy beach, large picnic and entertaining pavilion, ball field, and playground. Low taxes. Commutable distance to NYC and other major metro areas. , Beds Description: 2+Bed1st, Baths: 1 Bath Level 1, Eating Area: Modern KT
-
2020-08-13soldstatus $122,000 439-char remark
Show marketing remark (439 chars)
VERY AFFORDABLE!!! Private, year round or vacation, 3 bdrm renovated ranch with Florida room, carport, and storage shed. Move in ready and easy to maintain. Friendly, low key, low dues community with lovely lake and sandy beach, large picnic and entertaining pavilion, ball field, and playground. Low taxes. Commutable distance to NYC and other major metro areas. , Beds Description: 2+Bed1st, Baths: 1 Bath Level 1, Eating Area: Modern KT
-
2020-06-25$129,000 363-char remark
Show marketing remark (439 chars)
VERY AFFORDABLE!!! Private, year round or vacation, 3 bdrm renovated ranch with Florida room, carport, and storage shed. Move in ready and easy to maintain. Friendly, low key, low dues community with lovely lake and sandy beach, large picnic and entertaining pavilion, ball field, and playground. Low taxes. Commutable distance to NYC and other major metro areas. , Beds Description: 2+Bed1st, Baths: 1 Bath Level 1, Eating Area: Modern KT
-
2020-06-25$129,000 439-char remark
Show marketing remark (439 chars)
VERY AFFORDABLE!!! Private, year round or vacation, 3 bdrm renovated ranch with Florida room, carport, and storage shed. Move in ready and easy to maintain. Friendly, low key, low dues community with lovely lake and sandy beach, large picnic and entertaining pavilion, ball field, and playground. Low taxes. Commutable distance to NYC and other major metro areas. , Beds Description: 2+Bed1st, Baths: 1 Bath Level 1, Eating Area: Modern KT
-
2005-10-05soldstatus $90,000
-
1988-12-15soldstatus $50,000
ⓘ Source: listings_history table (triggers on properties + properties_extension) + one-shot
backfill from property_details.listing_events for pre-trigger history.
Tax reassessment forecast PA · Partial reset (capped growth)
- Current annual tax
- $1,570 · $131/mo
- Projected year-2 tax
- $2,562 · $214/mo
- Expected delta
- +$993/yr (+$83/mo · 63.2%)
ⓘ Screening estimate from a state-policy table — verify with the county assessor before closing.
Climate risk First Street
- Flood 1/10 Low FEMA zone X (unshaded) · 0% chance over 30 yrs
- Wildfire 1/10 Low
- Heat 2/10 Low 7 d/yr ≥91°F today · 16 d/yr by 30 yrs out
- Wind 2/10 Low 3% chance of damaging wind over 30 yrs
- Air quality 2/10 Low 1 unhealthy d/yr today · 2 by 30 yrs out
Nearby sold comps map
Loading sold comps map…
Walkable amenities ~0.75 mi
Loading nearby amenities…
Taxation est. · year 1
- Rental income
- $26,551
- − Mortgage interest
- −$12,603
- − Property taxes
- −$1,570
- − Insurance
- −$1,125
- − Repairs & maintenance
- −$2,124
- − Management
- −$2,124
- − Depreciation
- −$6,545
- Taxable income
- $459
- Est. tax owed @ 24.0%
- −$110
- After-tax cash flow
- $4,011/yr
For passive investors: Depreciation is non-cash, so a rental often shows a tax loss while cash-flowing — sheltering income. Rental losses are passive: they offset passive income freely, and up to $25,000/yr can offset ordinary (W-2) income if you actively participate and your MAGI is under $100k (phasing out to $0 by $150k); unused losses carry forward. On sale, claimed depreciation is recaptured at up to 25%, and gains may owe capital-gains tax (a 1031 exchange can defer both). Figures are a year-1 estimate at your 24.0% rate — not tax advice; consult a CPA.
Schools (NCES district)
- District
- Wallenpaupack Area SD
- NCES district ID
- 4224750
- Math proficiency
- 39% ▼ -10.00%
- Reading proficiency
- 59% ▼ -5.00%
- Median HH income
- $51,027
- Composite
- 41.97/100
- National rank
- #3345
- State rank
- #192 of 539 in PA
Livability — The Hideout
- Score
- 72/100
- State rank
- #668
- US rank
- #6516
Category grades
Schools grade is shown separately in the Schools card above.
Census & demographics
- Population (ZIP)
- 12,446
Population outlook (Wayne County) Hauer SSP2
- Today (2025)
- 47,924 people
- By 2030
- 46,191 · -3.6%
- By 2040
- 42,815 · -10.7%
- By 2050
- 39,873 · -16.8%
- By 2075
- 34,556 · -27.9%
- By 2100
- 28,358 · -40.8%
Race, ethnicity, and origin ACS 2023
- Neighborhood character
- Predominantly White (85%)
- Race & ethnicity
- White 85% Hispanic / Latino 8% Two or more races 6% Black 1% Asian 1%
- Hispanic origin (detail)
- Puerto Rican 5%
- Common ancestry
- Romanian 5% Portuguese 3% Italian 2%
- Foreign-born
- 5% · Canada
- Languages at home
- 91% English-only · Spanish 5% Russian/Polish/Slavic 1% Other Asian/Pacific 1%
Political lean MEDSL · Wayne
- 2024 margin
- Solid R (+37.1) · D 31.1% · R 68.2%
- 2008→2024 swing
- -24.8pp toward R · 2008: -12.3pp · 2024: -37.1pp
- All cycles
- 2024: R+37.1 2020: R+33.6 2016: R+39.7 2012: R+20.9 2008: R+12.3
Not yet ingested
- Civics
- —
Market trends
- HPI YoY
- ▲ 28.60%
- Current HPI
- 340.8254
- Rent YoY
- —
- Metro
- —
- State GDP YoY
- ▲ 1.68%
- F500 in state
- 34
Industry mix (Fortune 500 HQ in PA)
| Industry | F500 HQs | Revenue |
|---|---|---|
| Healthcare | 2 | $309B |
|
||
| Insurance | 2 | $27B |
|
||
| Telecommunications / Media | 1 | $124B |
|
||
| Industrial Distribution | 1 | $22B |
|
||
| Financial Services | 1 | $20B |
|
||
| Chemicals / Materials | 1 | $18B |
|
||
Price history
+350.0% since first listed8 events — show timeline
- 2026-05-26 Listed $225,000 FSBO.com
- 2020-08-31 Sold (Public Records) $122,000 Public Records
- 2020-08-13 Sold (MLS) $122,000 PWMLS
- 2020-08-13 Sold (MLS) — PWMLS
- 2020-06-25 Listed $129,000 PWMLS
- 2020-06-25 Listed $129,000 PWMLS
- 2005-10-05 Sold (Public Records) $90,000 Public Records
- 1988-12-15 Sold (Public Records) $50,000 Public Records
Property tax history
+4.0%/yrLatest (2026): $1,570 · +2.3% YoY. Source: county tax records.
Cash-flow waterfall
monthlySold comps — $/sqft
last 12 mo · ≤1 miLoading sold comps…