None · West Hartford, CT
Flood risk 1/10 · Minimal
- FEMA flood zone
- X (unshaded)
- Chance of flooding over 30 yrs
- 0.0%
- Est. flood insurance / yr
- $473 – $860
Fire risk 1/10 · Minimal
- Est. fire insurance / yr
- $829 – $1,539
Heat risk 5/10 · Moderate
- Hot days now (above 98°F)
- 7 days/yr
- Hot days in 30 yrs
- 16 days/yr
Wind risk 6/10 · Moderate
- Chance of severe wind over 30 yrs
- 27.0%
Air-quality risk 3/10 · Minor
- Unhealthy air days now
- 3 days/yr
- Unhealthy air days in 30 yrs
- 4 days/yr
Risk factors via First Street. Map © Google.
Why this score? — see what drove the C- grade
The composite is a weighted blend of 9 inputs, each scored 0–100. Each bar is that input's sub-score; the figure is the points it added to the 100-point composite (weight × sub-score).
- ARV discount +15.0/15.0
- Cash flow +14.1/30.0
- Schools +5.6/10.0
- 1% rule +5.1/10.0
- DSCR +4.3/10.0
- Livability +4.0/5.0
- Rent growth +2.5/5.0
- Condition / age +2.5/5.0
- Appreciation +0.0/10.0
$480,000
🖨 Deal sheet (PDF) 📄 Offer letter ✓ Due diligence
Listing remarks MLS
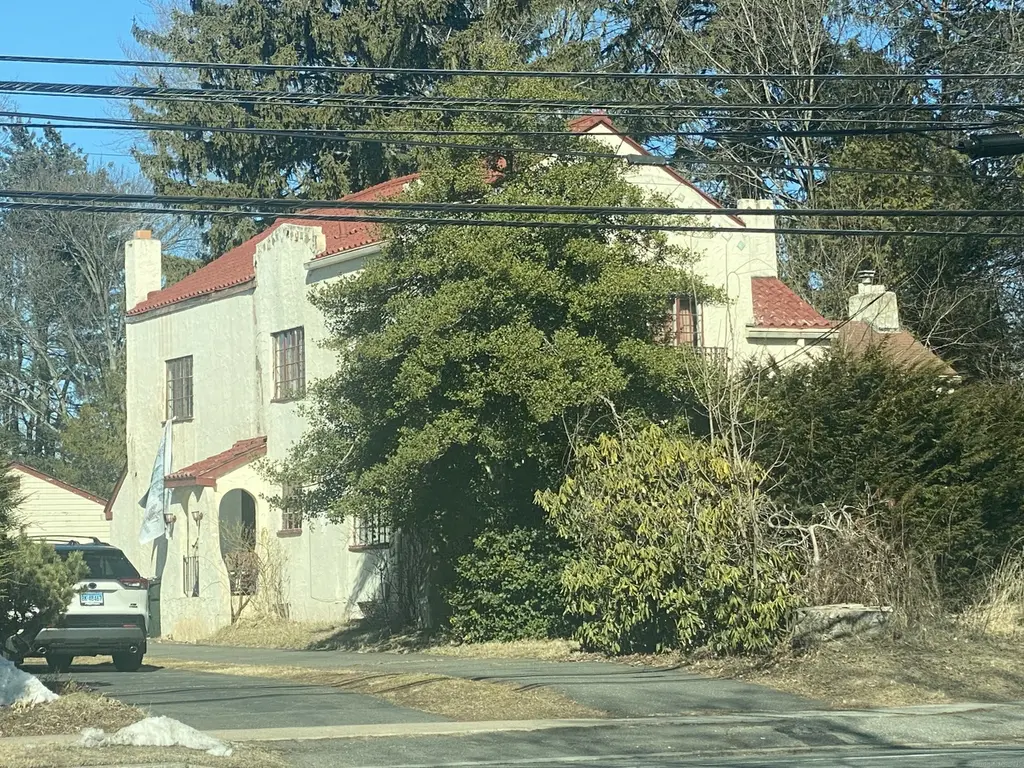
This is a Colonial Style Home near West Hartford center that has 4 bedrooms, 3.5 bathrooms, and is 2,698 Square Feet of Living Space. This home has a detached 2 car garage and has a stucco exterior and gable roof. IMPORTANT: This property is occupied and cannot be shown, do not make any attempts to go on the property - view from the street only. ALL OFFERS must be CASH ONLY. There is NO FINANCING, AS IS, NO INSPECTIONS. Do not step on the property or communicate witih the occupants. Visit auction.com for more information and direct all questions to them.
Key facts
- Gable roof
- Colonial style home
- Stucco exterior
Tags
Neighborhood map
What this means for you Summary
Snapshot
- This is a 4-bed/3.5-bath single-family listed at $480k.
Deal economics
- At list price, monthly cash flow is $67 ($807/yr) — positive.
- The deal already cash-flows at list — no discount required.
- Meets the 1% rule at list price ($5k rent vs $480k).
- Recommended offer: $422k (12.0% below list) — sets the bar for market timing.
- Cap rate 6.5% vs local median 3.3% in West Hartford — top-decile yield for the area; either an underpriced asset or a hidden risk that comps aren't pricing in. Stress-test before assuming the spread holds.
Location & tenants
- Location reads 79/100 on livability (#27 in CT, #1,989 nationally) — a middle-class / working-renter tenant base. Strengths: schools A+, employment A+, housing A+; Watch: amenities F, cost of living F.
- West Hartford School District (urban): math 56% / reading 67% proficiency, ranked #39 of 153 in CT (top 26%) — acceptable for families but not a draw, mixed tenant base, ~2y average lease; only 16% free/reduced lunch — higher-income household profile.
- Market conditions: 87 active listings in the ZIP; 7 comparable units currently listed for rent nearby; rentals at typical pace (median 25d on market — plan ~3-4 weeks tenant-placement turnaround); 43% of comp listings sitting > 30 days — soft ceiling on asking rent; high-income renter base; 1,867 units permitted in Capitol Planning Region in 2024 (1,399 in 5+ unit buildings).
- This rent runs 33% of the median local income ($175k/yr) — at the standard rent-burdened threshold; future hikes will face affordability resistance.
Forward outlook
- Local home prices are declining (-3.0%/yr); year-one equity from $3k of loan paydown is wiped out by about $14k of value loss. Plan a longer hold.
Negotiation context
- It's been on market 381 days — a 12% lower offer ($422k) is reasonable based on typical stale-listing flexibility.
- 6 sale attempts since 23y ago with the ask held roughly flat each time — persistent listings suggest the price (not the market) is what's stuck; bring a comps-based counter.
- Current owner paid $335k; 43% above their basis — modest negotiation headroom, anchor on the comps not their cost.
Risks & watch-outs
- Watch-outs: property tax is 2.6% of price; built in 1928 — expect roof / HVAC / electrical / plumbing capex.
- Climate carrying-cost: major wind risk, 27% chance of damaging wind over 30y; extreme-heat days projected 7→16/yr by 2055 (HVAC capex compounding) — expect insurance premiums to compound above CPI over the hold.
Questions for the listing agent
- It's been on market 381 days. Have you received any prior offers? Is the seller open to a 12% concession, seller financing, or rate buy-down credit?
- Built in 1928 — when were the roof, HVAC, electrical panel, plumbing, and water heater last replaced?
- Property tax is high relative to price — has the assessment been appealed recently, and will the sale trigger a re-assessment?
- Why hasn't it sold? Are there any deal-killer items the seller is aware of (foundation, flood, title, zoning, code violations)?
- Is there a deadline driving the sale (1031 exchange, divorce, estate, relocation)? That informs how much negotiation room exists.
- Schools are A-rated — typically a magnet for longer-tenancy family renters. What's the average tenant stay here, and is there a school-zone premium baked into asking?
- What's the average days-on-market for RENTAL listings here right now (not sales)? A rising rental-DOM trend means longer vacancies and softer asking-rent achievability than the comps imply.
- What's the recent tenant-quality profile in this submarket — average credit score on applications, eviction rate, late-payment / NSF rate, and stable-employment percentage? A property-management company in the area should have these aggregated.
- How much new for-sale + rental construction is in the pipeline within 1–3 miles? Heavy new supply typically softens prices + rents 12–24 months out; constrained supply supports both.
Investment metrics
- 1% rule
- 1.01% ✓
- Cap rate
- 6.46%
- Cash-on-cash
- 0.60%
- DSCR
- 1.03
- GRM
- 8.3
CMA / ARV
- ARV (median comp)
- $736,456
- List price
- $480,000
- Delta
- -34.82%
- Verdict
- UNDERPRICED
- Comps
- 20 within 1.0 mi
Show comp detail 12 sales within ~0.75 mi
| Address | Dist | Beds/Ba | Sqft | Sold | Price | $/sf | Match |
|---|---|---|---|---|---|---|---|
| 60 Ridgebrook Dr | 0.24mi | 4/2.5 | 2,572 (-5%) | 3mo | $470,000 | $183 | 74 |
| 6 Paxton Rd | 0.13mi | 4/2.5 | 2,956 (+10%) | 1mo | $860,000 | $291 | 73 |
| 157 Four Mile Rd | 0.13mi | 4/2.5 | 2,380 (-12%) | 4mo | $805,000 | $338 | 67 |
| 30 Sedgwick Rd | 0.07mi | 4/2.5 | 2,308 (-14%) | 3mo | $801,000 | $347 | 66 |
| 94 Westminster Dr | 0.50mi | 4/3.0 | 2,550 (-6%) | 2mo | $589,000 | $231 | 64 |
| 602 Park Rd | 0.35mi | 4/2.5 | 2,970 (+10%) | 1mo | $702,500 | $237 | 62 |
| 81 Meadowbrook Rd | 0.34mi | 4/2.5 | 3,091 (+15%) | 1mo | $750,000 | $243 | 55 |
| 51 Lemay St | 0.36mi | 4/2.5 | 2,324 (-14%) | 5mo | $615,000 | $265 | 52 |
| 20 Lemay St | 0.44mi | 4/2.0 | 2,323 (-14%) | 1mo | $750,000 | $323 | 49 |
| 2016 Boulevard | 0.65mi | 4/2.5 | 2,980 (+10%) | 0mo | $765,000 | $257 | 48 |
| 84 Grennan Rd | 0.71mi | 5/2.5 (+1) | 2,865 (+6%) | 1mo | $575,000 | $201 | 47 |
| 50 Tunxis Rd | 0.63mi | 3/2.5 (-1) | 2,456 (-9%) | 5mo | $805,000 | $328 | 42 |
Match score weights: distance 35% · size 25% · config 20% · recency 20%. Top-matched comps best support the ARV.
Projected returns pro-forma
-3.0% appreciation · 3.0% rent growth · sell at horizon
- IRR
- -15.3%
- Equity multiple
- 0.46×
- Total profit
- $-73,160
- Equity at exit
- $71,570
- IRR
- -6.6%
- Equity multiple
- 0.58×
- Total profit
- $-56,823
- Equity at exit
- $41,502
Cash invested: $134,400 (down + closing). Projections, not guarantees.
Landlord ↔ Tenant lean methodology
- Overall (STATE)
- 27 Tenant-Leaning
- State Connecticut
- 27 Tenant-Leaning · D+7
- County
- — inherits STATE
- City
- — inherits STATE
ZIP-level market 06107
- Active inventory
- 87
- Price-to-rent
- 8.3×
Monthly cashflow live
- Estimated rent
- $4,827 high interval (Pro) →
- Mortgage (P&I)
- −$2,517
- Tax from tax record
- −$1,029 /mo · $12,347/yr
- Insurance
- −$200
- HOA
- −$0
- Vacancy / Maint / Mgmt
- −$1,014
- Net cashflow
- $67
Break-even live
Sensitivity live
| Price | -10% $339 | -5% $203 | +0% $67 | +5% $-69 | +10% $-204 |
|---|---|---|---|---|---|
| Rent | -10% $-314 | -5% $-123 | +0% $67 | +5% $258 | +10% $449 |
| Rate | -1.0pp $309 | -0.5pp $189 | base $67 | +0.5pp $-57 | +1.0pp $-184 |
UW: 25.0% down · 7.5% · 30yr · 1.5% tax · 5.0% vac · 8.0% maint · 8.0% mgmt
Financing live
Cash to close
- Down payment
- $120,000
- Closing costs
- $14,400
- Reserves months
- —
- Total cash needed
- —
Loan-product check · same deal, 3 products live
Conventional
25% down · 7.5% · 30yr
- Down + closing
- —
- Monthly P&I
- —
- Monthly cashflow
- —
- DSCR
- —
- Eligible?
- —
Personal DTI + credit; lowest rate.
DSCR
20% down · 8.5% · 30yr
- Down + closing
- —
- Monthly P&I
- —
- Monthly cashflow
- —
- DSCR
- —
- Eligible?
- —
No personal income docs; deal must DSCR.
Hard money
10% down · 12.0% · 12mo
- Down + closing
- —
- Monthly P&I
- —
- Monthly cashflow
- —
- DSCR
- —
- Eligible?
- —
Short-term bridge; refi at stabilization.
Rent comps 7 comps
| Address | Beds | Baths | Sqft | Rent | $/sqft | DOM | Units | Dist |
|---|---|---|---|---|---|---|---|---|
| 1729 Boulevard West Hartford, CT | 5.0 | 3.5 | 3004 | $6,500 | $2.16 | 24d | 1 | 0.19mi |
| 16 Thomson Rd West Hartford, CT | 3.0 | 2.0 | 2144 | $1,350 | $0.63 | 17d | 1 | 0.47mi |
| 103 Seymour Ave West Hartford, CT | 4.0 | 2.0 | 2080 | $2,500 | $1.20 | 45d | 1 | 1.10mi |
| 28 Ashford Rd West Hartford, CT | 4.0 | 2.5 | 1779 | $3,950 | $2.22 | 21d | 1 | 1.10mi |
| 18 Maplewood Ave Unit Second West Hartford, CT | 3.0 | 1.5 | 2050 | $2,750 | $1.34 | 45d | 1 | 1.31mi |
| 54 Berkshire Rd West Hartford, CT | 3.0 | 2.0 | 1928 | $3,300 | $1.71 | 13d | 1 | 1.37mi |
| 30 Hillsboro Dr West Hartford, CT | 3.0 | 2.5 | 2458 | $4,500 | $1.83 | 45d | 1 | 1.47mi |
Listing history 30 events
-
2026-06-18days on market $480,000 Active 381 DOM
-
2026-06-17days on market $480,000 Active 380 DOM
-
2026-06-16days on market $480,000 Active 379 DOM
-
2026-06-15days on market $480,000 Active 378 DOM
-
2026-06-13days on market $480,000 Active 376 DOM
-
2026-06-10days on market $480,000 Active 373 DOM
-
2026-06-09days on market $480,000 Active 372 DOM
-
2026-06-08days on market $480,000 Active 371 DOM
-
2026-06-07days on market $480,000 Active 370 DOM
-
2026-06-05days on market $480,000 Active 367 DOM
-
2026-06-03days on market $480,000 Active 366 DOM
-
2026-06-02days on market $480,000 Active 365 DOM
-
2026-06-01days on market $480,000 Active 364 DOM
-
2026-05-31days on market $480,000 Active 363 DOM
-
2025-11-21price $480,000 560-char remark
Show marketing remark (560 chars)
This is a Colonial Style Home near West Hartford center that has 4 bedrooms, 3.5 bathrooms, and is 2,698 Square Feet of Living Space. This home has a detached 2 car garage and has a stucco exterior and gable roof. IMPORTANT: This property is occupied and cannot be shown, do not make any attempts to go on the property - view from the street only. ALL OFFERS must be CASH ONLY. There is NO FINANCING, AS IS, NO INSPECTIONS. Do not step on the property or communicate witih the occupants. Visit auction.com for more information and direct all questions to them.
-
2025-06-02$490,000 Active 560-char remark
Show marketing remark (560 chars)
This is a Colonial Style Home near West Hartford center that has 4 bedrooms, 3.5 bathrooms, and is 2,698 Square Feet of Living Space. This home has a detached 2 car garage and has a stucco exterior and gable roof. IMPORTANT: This property is occupied and cannot be shown, do not make any attempts to go on the property - view from the street only. ALL OFFERS must be CASH ONLY. There is NO FINANCING, AS IS, NO INSPECTIONS. Do not step on the property or communicate witih the occupants. Visit auction.com for more information and direct all questions to them.
-
2025-05-30historical
-
2025-04-02status Active
-
2025-03-28status Under Contract
-
2025-03-01$490,000 Active
-
2024-12-17historical
-
2024-06-14status Under Contract
-
2024-06-14$449,900 Active
-
2024-06-05historical
-
2013-08-15historical
-
2013-05-28$429,900
-
2003-07-09soldstatus $335,000
-
2003-07-07soldstatus $335,000
-
2003-01-23$358,000
-
1997-08-19soldstatus $220,000
ⓘ Source: listings_history table (triggers on properties + properties_extension) + one-shot
backfill from property_details.listing_events for pre-trigger history.
Tax reassessment forecast CT · Partial reset (capped growth)
- Current annual tax
- $12,347 · $1,029/mo
- Projected year-2 tax
- $12,347 · $1,029/mo
- Expected delta
- $0/yr ($0/mo · 0.0%)
ⓘ Screening estimate from a state-policy table — verify with the county assessor before closing.
Climate risk First Street
- Flood 1/10 Low FEMA zone X (unshaded) · 0% chance over 30 yrs
- Wildfire 1/10 Low
- Heat 5/10 Major 7 d/yr ≥98°F today · 16 d/yr by 30 yrs out
- Wind 6/10 Major 27% chance of damaging wind over 30 yrs
- Air quality 3/10 Moderate 3 unhealthy d/yr today · 4 by 30 yrs out
Nearby sold comps map
Loading sold comps map…
Walkable amenities ~0.75 mi
Loading nearby amenities…
Taxation est. · year 1
- Rental income
- $57,924
- − Mortgage interest
- −$26,887
- − Property taxes
- −$12,347
- − Insurance
- −$2,400
- − Repairs & maintenance
- −$4,634
- − Management
- −$4,634
- − Depreciation
- −$13,964
- Taxable loss
- −$6,942
- Est. tax savings @ 24.0%
- +$1,666
- After-tax cash flow
- $2,473/yr
For passive investors: Depreciation is non-cash, so a rental often shows a tax loss while cash-flowing — sheltering income. Rental losses are passive: they offset passive income freely, and up to $25,000/yr can offset ordinary (W-2) income if you actively participate and your MAGI is under $100k (phasing out to $0 by $150k); unused losses carry forward. On sale, claimed depreciation is recaptured at up to 25%, and gains may owe capital-gains tax (a 1031 exchange can defer both). Figures are a year-1 estimate at your 24.0% rate — not tax advice; consult a CPA.
Schools (NCES district)
- District
- West Hartford School District
- NCES district ID
- 0904920
- Math proficiency
- 56% ▼ -6.00%
- Reading proficiency
- 67% ▼ -5.00%
- Median HH income
- $85,173
- Composite
- 55.64/100
- National rank
- #1228
- State rank
- #39 of 153 in CT
Livability — West Hartford
- Score
- 79/100
- State rank
- #27
- US rank
- #1989
Category grades
Schools grade is shown separately in the Schools card above.
Census & demographics
- Census place
- West Hartford, CT
- County
- Hartford County · 754,208 people
- City population
- 63,441
- Metro
- Hartford-East Hartford-Middletown, CT
- Population (ZIP)
- 19,891
- Household income
- $174,844
- Rent vs Own
- Severe rent burden
- 315.0
Population outlook (Capitol County) Hauer SSP2
- By 2040
- 1,063,519
Race, ethnicity, and origin ACS 2023
- Neighborhood character
- Predominantly White (79%)
- Race & ethnicity
- White 79% Hispanic / Latino 8% Two or more races 7% Asian 6% Black 2%
- Hispanic origin (detail)
- Puerto Rican 3%
- Common ancestry
- Romanian 6% Lithuanian 4% Scotch-Irish 2%
- Foreign-born
- 13% · Canada, China, Jamaica
- Languages at home
- 84% English-only · Spanish 5% Other Indo-European 4% Other Asian/Pacific 3%
Political lean MEDSL · Capitol
- 2024 margin
- Strong D (+21.9) · D 60.1% · R 38.2% · Other 1.7%
- All cycles
- 2024: D+21.9
Not yet ingested
- Civics
- —
Market trends
- HPI YoY
- ▼ -337.48%
- Current HPI
- 175.8458
- Rent YoY
- —
- Metro
- Hartford-East Hartford-Middletown, CT
- State GDP YoY
- ▲ 1.06%
- F500 in state
- 38
Industry mix (Fortune 500 HQ in CT)
| Industry | F500 HQs | Revenue |
|---|---|---|
| Industrial Machinery | 4 | $38B |
|
||
| Insurance | 3 | $71B |
|
||
| Financial Services | 2 | $25B |
|
||
| Transportation / Logistics | 2 | $18B |
|
||
| Healthcare | 1 | $247B |
|
||
| Telecommunications | 1 | $55B |
|
||
Price history
+118.2% since first listed16 events — show timeline
- 2025-11-21 Price Changed $480,000 Smart MLS
- 2025-06-02 Listed $490,000 Smart MLS
- 2025-05-30 Listing Removed — Smart MLS
- 2025-04-02 Relisted — Smart MLS
- 2025-03-28 Pending — Smart MLS
- 2025-03-01 Listed $490,000 Smart MLS
- 2024-12-17 Listing Removed — Smart MLS
- 2024-06-14 Pending — Smart MLS
- 2024-06-14 Listed $449,900 Smart MLS
- 2024-06-05 Coming Soon — Smart MLS
- 2013-08-15 Listing Removed — Smart MLS
- 2013-05-28 Listed $429,900 Smart MLS
- 2003-07-09 Sold (Public Records) $335,000 Public Records
- 2003-07-07 Sold (MLS) $335,000 Smart MLS
- 2003-01-23 Listed $358,000 Smart MLS
- 1997-08-19 Sold (Public Records) $220,000 Public Records
Property tax history
+1.9%/yrLatest (2025): $12,347 · +5.7% YoY. Source: county tax records.
Cash-flow waterfall
monthlySold comps — $/sqft
last 12 mo · ≤1 miLoading sold comps…