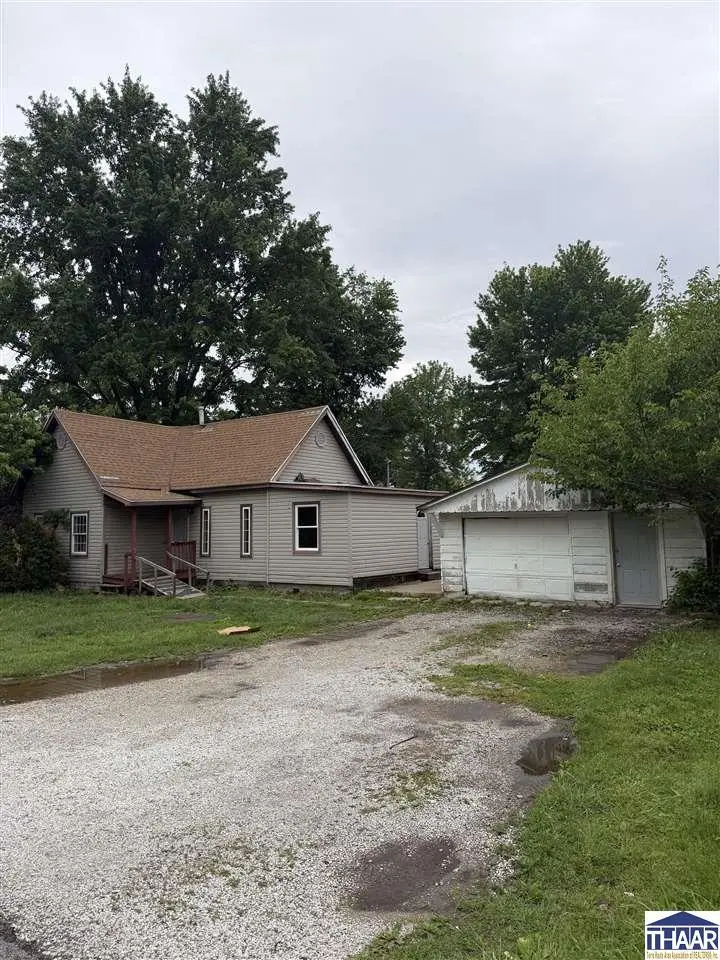
210 W Columbus St · Staunton, IN
Flood risk 1/10 · Minimal
- FEMA flood zone
- X (unshaded)
- Chance of flooding over 30 yrs
- 0.0%
- Est. flood insurance / yr
- $507 – $1,088
Fire risk 1/10 · Minimal
- Est. fire insurance / yr
- $717 – $1,331
Heat risk 3/10 · Minor
- Hot days now (above 104°F)
- 7 days/yr
- Hot days in 30 yrs
- 19 days/yr
Wind risk 2/10 · Minimal
- Chance of severe wind over 30 yrs
- 1.0%
Air-quality risk 5/10 · Moderate
- Unhealthy air days now
- 5 days/yr
- Unhealthy air days in 30 yrs
- 8 days/yr
Risk factors via First Street. Map © Google.
Why this score? — see what drove the B grade
The composite is a weighted blend of 9 inputs, each scored 0–100. Each bar is that input's sub-score; the figure is the points it added to the 100-point composite (weight × sub-score).
- Cash flow +30.0/30.0
- 1% rule +10.0/10.0
- DSCR +10.0/10.0
- ARV discount +7.5/15.0
- Schools +4.0/10.0
- Livability +2.9/5.0
- Appreciation +2.5/10.0
- Rent growth +2.5/5.0
- Condition / age +2.5/5.0
$49,999
🖨 Deal sheet 📄 Offer letter ✓ Due diligence
Listing remarks
Located at 210 W Columbus St, Staunton, IN, this 1 bedroom, 2 bath home offers just under 900 square feet of living space and includes a 1 car detached garage. The property is a full rehab and presents a strong opportunity for investors or buyers looking to add value through renovation.
Key facts
- 8,712 sq ft lot
- Garage
- Built 1900
Property features AI
Exterior
- Parking: Detached 1-car garage
- Home design: Single-family residence; One-story
- Exterior features: Residential lot in a zoned residential area; Lot approximately 0.2 acres
Interior
- Bathrooms: 2 full bathrooms
- Interior features: Partial basement
Neighborhood map
What this means for you Summary
Snapshot
- This is a 1-bed/1.0-bath single-family listed at $50k.
Deal economics
- At list price, monthly cash flow is $347 ($4k/yr) — positive.
- The deal already cash-flows at list — no discount required.
- Meets the 1% rule at list price ($848 rent vs $50k).
- Recommended offer: $49k (1.5% below list) — sets the bar for market timing.
Location & tenants
- Location reads 58/100 on livability (#597 in IN) — a working-class tenant base; expect higher turnover. Strengths: cost of living A+, housing A+; Watch: crime D+, employment D+, schools F.
- Clay Community Schools (rural): math 46% / reading 49% proficiency, ranked #79 of 301 in IN (top 26%) — families likely to look elsewhere, expect single-tenant / working-renter base with shorter leases.
- Market conditions: 7 active listings in the ZIP; 70 units permitted in Clay County in 2024 (0 in 5+ unit buildings).
Forward outlook
- Local home prices are declining (-3.0%/yr); year-one equity from $345 of loan paydown is wiped out by about $2k of value loss. Plan a longer hold.
- Clay County population projected at -16% by 2050 — secular population decline; favor cash flow + early exit over multi-decade hold.
- At projected returns (-3.0% appreciation + 3.0% rent growth), your $14k cash investment doubles in ~5 years — after that, you're playing with house money.
Negotiation context
- It's been on market 21 days — a 2% lower offer ($49k) is reasonable based on typical stale-listing flexibility.
- 2 sale attempts since 20y ago; this cycle's ask has dropped $15k (23%) from the opening price — seller is motivated, your offer sets the floor, not the list.
Risks & watch-outs
- Watch-outs: built in 1900 — expect roof / HVAC / electrical / plumbing capex.
Questions for the listing agent
- Built in 1900 — when were the roof, HVAC, electrical panel, plumbing, and water heater last replaced?
- Is there a deadline driving the sale (1031 exchange, divorce, estate, relocation)? That informs how much negotiation room exists.
- Schools are F-rated, which usually means shorter tenancies and higher turnover. Who's the typical renter profile here, and what's been the actual vacancy rate?
- Crime grade is D in this area — have there been break-ins, vandalism, or insurance claims at this property in the last 3 years? What carrier currently insures it and at what premium?
- What's the average days-on-market for RENTAL listings here right now (not sales)? A rising rental-DOM trend means longer vacancies and softer asking-rent achievability than the comps imply.
- What's the recent tenant-quality profile in this submarket — average credit score on applications, eviction rate, late-payment / NSF rate, and stable-employment percentage? A property-management company in the area should have these aggregated.
- How much new for-sale + rental construction is in the pipeline within 1–3 miles? Heavy new supply typically softens prices + rents 12–24 months out; constrained supply supports both.
Investment metrics
- 1% rule
- 1.70% ✓
- Cap rate
- 14.61%
- Cash-on-cash
- 29.71%
- DSCR
- 2.32
- GRM
- 4.9
CMA / ARV
- ARV (median comp)
- $168,958
- List price
- $49,999
- Delta
- -70.41%
- Verdict
- UNDERPRICED
- Comps
- 2 within 2.0 mi
Projected returns pro-forma
-3.0% appreciation · 3.0% rent growth · sell at horizon
- IRR
- 24.2%
- Equity multiple
- 2.00×
- Total profit
- $13,974
- Equity at exit
- $7,455
- IRR
- 32.1%
- Equity multiple
- 3.90×
- Total profit
- $40,592
- Equity at exit
- $4,323
Cash invested: $14,000 (down + closing). Projections, not guarantees.
Landlord ↔ Tenant lean methodology
- Overall (STATE)
- 90 Strongly Landlord-Friendly
- State Indiana
- 90 Strongly Landlord-Friendly · R+11
- County
- — inherits STATE
- City
- — inherits STATE
ZIP-level market 47881
- Home prices YoY
- -2.7%
- Active inventory
- 7
- Price-to-rent
- 4.9×
Monthly cashflow live
- Estimated rent
- $848 medium interval (Pro) →
- Mortgage (P&I)
- −$262
- Tax from tax record
- −$40 /mo · $486/yr
- Insurance
- −$21
- HOA
- −$0
- Vacancy / Maint / Mgmt
- −$178
- Net cashflow
- $347
Break-even live
UW: 25.0% down · 7.5% · 30yr · 1.5% tax · 5.0% vac · 8.0% maint · 8.0% mgmt
Financing live
Cash to close
- Down payment
- $12,500
- Closing costs
- $1,500
- Reserves months
- —
- Total cash needed
- —
Loan-product check · same deal, 3 products live
Conventional
25% down · 7.5% · 30yr
- Down + closing
- —
- Monthly P&I
- —
- Monthly cashflow
- —
- DSCR
- —
- Eligible?
- —
Personal DTI + credit; lowest rate.
DSCR
20% down · 8.5% · 30yr
- Down + closing
- —
- Monthly P&I
- —
- Monthly cashflow
- —
- DSCR
- —
- Eligible?
- —
No personal income docs; deal must DSCR.
Hard money
10% down · 12.0% · 12mo
- Down + closing
- —
- Monthly P&I
- —
- Monthly cashflow
- —
- DSCR
- —
- Eligible?
- —
Short-term bridge; refi at stabilization.
Listing history 5 events
-
2026-05-17price $54,999 287-char remark
-
2026-05-11price $59,999 287-char remark
-
2026-05-06$64,999 Active 287-char remark
-
2006-10-22historical
-
2006-04-22$69,900
ⓘ Source: listings_history table (triggers on properties + properties_extension) + one-shot
backfill from property_details.listing_events for pre-trigger history.
Tax reassessment forecast IN · Partial reset (capped growth)
- Current annual tax
- $486 · $40/mo
- Projected year-2 tax
- $486 · $40/mo
- Expected delta
- $0/yr ($0/mo · 0.0%)
ⓘ Screening estimate from a state-policy table — verify with the county assessor before closing.
Climate risk First Street
- Flood 1/10 Low FEMA zone X (unshaded) · 0% chance over 30 yrs
- Wildfire 1/10 Low
- Heat 3/10 Moderate 7 d/yr ≥104°F today · 19 d/yr by 30 yrs out
- Wind 2/10 Low 100% chance of damaging wind over 30 yrs
- Air quality 5/10 Major 5 unhealthy d/yr today · 8 by 30 yrs out
Nearby sold comps map
Loading sold comps map…
Walkable amenities ~0.75 mi
Loading nearby amenities…
Taxation est. · year 1
- Rental income
- $10,179
- − Mortgage interest
- −$2,801
- − Property taxes
- −$486
- − Insurance
- −$250
- − Repairs & maintenance
- −$814
- − Management
- −$814
- − Depreciation
- −$1,455
- Taxable income
- $3,560
- Est. tax owed @ 24.0%
- −$854
- After-tax cash flow
- $3,305/yr
For passive investors: Depreciation is non-cash, so a rental often shows a tax loss while cash-flowing — sheltering income. Rental losses are passive: they offset passive income freely, and up to $25,000/yr can offset ordinary (W-2) income if you actively participate and your MAGI is under $100k (phasing out to $0 by $150k); unused losses carry forward. On sale, claimed depreciation is recaptured at up to 25%, and gains may owe capital-gains tax (a 1031 exchange can defer both). Figures are a year-1 estimate at your 24.0% rate — not tax advice; consult a CPA.
Schools (NCES district)
- District
- Clay Community Schools
- NCES district ID
- 1800840
- Math proficiency
- 46% ▼ -6.00%
- Reading proficiency
- 49% ▼ -1.00%
- Median HH income
- $46,673
- Composite
- 40.39/100
- National rank
- #3733
- State rank
- #79 of 301 in IN
Livability — Staunton
- Score
- 58/100
- State rank
- #597
- US rank
- #21392
Category grades
Schools grade is shown separately in the Schools card above.
Census & demographics
- Census place
- Staunton, IN
- City population
- 253
- Population (ZIP)
- 253
Population outlook (Clay County) Hauer SSP2
- Today (2025)
- 25,820 people
- By 2030
- 25,182 · -2.5%
- By 2040
- 23,562 · -8.7%
- By 2050
- 21,829 · -15.5%
- By 2075
- 17,939 · -30.5%
- By 2100
- 14,042 · -45.6%
Race, ethnicity, and origin ACS 2023
- Neighborhood character
- Predominantly White (99%)
- Race & ethnicity
- White 99%
- Common ancestry
- Slovak 11% Italian 4% Scottish 4%
- Foreign-born
- 1% · Canada, Dominican Republic
- Languages at home
- 99% English-only · Spanish 1%
Political lean MEDSL · Clay
- 2024 margin
- Solid R (+56.9) · D 20.7% · R 77.6% · Other 1.7%
- 2008→2024 swing
- -45.4pp toward R · 2008: -11.5pp · 2024: -56.9pp
- All cycles
- 2024: R+56.9 2020: R+56.6 2016: R+55.3 2012: R+31.4 2008: R+11.5
Not yet ingested
- Civics
- —
Market trends
- HPI YoY
- ▼ -5.00%
- Current HPI
- 179.9156
- Rent YoY
- —
- Metro
- —
- State GDP YoY
- ▲ 2.90%
- F500 in state
- 18
Industry mix (Fortune 500 HQ in IN)
| Industry | F500 HQs | Revenue |
|---|---|---|
| Industrial Machinery | 2 | $37B |
|
||
| Healthcare | 1 | $177B |
|
||
| Pharmaceuticals | 1 | $45B |
|
||
| Metals / Steel | 1 | $18B |
|
||
| Agriculture | 1 | $17B |
|
||
| Packaging | 1 | $12B |
|
||
Price history
-28.5% since first listed6 events — show timeline
- 2026-05-26 Price Changed $49,999 THAAR
- 2026-05-17 Price Changed $54,999 THAAR
- 2026-05-11 Price Changed $59,999 THAAR
- 2026-05-06 Listed $64,999 THAAR
- 2006-10-22 Listing Removed — MIBOR as Distributed by MLS Grid
- 2006-04-22 Listed $69,900 MIBOR as Distributed by MLS Grid
Property tax history
-5.5%/yrLatest (2024): $486 · -15.4% YoY. Source: county tax records.
Cash-flow waterfall
monthlySold comps — $/sqft
last 12 mo · ≤1 miLoading sold comps…